


Summary
Two passive seismic experiments have been carried out across the Trans European Suture Zone (TESZ) from northern Germany to southern Sweden (TOR) and across the Proterozoic-Archaean suture in Finland (SVEKALAPKO) to improve our understanding of the processes involved in the creation of the European continent. Teleseismic earthquakes recorded by the two networks and stations of the GRSN and GEOFON permanent networks have been used for studies of the crust–mantle, and upper mantle seismic discontinuities with the receiver function method. Along the TOR network the depth to the Moho increases from 30 km at the southern edge of the profile to 40 km at the Elbe Line. Between the Elbe Line and TESZ the Moho branches off and whereas the deeper branch continues at 40 km depth to the TESZ a second branch appears at 30–35 km depth. The upper branch descends north of the TESZ to below 55 km under the northern end of the TOR profile. The crustal thickening north of the TESZ is accompanied by an increase in average Vp/Vs values, appearance of intracrustal conversion zones and north dipping features which we interpret as remnants of the subduction and subsequent collision between Avalonia and Baltica. In southern Finland beneath the SVEKALAPKO network the Moho starts in the south at the depth of 40–45 km, plunges to about 65 km depth south of the Archaean-Proterozoic suture. This deepening of the Moho is coincident with a north dipping intracrustal structure apparently related to the subduction and collision and of the Proterozoic and Archaean provinces in Proterozoic. North of the line of the suture the Moho rises smoothly to 45–50 km depth in the Archaean province. Along the TOR profile, 410 and 660 discontinuities were hard to detect. However, manyfold stacking of receiver functions revealed that the conversions from the two discontinuities arrive more or less according to IASP91 predicted time. Across the SVEKALAPKO network 410 and 660 discontinuities arrive markedly earlier than IASP91 theoretical arrival times. In particular north of the Archaean-Proterozoic suture in Finland the 410 and 660 km conversions arrive about 2 s earlier, indicating about 5 per cent higher average upper mantle velocities and lower temperatures than what IASP91 global model predicts.
Introduction
The purpose of this paper is to summarize the results achieved in a receiver function analysis of the data acquired by TOR and SVEKALAPKO temporary seismic networks (Fig. 1).
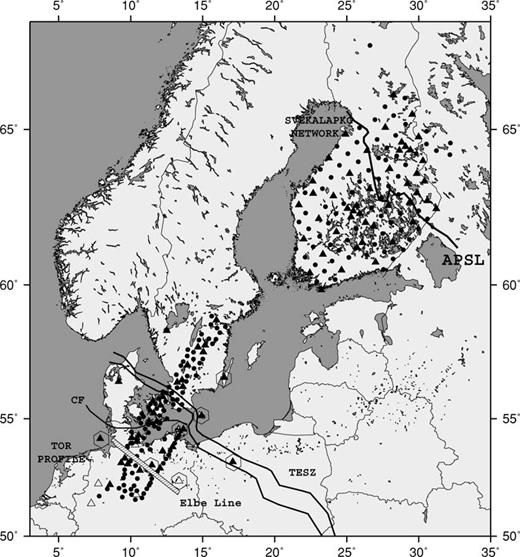
Location map showing the seismographic stations of TOR, SVEKALAPKO, GRSN and GEOFON. The Elbe Line, the Caledonian Front (CF), the Trans-European Suture Zone (TESZ), and the line of suture between Proterozoic and Archaean provinces (APSL) in Finland have been depicted and annotated accordingly. Broad-Band and short period stations have been delineated with triangles and circles, respectively, while the hollow triangles represent the stations of GRSN. The triangles delimited by polygons represent GEOFON stations.
The crust and crust–mantle boundary across the Trans European Suture Zone (TESZ), Europe's longest tectonic lineament has been the subject of a number of controlled seismic source studies and interpretations such as EUGENO-S Working Group (1988), BABEL Working Group (1991) and MONA LISA (1997a,b), Thybo (1998) and Thybo (2000). A pilot passive seismic source measurement carried out during 1994–1995 across the northwestern part of the TESZ known as the Tornquist Zone (Kind 1997) paved the way for installation of the TOR network in a large deployment of seismographic stations during 1996–1997 (Gregersen 1999). The TOR profile with an elongated geometry and consisting of more than 140 stations spreading over a stripe of 900 km long and 100 km wide from the Harz Mountains in Germany, across Denmark to southern Sweden (Fig. 1) provides a seismic cross-section of the crust, upper mantle and the mantle transition zone from Phanerozoic Europe across the TESZ, to the Precambrian Baltic Shield. It has been the initiative of the TOR (Teleseismic Tomography TORnquist) project aimed at unravelling the structure of the Tornquist Zone.
At the southern corner of the TOR profile there are thick sedimentary rocks of the North German Basin which cover Caledonian basement and surround the Cadomian Lüneberg massif south of the Elbe Line (Berthelsen 1992). Further to the north the North German Basin borders an elevated basement, the Ringkøbing-Fyn High, along the Caledonian Deformation Front (EUGENO-S Working Group 1988). Radioactive dating of core samples from basement under the North Danish Basin, north of the Ringkøbing-Fyn High, shows Precambrian age of 880–900 Ma (Larsen 1971) whereas those from the south of it date back to Caledonian (Berthelsen 1992). Therefore, the Caledonian Front characterizes the boundary between the Phanerozoic basement rocks and the basement of the Precambrian Baltica. Based on these data and in the area considered it becomes clear that the actual suture marking the collision between the Avalonia and Baltica which occurred during the Silurian (Berthelsen 1992) must be located south of the Tornquist Zone. The present day Tornquist Zone is an intensely faulted zone which is characterized by its late Cretaceous-Early Tertiary inversion structures, a result of the collision of Africa with Europe during the Alpine-Carpathian Orogeny (Ziegler 1982).
Adopting the TOR multidisciplinary approach and bringing it into a broader perspective the SVEKALAPKO project (Hjelt 1996) was devised for unravelling the tectonic evolution of the Baltic shield. It culminated in the deployment of the SVEKALAPKO seismic network (Bock 2001), consisting of more than 120 stations and spreading over southern and central Finland (Fig. 1). It has provided an opportunity for broader and deeper investigation of the crust and upper mantle from Proterozoic Fennoscandia in the south to Archaean Baltica in the north across their suture zone, named here the Archaean-Proterozoic Suture Line (APSL) than what was earlier done by the controlled seismic source studies (e.g. BABEL Working Group 1990; Luosto 1997; Kozlovskaya & Yliniemi 1999).
Data
The data used in this study are from the following three sources:
TOR: A major temporary deployment of seismographic stations from northern Germany in the south, across Denmark to Sweden in the north, consisting of 108 short period and 33 broad-band stations which were operating from 1996 September to 1997 March, Fig. 1 (Gregersen 1999). Twenty four teleseismic earthquakes in the epicentral distance range of 30°–95° with threshold magnitude of 5.9 have been used in this study (Fig. 2).
SVEKALAPKO: A large deployment of seismographic stations in Europe which was operational from 1998 August to 1999 April (Bock 2001) (Fig. 1). Eighty five teleseismic earthquakes in the epicentral distance range of 30°–95° with threshold magnitude of 5.7 recorded by 77 short period stations and 46 broad-band stations have been used in this study (Fig. 2).
German Regional Seismic Network (GRSN) and GEOFON (Broad-Band network of the GFZ Potsdam): The broad-band networks of seismographic stations that have been in operation since 1991–1993. In order to complement the TOR data set we have used data from those which are located within or in the vicinity of TOR (Fig. 1). One hundred and twenty three teleseismic earthquakes in the epicentral distance range of 30°–95° with threshold magnitude of 6.0 have been used in this study (Fig. 2).
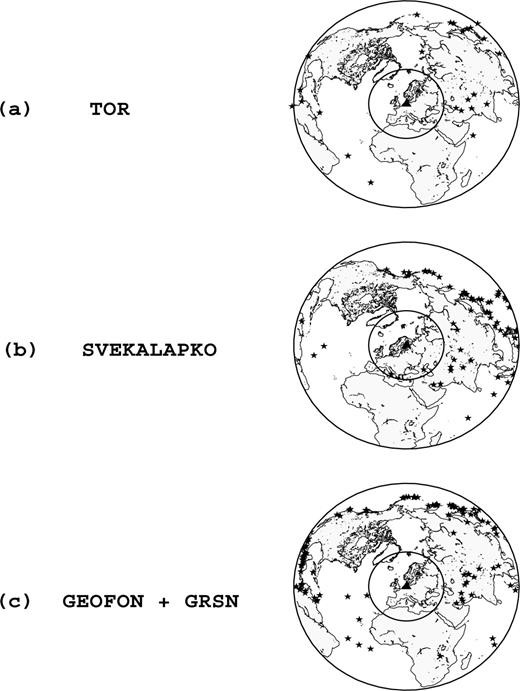
Maps showing the distribution of epicentres of teleseismic earthquakes used in this study. (a) 24 events recorded by TOR profile from 1996 August to 1997 May with magnitudes larger than 5.9. Only one event with M = 5.6 which proved to be of good quality was included in our data set. (b) 85 events with magnitude larger than 5.7 recorded from 1998 August to 1999 May recorded by the SVEKALAPKO network. (c) 123 earthquakes with magnitude larger than 6.0 and signal-to-noise ratio more than 2 recorded by GRSN during time period of 1992 March to 1999 May. The filled triangle in each figure shows the approximate centre of the corresponding network.
Methodology
The receiver function methodology has been used to investigate the lithospheric and upper-mantle discontinuities across the studied area. The technique was first introduced by Langston (1979, 1981) to examine crustal structure beneath three component recording stations while Vinnik (1977) had taken a similar approach to detect upper-mantle discontinuities by introducing delay and sum techniques. Since then the method has been developed steadily. Significant improvements of the resolution of the technique occurred by utilizing unique advantages of the digital broad-band data (e.g. Owens 1984) and as the technique was applied to data from arrays and networks of seismometers and hence producing receiver function images along profiles and 3-D migrated pictures of the crust and upper-mantle structures (e.g. Kosarev 1999).
In order to isolate and enhance the P-to-SV converted phases that originate from seismic discontinuities in the crust or upper-mantle the following measures are taken:
Rotation of the original three component Z, NS and EW recorded seismograms into the ray coordinate system of P, SV and SH components using theoretical or observed values of azimuth and incidence angle of the incoming P wave (e.g. Vinnik 1977; Kind 1995). Since the SV component contains only the desired P-to-S conversions and those multiples whose last leg are SV this method of rotation has a clear advantage over the alternative method of rotation into ZRT components and makes it possible to identify converted phases even from the shallow discontinuities.
Source equalization of the signals by deconvolving the P component (containing the effects of the source and near-source path) from the SV component (containing Ps conversions) using the spiking deconvolution technique. The result which is called the receiver function contains P-to-S conversions whereas source and path effects are practically removed.
Distance equalization by move-out correction. The process which is very similar to the familiar normal move-out correction in exploration seismology has been discussed in detail by Gurrola (1994). We take the same approach as Yuan (1997), in which the epicentral distance of 67° is chosen as the reference distance and, therefore receiver functions from larger distances are stretched while those from shorter distances are contracted. This correction is particularly essential for aligning and stacking of converted phases which originate from upper-mantle discontinuities and helps to distinguish P-to-SV conversions from their multiples.
The resulting receiver functions are then used in preparation of cross sections and mapping the delay times of converted phases across the studied regions. To transform delay times of Moho Ps conversions into crustal thickness we have used the Zhu & Kanamori (2000) method. By this technique which makes use of waveforms containing the direct Moho conversion and its multiples we have been able to determine crustal thickness and Vp/Vs values simultaneously (Fig. 3). The results are then presented in the form of maps of the crustal thickness and variations of Vp/Vs values.
Migration of non-moveout corrected receiver functions from time domain to their 3-D space positions where the conversions take place (Kosarev 1999). For this purpose the Ps amplitudes in each receiver function are back projected along the ray path calculated using a 1-D global velocity model (here IASP91, Kennett & Engdahl 1991). The 3-D migrated data are then stacked and projected along 2-D sections of interest for the enhancement of the conversions and easy comparison of migrated images with time domain sections.
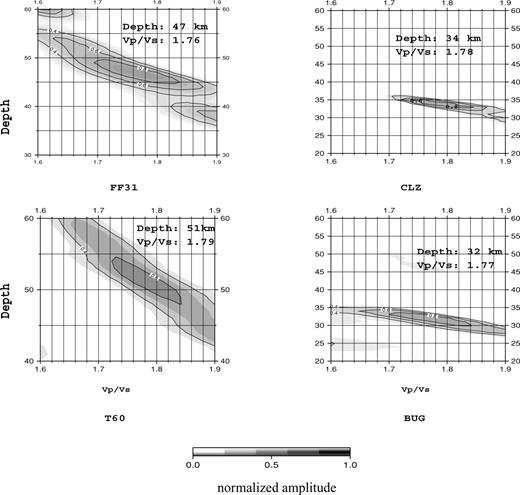
Examples of applying the Zhu & Kanamori (2000) method to receiver function data from two permanent stations of GRSN, i.e. BUG (51.45N, 7.26E) and CLZ (51.84 N, 10.38 E) and two temporary stations of TOR and SVEKALAPKO, i.e. T60S (58.76 N, 15.94 E) and FF31 (64.38 N, 28.67 E), respectively. The method makes use of receiver function waveforms and searches for the maximum stacked amplitudes of Moho Ps conversions and associated multiples as a function of the crustal thickness and Vp/Vs ratio assuming a constant value for average crustal Vp. The best values of the crustal thickness and Vp/Vs are indicated in each panel.
Resulting Observations and Discussions
Crust and crust–mantle boundary
Fig. 4 presents sections of the stacked receiver functions in time domain (Fig. 4a) and in space domain (Fig. 4b) from south to north along the TOR profile. The time domain (upper) section has been produced by stacking the move-out corrected receiver functions in windows of 50 km width which move in 10 km intervals from south to north to cover the entire extent of the profile. This method of moving average stacking provides a high degree of smoothing and clarifies large scale features at the expense of small details. It also amplifies coherent signals and weakens the white noise and crustal multiples substantially. The migrated (lower) section is the result of first back-projecting the same receiver functions used for producing Fig. 4(a) along the ray paths onto the spatial locations of the conversion points and then stacking the resultant 3-D migrated data along a south-north section. Clearly observed in both time and space domain sections is a significant thickening of the crust from south to north (30 km Moho depth at the southern end and over 55 km at the northern end of the profile). Between Elbe Line and Tornquist Zone the crust–mantle boundary adopts a complicated structure, which appears like a doubling of the Moho. While the deeper branch representing the Central European Moho (Avalonia) continues at the depth of about 40 km northwards past the Elbe Line, a second branch, representing the Scandinavian Moho (Baltica), appears at the depth of 30–35 km south of the CDF. This branching of the Moho can be interpreted as subducting Central European Moho under the Scandinavian Crust, a possible remnant of the collisional tectonics dating from the Paleozoic time (cf.BABEL Working Group 1993). The overlying Precambrian crust of the Baltic Shield, north of the CDF can explain why the age determinations of bore-hole samples of the basement north of the CDF (Larsen 1971) are in the range of 800–900 Ma which indicate their Precambrian Baltic Shield origin whereas samples from south of the CDF show Paleozoic ages (Berthelsen 1992). Fig. 4 fails though to furnish convincing evidence for south dipping intracrustal structures as BABEL Working Group (1993) and recently DEKORP-BASIN Research Group (1999) and Thybo (2000) associate with the CDF and Gossler (1999) referred to as ‘crocodile structure’ following the terminology coined by Meissner (1991).
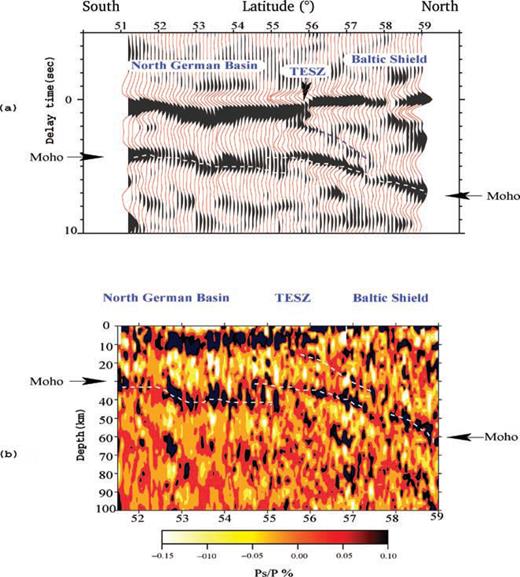
(a) A time domain south-north section of move out corrected receiver functions along the TOR profile, stacked in 50 km wide windows with moving intervals of 10 km and hence providing 80 per cent overlapping between adjacent windows. (b) A migrated and interpolated south-north section of receiver functions along the TOR profile. In both sections the dark positive amplitudes represent discontinuities with increasing S-wave velocity with depth. To eliminate low frequency noise, a high pass filter with he corner frequency of 0.2 Hz has been applied to the data. There is a pronounced thickening of the crust observed north of the TESZ which is accompanied by an increase of 50 mGal in Bouger gravity anomaly (EUGENO-S Working Group 1988) and appearance of intracrustal Ps conversions. Between about 54°N (roughly the Elbe Line) and 56°N (TESZ) the Moho structure appears to be complex which may indicate the subduction of the Central European crust beneath the Scandinavian crust.
North of the CDF there is a drastic decrease of the sediment thickness accompanied by a rise of the Moho (from about 35–40 km to 30 km) (Fig. 4) which is attributed to the inversion tectonics in Cretaceous-Tertiary (EUGENO-S Working Group 1988) and characterizes the northwest extension of the TESZ, known as the Tornquist Zone. The elevated Moho was observed by Kind (1997) as an offset in delay times of Moho conversions in a receiver function study carried out on data from a temporary deployment of stations (TOR pilot project) across the Tornquist Fan in Denmark and Sweden.
There is a pronounced thickening of the crust observed north of the TESZ towards the Baltic Shield which is well known from active seismic (e.g. EUGENO-S Working Group 1988) and receiver function (Gossler 1999) studies. Despite the increasing crustal thickness there is up to 50 mGal increase in Bouger gravity anomaly (EUGENO-S Working Group 1988). This discrepancy could be explained by the existence of dense materials in the lower and upper crust which are the sources of seismic contrast and P-to-S conversions observed both in time and space sections. The high velocity material of the lower crust has been explained by underplating (solidification of magma in lower crust during Permian-Carboniferous magmatism, Thybo 1994) or alternatively as remnants of subduction or underthrusting of Avalonia underneath the Baltica proposed by BABEL Working Group (1993). The latter hypothesis finds support by our observation as indications of subducting Central European Moho beneath the Scandinavian crust are seen in Fig. 4 and as discussed above.
Fig. 5 shows sections of receiver functions from south to north across the SVEKALAPKO network. The same techniques as used for producing images in Fig. 4 have been used here. The crust–mantle boundary is clearly seen in time and space domains (Figs 5a and b, respectively). Between 61.5°N and 62°N the Moho plunges from about 40 km to beyond 60 km depth (Fig. 5b). Further to the north, at about 65.5°N it rises smoothly to a depth of 40–45 km. The sudden deepening of the Moho occurs about 100 km south of the surface trace of the suture zone (Fig. 1) between the Proterozoic and Archaean parts of the Baltic Shield. The offset of the Moho is accompanied by north dipping structures observed in sections which we attribute to the subduction and collision of the Proterozoic and Archaean orogenies. Such interpretation is in agreement with the results of ‘Babel 4’ seismic reflection experiment (BABEL Working Group 1990) which was carried out in a nearby region across the Gulf of Bothnia. In this experiment the Archaean-Proterozoic suture was already identified as zone of underthrusting of continental crust in a collision zone.
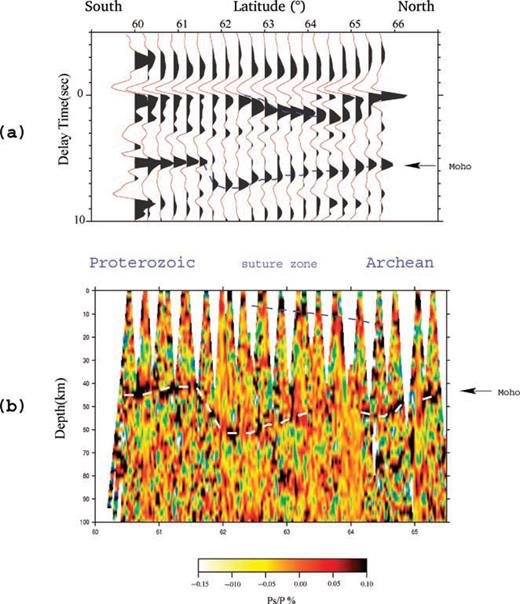
South-north oriented sections of the receiver functions in (a) time and (b) space domains, in a 2° wide strip centered around 27°E across the SVEKALAPKO network. Receiver functions were high passed with the corner frequency of 0.2 Hz to eliminate the low frequency noise. Receiver functions in time domain (a) have been stacked from south to north in 50 km wide windows with moving intervals of 10 km. In both sections a sudden deepening of the Moho by more than 20 km just south of the line of suture between Proterozoic and Archaean orogenies is observed. The offset of the Moho is accompanied by lack of negative Bouger anomalies (Elo 1999) and north dipping intracrustal structures.
The observation of phenomenal Moho topography along the presented sections of TOR and SVEKALPKO (Figs 4 and 5) demanded mapping of the crustal thickness across the two networks. The results of application of the Zhu & Kanamori (2000) method to the receiver function data of the TOR and SVEKALAPKO networks are presented in a map of the crustal thickness as shown in Fig. 6. Our calculated depth to the Moho is colour coded whereas the white colour contours represent the Moho depths compiled from controlled seismic source investigations (EUGENO-S Working Group 1988; Luosto 1997; Korsman 1999). At the southern end of the TOR profile the Moho depth is about 30 km and reaches near 40 km beneath the North German Basin. Below the Danish Basin the Moho is again shallowing to about 30 km. It has to be mentioned that the continuation of the central European Moho at about 40 km depth (lower branch in Fig. 4b) from north of the Elbe Line to the TESZ (Fig. 3) is not seen in the map view of Fig. 6. North of 56°N into the Baltic shield the crustal thickness increases rapidly. Underneath the SVEKALAPKO network, the Moho takes a complex topography with the deepest point south of the Proterozoic–Archaean suture line. The abrupt variations of the crustal thickness is in contrast to the quite flat surface topography and lack of negative Bouger anomaly (Elo 1999). One explanation for this apparent contradiction is the assumption of high density middle or lower crust which might be the result of magmatic intrusions and underplating that are associated with the collision of plates and the process of crustal thickening (Korsman 1999).
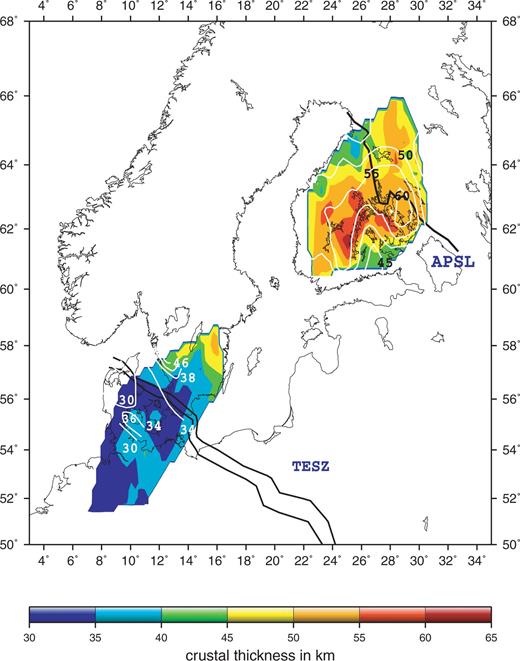
A colour coded map of the crustal thickness across the TOR and SVEKALAPKO networks as calculated by applying the Zhu & Kanamori (2000) method to the receiver function data. Superimposed in white colour contours are the Moho depths from controlled seismic source studies (EUGENO-S Working Group 1988; Luosto 1997; Korsman 1999). There is a great deal of agreement between the results of the two data sets. A discrepancy shows up in central Finland where the deepest Moho offset according to the receiver function results is located southwest of the suture line of the Proterozoic and Archaean provinces (APSL), which is in disagreement with results from controlled source studies.
Fig. 7 shows the distribution of the Vp/Vs values across TOR and SVEKALAPKO networks as obtained by application of Zhu & Kanamori (2000) method to receiver function data from recording stations. Although the values, due to insufficient quantity of data needed for a thorough investigation of this kind, demand cautious treatment, a noticeable increase of Vp/Vs values across TESZ can be identified. This is in agreement with the recent findings of Wilde-Piorko (2002). Across the SVEKALAPKO network the values do not show significant variations and are well within the range expected from stable cratons.
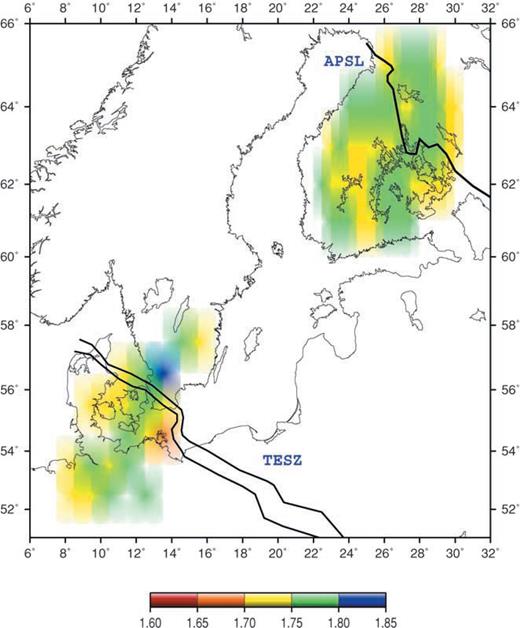
Distribution of Vp/Vs values across the TOR and SVEKALAPKO networks as determined by applying the Zhu & Kanamori (2000) method to the receiver function data. An increase towards higher values of Vp/Vs values is observed north of the TESZ whereas across the SVEKALAPKO network the values do not show abrupt variations and are within the range expected at stable cratons.
Upper mantle
Receiver function methodology is a powerful tool for probing the upper mantle in search for major upper-mantle discontinuities and unravelling the characteristics of transition zone between the 410 km and 660 km discontinuities. Both discontinuities are globally observed and are believed to be associated with phase transitions rather than bulk changes in composition. The abrupt change in seismic impedance responsible for producing Ps conversions is therefore due to transition to denser lattice structures with increasing pressure and temperature (Press & Siever 1978). Although the depth of the discontinuities is assumed to be constant on a global scale, topographical changes due to thermal variations have been reported (e.g. Lay 1992; Shearer 1993; Gu & Dziewonski 2002; Gossler & Kind 1996; Li 2003).
By stacking distance equalized receiver functions in terms of the latitude of their P-to-S conversion points at the depth of 520 km, we could detect and identify the 410 and 660 km discontinuities beneath the TOR and SVEKALAPKO networks. Fig. 8 shows south-north oriented cross-sections of stacked receiver functions along the TOR (lower section) and SVEKALAPKO (upper section) networks. Both discontinuities are visible in the data of both networks. The location of the 410 discontinuity is over the entire TOR profile (52–59°N) in rather good agreement with the IASP91 (Kennett & Engdahl 1991) model. This agreement continues to the southern end of the SVEKALAPKO profile (up to about 61°N). North of that latitude the 410 conversion arrives up to 2 s earlier than predicted by IASP91. The 660 discontinuity appears at the southern end of TOR up to 3 s earlier than IASP91. This signal is however relatively weak and could have been produced by multiples or other upper mantle phases. It seems unlikely that only the 660 and not both the 410 and 660 are affected in a relatively hot upper-mantle transition zone. At the northern end of the TOR the 660 appears at normal times. At SVEKALAPKO the 660 appears earlier, especially at the northern end, in agreement with the earlier 410. The summation traces of all TOR and SVEKALAPKO data (top of Fig. 8) show clearly that the differential times of the 410 and 660 are in good agreement with IASP91. Both discontinuities are however 1–2 s earlier, especially at the northern end of SVEKALAPKO. This is very likely to be due to an approximately 5 per cent faster upper-mantle at the Archaean Baltic shield. Higher shear velocities in the upper-mantle of the Baltic shield are in agreement with the latest teleseismic body wave (Sandoval 2001) and surface wave (Funke & Friedrich 2001) tomography studies and consistent with what is expected from stable shields (e.g. SNA model by Grand & Helmberger 1984).
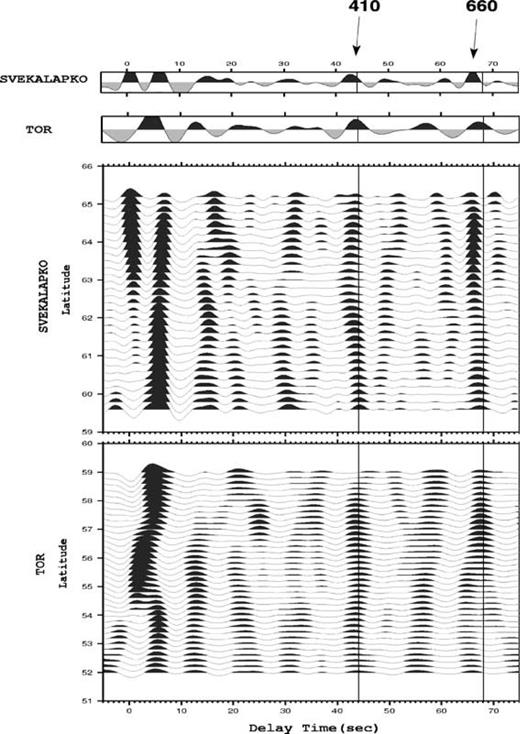
South-north sections of the receiver functions along the TOR (lower part) and SVEKALAPKO (upper part) networks, stacked by latitudes of Ps conversion points at the depth of 520 km in windows of 100 km wide with moving intervals of 30 km. Traces have been low pass filtered (corner frequency of 0.2 Hz). This and the fact that traces are stacked according to their conversion points at the depth of 520 km makes these sections unsuitable for tracing the Moho with high resolution while it proves to be an efficient tool for enhancing the converted phases from the 410 km and 660 km discontinuities. Vertical lines indicate the expected IASP91 arrival times of Ps conversions (normalized to 67° epicentral distance) from 410 km (at 44.1 s) and 660 km depths (at 68.1 s). The approximately 2 s earlier arrival time of the 410 and 660 km conversions associated with the Archaean-Proterozoic suture at about 62°N latitude indicate about 5 per cent faster average mantle velocities above 410 km depth.
Conclusions
The results of the present study show once again the effectiveness of the receiver function analysis methods in probing into the crust and upper mantle. Taking advantage of network data in this context has proved to be particularly useful in revealing large scale tectonic structures as well as resolving intracrustal and upper-mantle features. We were able to produce detailed imagery of the crust and crust–mantle boundary and map the crustal thickness under TOR and SVEKALAPKO networks using enhanced teleseismic P-to-S conversions which is proved to be highly sensitive to the Moho topography changes. It was shown that the crustal thinning south of the TESZ is followed by Moho depth increases across the TESZ from 30–35 km in north German basin to more than 50 km under Scandinavia. The abrupt change in the Moho depth is accompanied by an increase in values of Vp/Vs and positive Bouger anomaly northwards across the TESZ as well as appearance of additional conversion zones and north dipping intracrustal features which run deep into the lower crust. Under SVEKALAPKO we observed sharp thickening of the crust south of the suture line between Proterozoic and Archaean orogenies accompanied by north dipping structures which we relate to the ancient collision of the two provinces. The receiver function data have therefore confirmed earlier interpretations of the Trans-European Suture Zone and the Proterozoic–Archaean suture as two significant zones of subduction and continental collisions. Both sutures are clearly marked by Moho offset and intracrustal dipping structures. It seems especially interesting to note that both collisions zones can be so clearly identified despite their large geological ages of about 0.9 and 1.9 Ga, respectively. Across the SVEKALAPKO network conversions from 410 km and 660 km discontinuities arrive markedly earlier than predicted by IASP91 velocity model, which is evidence for cooler and faster materials above the 410 km discontinuity.
Acknowledgments
We dedicate this paper to our deceased friend and colleague Dr Günter Bock who lost his life in a tragic plane crash in November 2002.
Our special thanks are due to German Academic Exchange Service (DAAD) for financial support provided for the first author during this research. We are also grateful to GeoForschungsZentrum Potsdam (GFZ) for the general support. We appreciate the support of the Deutsche Forschungsgemeinschaft for the the TOR project. The SVEKALAPKO field project has been sponsored by the Academy of Finland, by national science funding agencies in France, Sweden, and Switzerland, by the Institute of Geophysics of the Polish Academy of Sciences, by the University of Utrecht and by an EU INTAS grant. Thanks are also due to the European Science Foundation ESF for supporting several workshops of the SVEKALAPKO groups in St. Petersburg, Russia, and Lammi, Finland. We also appreciate the GFZ instruments pool for providing seismic instruments.
References
Appendix
Appendix A
The TOR Working Group consists of:
U. Achauer, J. Ansorge, R. Arlitt, A. Berthelsen, M. Budweg, H. Busche, N. Cotte, E.R. Engdahl, M. Grad, S. Gregersen, A. Guterch, S. Hock, R. Kind, E. Kissling, M. Korn, K. Mosegaard, H. Paulssen, H. Pedersen, L.B. Pedersen, T. Pedersen, J. Plomerova, W. Rabbel, R.G. Roberts, H. Shomali, H. Thybo, P. Voss, F. Waldhauser M. Wilde-Piorko, I. Woelbern, P. Ziegler, M. Zuchniak.
The SVEKALAPKO Working Group consists of:
U. Achauer, A. Alinaghi, J. Ansorge, G. Bock, M. Bruneton, W. Friederich, M. Grad, A. Guterch, S.E. Hjelt, T. Hyv, J.-P. Ikonen, E. Kissling, K. Komminaho, A. Korja, P. Heikkinen, E. Kozlovskaya, M.V. Nevsky, N. Pavlenkova, H. Pedersen, J. Plomerova, T. Raita, O. Riznichenko, R.G. Roberts, S. Sandoval, I.A. Sanina, N. Sharov, J. Tiikkainen S.G. Volosov, E. Wielandt, K. Wylegalla, J. Yliniemi, Y. Yurov.
Author notes
Deceased (2002 November 6).
Also at: Freie Universität, Berlin, Germany.
The members of the TOR and SVEKALAPKPO working groups are listed in Appendix A.
