


Summary
The multifractal characteristics of seismic waveforms that have propagated through fractured media were studied using numerical experiments. The study suggests that multifractal waveform parameters (i.e. information dimension, correlation dimension, curvature and range indices) bear correlations with the hydraulic properties of the fractured media. The characteristic waveform parameters were estimated from a multifractal analysis of 1-D synthetic seismograms generated using a variation of the reflectivity method. Waveforms from fractured zones were obtained by a superposition of reflections from horizontal fractures with a varying distribution of fracture length, aperture and spacing. The constructive and destructive interferences of the composite reflections from the fractures in the fractured layer result in waveforms that possess multifractal attributes. The characteristic parameters extracted from the waveforms are shown here to correlate with the hydraulic properties of the fractured rockmass, which include the fracture permeability, the discontinuity index and the fracture density parameter.
Introduction
Most surface and subsurface crustal rocks exhibit some degree of natural fracturing that varies in intensity and scale. Fractures are important in engineering, geotechnical and hydrogeological practice as they play an important role in the storage and migration of geological fluids, water, oil and gas through the Earth’s crust. The permeability and distribution of pore fluids in crystalline rocks are determined primarily by the density and distribution of fractures (Brace 1980). Special methods for increasing the extent of underground reservoirs with fracture systems have been developed to allow for effective transport of petroleum and gas. In the mining, geothermal and petroleum industry, the geometry of fractures is quite important as the vast majority of targeted natural resources are found in fractured rocks (Chernyshev & Dearman 1991). Fractures are also thought to play an important role in predicting earthquakes (Crampin 1984).
Research relating quantifiable seismic information to hydraulic properties of fractured rockmass is limited. Recently, several investigators have attempted to characterize and predict the hydraulic properties of fractured rockmass from geological information and geophysical measurements such as seismic velocity (Myer 1991; Pyrak-Nolte 1995; Boadu 1997a,b). Evidence of direct relationships between hydraulic and seismic waveform properties is presently lacking. However, Boadu (1997a) has recently obtained promising relationships between permeability and seismic attributes (i.e. instantaneous frequency, amplitude and bandwidth).
Seismic waves propagating through a single fracture or a set of fractures are scattered and diffracted at the fracture boundaries and these scattered waves may interfere constructively or destructively. The non-linear constructive and destructive interferences or interactions of scattered and diffracted wavefields result in irregular waveforms for which the amplitude distributions exhibit a chaotic behaviour and hence a fractal phenomenon (Feder 1988; Zosimov & Lyamshev 1995). Such amplitude distributions can be uniquely characterized using a particular parameter, the fractal dimension. If we can conceive that the very geometric properties of the fractures that affect the irregular characteristics of the seismic waveforms do indeed affect the hydraulic properties, then we should expect some relationships among parameters that quantify the waveforms and the hydraulic properties.
In this study, I investigate the possibility of estimating the hydraulic properties of fractured rockmass using information obtained from the fractal properties of seismic waveforms. The investigation is based on the analysis of reflected waveforms from fractured zones in geological media using multifractal measures. Seismic waveforms have been utilized in delineating saturated porous zones (Boadu 2000) and in studying wedge models (Robertson & Nagomi 1984). However, to the best of the knowledge of the author, the rich information inherent in these attributes has not been exploited in fracture characterization. Using the modified displacement discontinuity (MDD) model developed in Boadu & Long (1996) and Boadu (1997a,b), I designed numerical experiments to further explore the relationships between characteristic fractal properties of seismic waveforms after propagation through a fractured zone and representative parameters quantifying the hydraulic or transport properties of the zone.
The Modified Displacement Discontinuity and Seismic Wave Propagation in Fractured Media
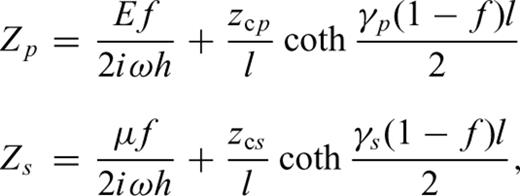
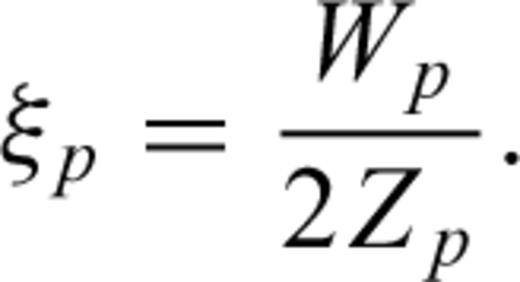
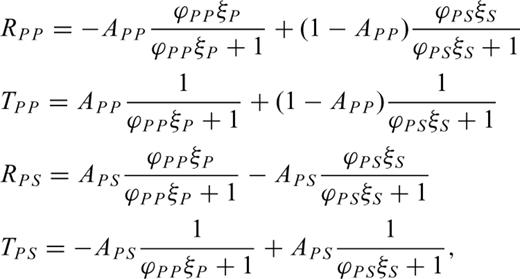
The fracture impedance is obtained by exploiting the well-established analogies between mechanical and electrical quantities (e.g. Anderson 1985). Relations between equations for acoustic wave motion and electric transmission lines allow us to treat the fracture as a transmission line for the passage of seismic waves. When there is no rigid contact between the surfaces (non-welded contact), the transmission of the seismic wave at the fracture takes place in the form of a blow with some inertia, which results in the delay of the transmission of the waves. The corresponding equations of motion have been developed and solved for the transmission and reflection coefficients for an incident P or S wave (Boadu & Long 1996) and will only be summarized here.

The method described in Boadu (1997a,b) is used to obtain synthetic seismograms for a series of geological layers where one of the layers is fractured (fractured zone). The fractures in this zone are assumed to be horizontal and planar or subplanar fractures (see Fig. 1) and can exhibit varying distributions of length, spacing and aperture. For a propagating wave, we postulate two types of reflections: (1) reflections from the interface of two unfractured geological layers and (2) reflections from the fractures themselves. A recursive scheme is used to compute global reflection and transmission coefficients for these two types of interfaces and synthetic seismograms are then computed using the reflectivity method.
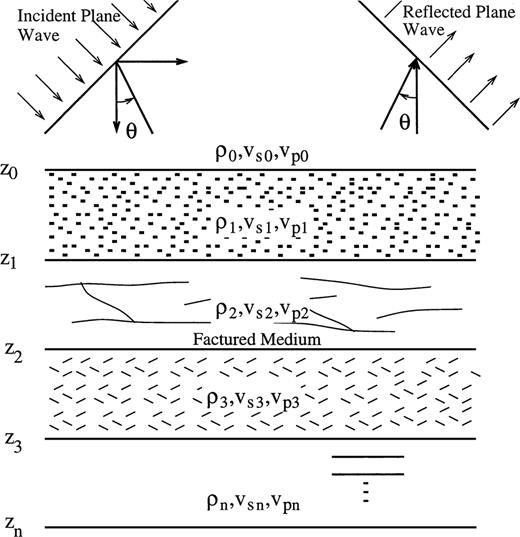
A simple model describing a series of geological layers where one of the layers is fractured (fractured zone).
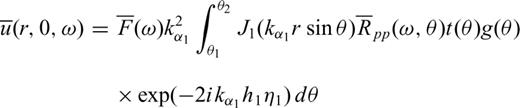


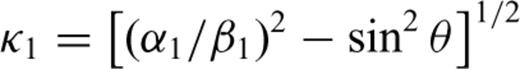

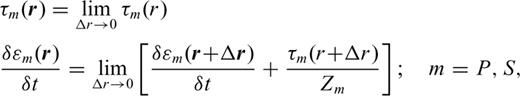
 is the angular frequency; hi is the thickness of layer i, Γpp and Γps are the P–P and P–S reflection coefficients of the free surface, and Rpp is the complex global reflectivity function for the stack of layers.
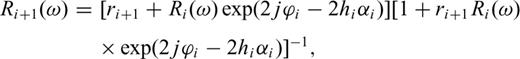
Numerical results
I provide illustrative examples of numerical experiments which involve a stack of geological layers over a half-space, one of the layers being embedded with horizontal fractures. Such a geological setting is typical of environments for exploration of oil and geothermal energy (van Golf-Racht 1982; Chernyshev & Dearman 1991). The seismic parameters characterizing the individual layers are shown in Table 1.
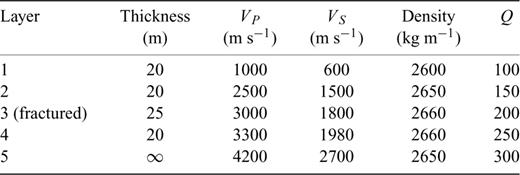
Layer parameters for the model used in the experiment. An illustration of the parameters of the intact rock of each layers used in the computation of the synthetic seismograms. The permeability of the intact rock units in the fractured layer (layer 3) is assumed to be 10−12 m s−1.
Ten discrete planar fractures are embedded in the fractured layer or zone. A seismic source (Ricker wavelet) located at the surface with a peak frequency of 400 Hz and a maximum frequency of 1200 Hz is used in the reflection experiment. Fig. 2 is a generated synthetic seismogram for a vertically incident wave using the procedure described earlier in the text. Normally incident waves are analysed here to illustrate the effect of the fractures on the seismic waveform although the computational methodology is generalized for all incidence angles. As expected based on the model in Table 1, we observe a clean reflected signal at a time of 0.04 s followed by a dispersed waveform. This waveform represents constructive and destructive interference of wave reflections from the fractured zone (windowed and shown in the inset). The dispersive characteristics of the windowed wave train contain useful information concerning the fractured zone and this information will be extracted using a multifractal analysis.
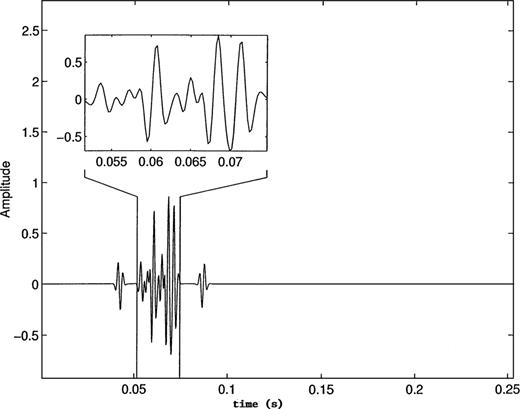
Synthetic seismogram (vertical incidence) for a stack of geological layers with one of the layers containing fractures. The time zone known to contain composite reflections from fractures is shown and is windowed for multifractal analysis.
Fractal Analysis of Waveforms from Fractured Media
Fractals are mathematical constructs that can have a high degree of geometrical complexity and repeat at different scales (Feder 1988). A very important characteristic of fractals useful for their description and classification is their fractal dimension, D, which measures the degree of their irregularity over multiple scales. As the waves propagate through the fractured medium, the distribution of the scattered wave energy associated with the fractures becomes irregular and non-uniform and can be subjected to fractal analysis. Given the complex nature of the seismic waveforms from the fractured media, it is insufficient to characterize the dynamic behaviour of waveforms by a single value of their fractal dimension. Multifractal analysis is the recourse, as it will allow us to characterize the distributional properties of the amplitudes of the waveforms in greater detail.
In this study, the sample values of the waveforms, herein termed amplitudes, are considered as variables and their distributions in time are subjected to multifractal analysis to determine the multifractal attributes. The multifractal attributes provide detailed information concerning the concentration of waveform amplitudes in a given time window and the statistical properties of such measures are characterized by a continuous spectrum of fractal dimensions.

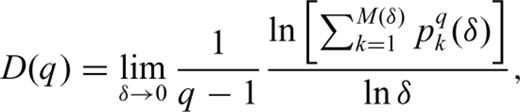
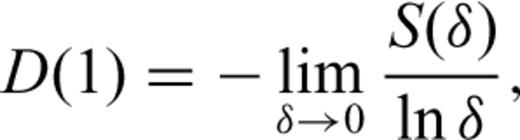
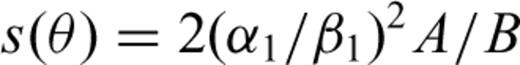
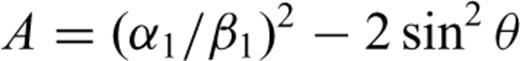
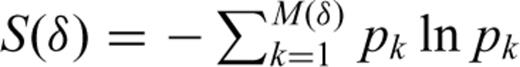 . S(δ) is a familiar expression from information theory that describes the amount of information associated with the distribution of pk values and thus D(1) is known as the information dimension (Grassberger & Procaccia 1983). The information dimension D(1) quantifies the gain in information as δ→ 0.
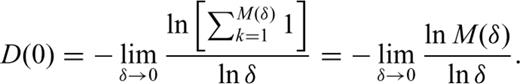
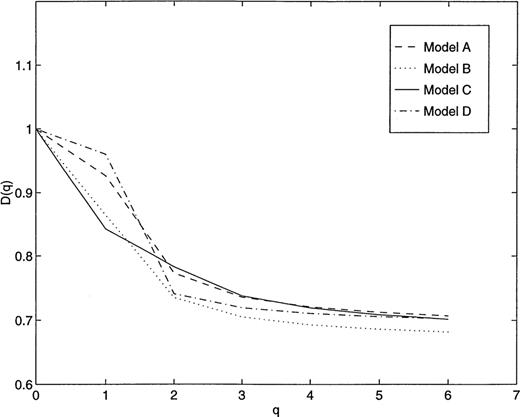
Fig. 3 illustrates the behaviour of D(q) versus q. The values of D(q) are computed from generated waveforms from the fractured zone. An example of such a waveform is shown as an inset in Fig. 2. The fractures in the fractured zone possess exponential distributions of fracture parameters (length, spacing and aperture) with different mean values as shown in Table 2. It is seen that different combinations of fracture parameters, that is, length, spacing and aperture, give a different behaviour of D(q). When the relationship D(0) ≥D(1) ≥D(2) ≥⋯≥D(∞) holds, the distribution of amplitudes is heterogeneous and bears multifractal characteristics. The equality D(0) =D(1) =D(2) =⋯=D(∞) holds for homogeneous distributions that exhibit monofractal behaviour. An interesting and important dimension is D(∞), which sets a lower limit on the fractal dimension. It gives information concerning the extent to which the sample values are clustered in the waveform. The value of D(q) for some theoretically defined fractal systems, for example the Cantor set, has been established analytically (Feder 1988). However, in practice one can compute several values of D(q) and establish D(∞) as the asymptotic value of D(q).
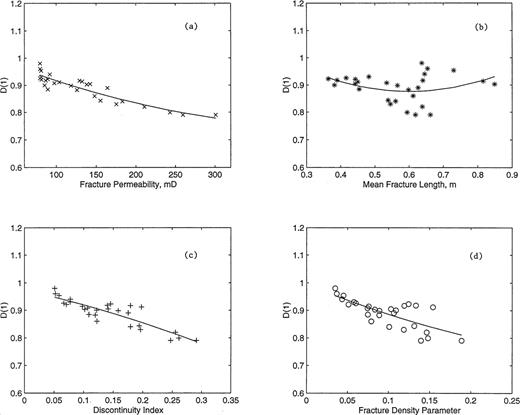
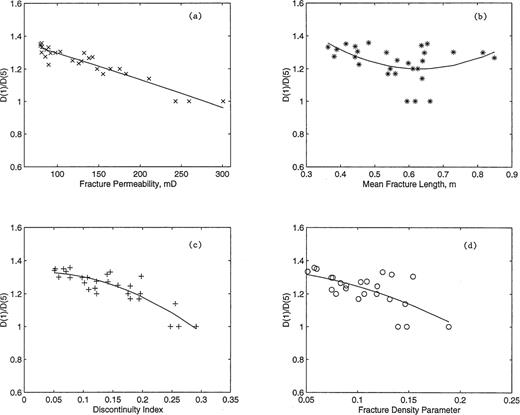
Cross-plots and corresponding least-squares fits of information dimension D(1) versus (a) fracture permeability, (b) mean fracture length, (c) discontinuity index and (d) fracture density parameter. Parameters are extracted from windowed waveforms such as in Fig. 2 for various simulations.
A schematic illustration of the spectrum of D(q) versus q for different fracture parameters (models) listed in Table 2. For example, Model C in Table 2 is a fractured medium consisting of planar fractures with exponential distributions of fracture length, aperture and spacing with mean values of 0.68 m, 50 μm and 0.36 m, respectively.
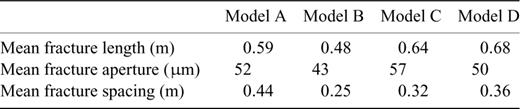
Mean values of the distribution of fracture parameters used for experimental illustration of the behaviour of D(q) versus q.
Representations of Generalized Dimensions
Fracture Parameters and Hydraulic Properties of Fractured Rockmass
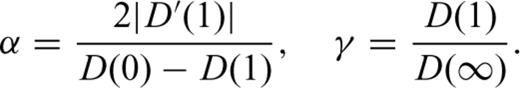
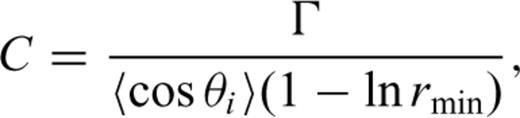
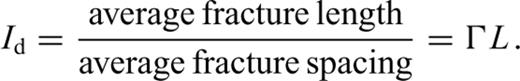
The hydraulic properties of a fractured rockmass can be described by its permeability and quantifiable fracture parameters, such as the fracture density parameter, C and the discontinuity index, Id. Another useful parameter is the linear fracture density, Γ (the number of fractures per unit length), usually measured normal to the average strike of the fractures along a scanline under field conditions.
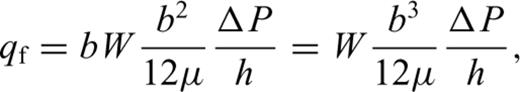
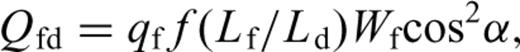
 (Boadu 1997a), where Ld is related to the thickness of the block or section, h, by Ld=h/cos α. The sum of contributions to the discharge from R fractures divided by the section area gives the effective fracture permeability, Ka (Chernyshev & Dearman 1991),
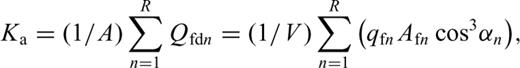
The hydro-properties of the fractured rock described above, Id, C and Ka, can be used to characterize its hydraulic conditions. These representative properties will be related to the representations of the generalized dimensions quantifying the seismic waveforms.
Seismic Fractal Attributes and Fracture Hydro-Properties: Numerical Experiments
An important objective of this paper is to investigate, through numerical experiments, the possibility of the existence of relations between seismic waveform parameters and hydro-properties of a fractured rockmass. An exponential distribution of fracture lengths with mean values ranging between 0.2 and 1.0 m were used in the numerical experiments. The minimum and maximum fracture lengths for all simulations were 0.05 and 2 m, respectively. The distribution of the fracture spacings follows the Weibull distribution as described by Boadu & Long (1994a) with the mean varying between 0.1 and 2 m. Fracture apertures are of exponential distribution with a chosen average value of 4 μm. This value is reasonably representative of aperture values found in some sedimentary and igneous rocks (Chernyshev & Dearman 1991; van Golf-Racht 1982).
Figs 4(a)–(d) show cross-plots and least-squares (LS) polynomial fits of information dimension D(1) versus fracture permeability, mean fracture length, discontinuity index and fracture density parameter, respectively. The information dimension is obtained from the multifractal analysis of the wave train from the fractured layer (see Figs 1 and 2) for each numerical experiment where the distribution of the fracture parameters is known. We see a correlation between the information dimension and the fracture permeability, that is, D(1) is sensitive to fracture permeability and decreases with an increase in fracture permeability. The coefficient of determination for the LS fit, R2, is 0.89, indicating a reasonable relationship between D(1) and permeability. Both the discontinuity index and the fracture density parameter correlate reasonably with D(1), with R2 being 0.78 and 0.63, respectively. The mean fracture length as a fracture parameter, bears a very weak correlation with D(1).
Cross-plots and corresponding LS fits of correlation dimension, D(2), with fracture permeability, mean fracture length, discontinuity index and fracture density parameter are shown in Figs 5(a)–(d), respectively. The correlation dimension increases with an increase in fracture permeability, discontinuity index and fracture density parameter with respective R2 values of 0.86, 0.77 and 0.60. Fractures with relatively greater length, greater apertures and closer spacing will produce distinct signal values that would probably interfere constructively and be correlated. The nature of these fractures is such that they would also produce a higher permeability and discontinuity index. Hence the correlation dimension will increase with an increase in fracture permeability and discontinuity index.
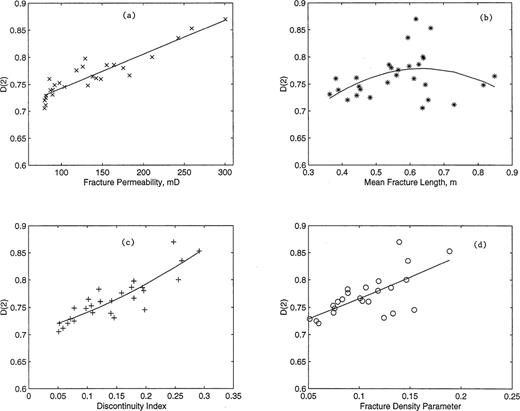
Cross-plots and corresponding least-squares fits of correlation dimension D(2) versus (a) fracture permeability, (b) mean fracture length, (c) discontinuity index and (d) fracture density parameter.
Figs 6(a)–(d) show cross-plots and corresponding LS fits of the curvature index with fracture permeability, mean fracture length, discontinuity index and fracture density parameter, respectively. There are discernible relationships between the curvature index and the fracture permeability, discontinuity index and fracture density parameter with respective R2 values of 0.85, 0.79 and 0.55. However, there is a weak correlation of the index with the mean fracture length with a low R2 value of 0.17.
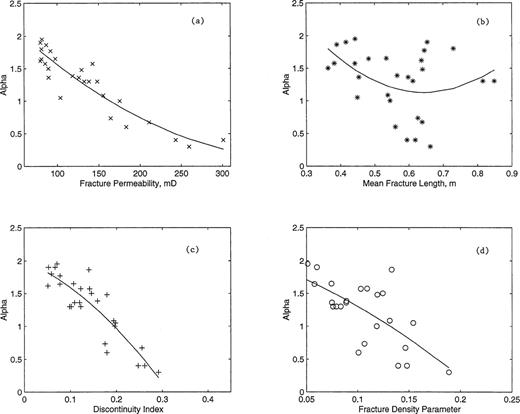
Cross-plots and corresponding least-squares fits of curvature index (α) versus (a) fracture permeability, (b) mean fracture length, (c) discontinuity index and (d) fracture density parameter.
The range index (γ), and its relationship with fracture permeability, mean fracture length, discontinuity index and fracture density parameter are shown in Figs 7(a)–(d), respectively. Again, the fracture permeability, discontinuity index and fracture density parameter show reasonable correlations with γ, with R2 values of 0.9, 0.81 and 0.58, respectively. As the permeability and discontinuity index increase, the γ index values decrease. The mean fracture length, however, shows quite a weak correlation with γ(R2= 0.2). Regularity in amplitude distribution (γ→ 1) implies persistence in fracture aperture, spacing and length distributions and hence an increase in the transmissive potential of the fractured rockmass.
Cross-plots and corresponding least-squares fits of range index (γ) versus (a) fracture permeability, (b) mean fracture length, (c) discontinuity index and (d) fracture density parameter.
Summary and Conclusions
The identification, location and characterization of fractured media is important in engineering, geotechnical, hydrogeological and geoscience applications. In this paper, multifractal analyses of seismic waveforms obtained by numerical reflection experiments in fractured media have been performed to extract quantifiable representative waveform parameters. Based on numerical experiments and analyses, reasonable correlations between the extracted waveform parameters and the hydro-properties characterizing the fractured media have been established.
The results presented here are interesting and important and provide a wealth of information that warrant further investigation involving either a laboratory or field study. The seismic waveform parameters can be reasonably estimated from real seismic data obtained from fractured terrain with a good signal-to-noise ratio. More research work in this direction may lead to innovative and useful ways of assessing the hydraulic properties of fractured rockmass remotely from seismic information. For example, based on these results, one may infer that with estimates of the correlation dimension and the α parameter of waveforms from two fracture zones, the zone with relatively greater value of correlation dimension and smaller value of curvature index, may possess greater storage and transmission potential.
The sensitivity of the fracture permeability and the discontinuity index to these waveform parameters may be due to the fact that, for a given frequency range of the propagating waveform, the amplitude distribution in waveforms is more sensitive to fracture spacing and aperture, which also control the permeability and discontinuity index than the length. The mean fracture length may not be representative as it is possible that a few long fractures may dominantly influence the fracture permeability, an observation that has been established by Cheng-Haw & Farmer (1993). Although the models used in the numerical experiments are quite simple, the insight gained is valuable for possible use as quantifiable criteria for assessing the hydraulic properties of a fractured rockmass.
Acknowledgments
This research work was supported by the National Science Foundation (NSF) under grant no CMS 02-17318 and by Texaco Inc. The author would like to thank the two reviewers for their useful comments and suggestions.
References
