


Summary
U-channel samples from ODP site 1092 in the sub-Antarctic South Atlantic Ocean provide an interpretable magnetic stratigraphy from 1.95 to ∼3.6 Ma and from ∼5.9 to 13.5 Ma. Although the interpretation is unclear within the Gilbert Chron (C3), the record represents one of the more complete Upper Miocene polarity stratigraphies from the South Atlantic. Eight polarity subchrons that are not included in the standard polarity timescale are identified. Polarity subchron C4r.2r contains a normal-polarity interval that has also been identified in sediments from ODP leg 138. Three short subchrons are recorded within C4n.2n, C5r.3r and C5AAr. The record of C5n.2n contains four short reverse-polarity subchrons of durations estimated to be 3–6 kyr.
1 Introduction
Ocean Drilling Programme (ODP) site 1092 (46°24.7′S, 7°4.8′E) was drilled during leg 177 to the sub-Antarctic South Atlantic Ocean, and is located on the northern slope of the Meteor Rise (Fig. 1). The site is located approximately 3°north of the present-day position of the Polar Front. Mean sediment accumulation rates, estimated from magnetostratigraphic results, vary from ∼0.5 to 5 cm kyr−1. The sediments recovered consist of pale brown—green to white nannofossil ooze, with mixtures of diatom and foraminiferal ooze and mud (defined as siliciclastic clay and silt-size material) (Shipboard Scientific Party 1999). One lithostratigraphic unit was designated at the site, which is divided into two subunits on the basis of colour and mud content. Subunit 1A, 0–53.89 m composite depth (mcd), comprises alternations of foraminiferal, diatom and nannofossil ooze plus some mud. Ice rafted debris (IRD) is scattered throughout the sequence. The darker mud-rich sediments are thought to represent glacial intervals, while the white to greenish sediments reflect interglacial intervals. Subunit 1B (53.89–185 mcd) consists of nannofossil ooze, with a minor terrigenous component. The calcium carbonate content fluctuates in the 17–95 per cent range in the upper part of the section and generally increases to >80 per cent below 60 mcd (Shipboard Scientific Party 1999).
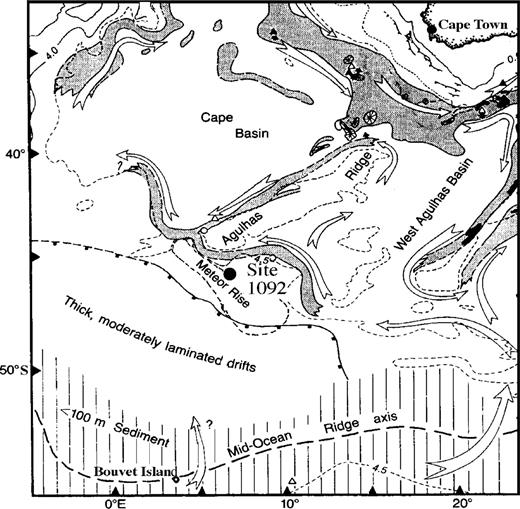
Location map for ODP site 1092 showing the position of the site on the northern Meteor Rise (after Tucholke & Embley 1984; Shipboard Scientific Party 1988; 1999). Shaded area indicates the core of the circum-basin erosional zone and arrows indicate the flow of Antarctic Bottom Water (AABW) inferred from bottom-water temperature measurements. Hatched area is a zone of thin sediment along the mid-oceanic ridge.
Here we present the magnetic stratigraphy, obtained from u-channel samples, for ODP site 1092 in the 1.9–13.5 Ma interval. This includes subchron C5n.2n in which four short-duration reverse-polarity subchrons have been identified. The age model for the site was determined by correlating the polarity zones to the geomagnetic polarity timescale (GPTS) of Cande & Kent (1992a, 1995), hereafter referred to as CK92/95.
2 Methods
The shipboard polarity stratigraphy for site 1092 was determined based on pass-through palaeomagnetic measurements of archive halves of core sections after alternating field (AF) demagnetization at peak fields of 25 mT (Shipboard Scientific Party 1999). The composite stratigraphic section at site 1092 was derived using shipboard measurements of magnetic susceptibility, gamma-ray attenuation porosity (GRAPE) and colour reflectance to splice together the records from holes 1092A–1092D. This process (see Hagelberg 1992) produced a complete spliced record of the sedimentary sequence to ∼185 mcd (Shipboard Scientific Party 1999).
Shipboard data were augmented post-cruise by measurements of discrete (7 cm3) samples and u-channel samples. U-channel samples have a 2 × 2cm2 cross-section and are generally 1.5 m in length (Tauxe 1983). The u-channels were sampled post-cruise from the archive halves of the composite stratigraphic section.
The natural remanent magnetization (NRM) of u-channels was measured during stepwise AF demagnetization using a 2G Enterprises pass-through cryogenic magnetometer (Weeks 1993). Measurements were made at 1 cm intervals down-core, although the response functions of the u-channel magnetometer pick-up coils have a width of ∼4.5 cm (at half-height), meaning that only every fourth measurement, at best, is independent. The u-channels were AF demagnetized at 5 mT steps for peak fields of 20–60 mT, and at 10 mT steps for the 60–100 mT interval. The characteristic remanent magnetization component was computed at 1 cm intervals using the standard least-squares technique (Kirschvink 1980) applied to the 30–80 mT demagnetization interval.
For the determination of normalized remanence for relative palaeointensity estimates, anhysteretic remanent magnetization (ARM) was applied with an 80 mT alternating field and a 0.05 mT dc bias field. An isothermal remanent magnetization (IRM) was imparted using a dc field of 300 mT. Both ARM and IRM were AF demagnetized at the same peak fields as NRM.

3 Results
3.1 Magnetic mineralogy
Orthogonal projections of AF demagnetization data show characteristic magnetization components that are isolated at peak fields above 20 mT (Figs 2a and b). For some samples, however, 15– 25 per cent of the NRM remains after AF demagnetization at peak fields of 100 mT, indicating the presence of a high-coercivity NRM carrier. Thermal demagnetization of NRM of discrete samples indicates maximum unblocking temperatures below 600 °C, indicating the presence of magnetite (Fig. 2c). Results from three-axis IRM experiments indicate the presence of magnetic minerals with differing unblocking temperatures and coercivities (Fig. 3). The data are consistent with the presence of a low-coercivity component with maximum unblocking temperature below 600 °C, indicative of magnetite. A higher-coercivity component with unblocking temperatures of ∼350°C, indicative of magnetic iron sulphide may be present in some of the samples. Low-temperature MPMS data showed a cooling curve from 300 to 10 K marked by a clear Verwey transition between 110 and 120 K (Fig. 4) confirming the presence of magnetite.
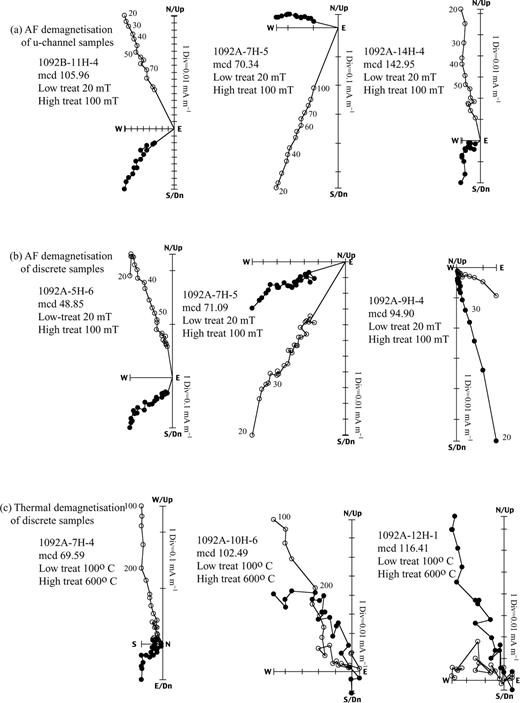
Orthogonal projections of AF demagnetization data for (a) u-channel samples, (b) discrete samples and (c) thermal demagnetization of discrete samples after AF demagnetization. Open circles represent projections of the vector endpoint on the vertical plane. Closed circles represent projections of the vector endpoint on the horizontal plane.

Isothermal remanent magnetization intensity plotted against temperature for three-axis IRMs imposed orthogonally prior to thermal demagnetization. Closed circles represent the 0.1 T IRM, closed triangles represent the 0.3 T IRM and closed squares represent the 1 T IRM.
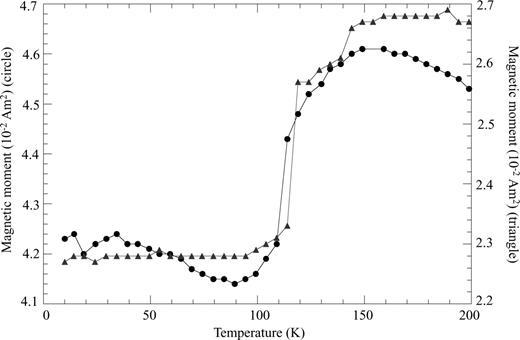
Cooling curves showing the Verwey transition between 110 and 120 K, indicating the presence of magnetite. A field of 1 T was applied at room temperature to give a saturation magnetization. Triangles represent a sample from 84.94 mcd (1092C-9H-6) and circles represent a sample from 56.43 mcd (1092D-2H-7).
Between 50–60 mcd, NRM, ARM and IRM (Fig. 5) have relatively high values. From 60–120 mcd, the records show a large variability. Below 120 mcd, intensities are lower with less variability. The susceptibility has low to negative values for most of the section, as a result of a dominant signal from diamagnetic minerals such as calcite.
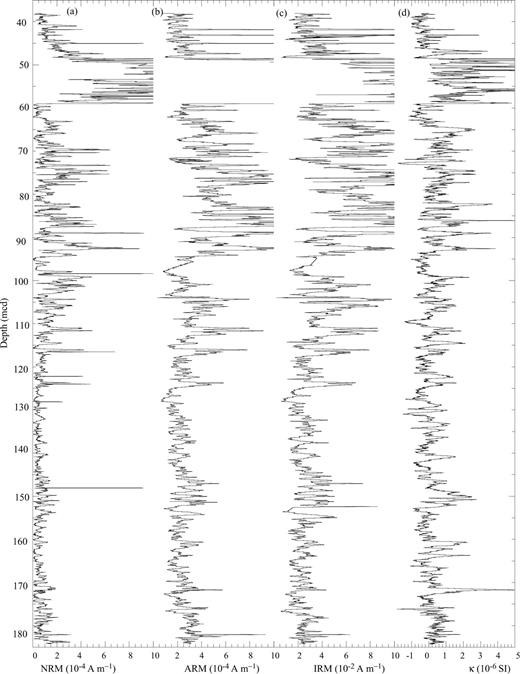
ODP site 1092: (a) NRM, (b) ARM, (c) IRM, all after AF demagnetization at a peak field of 30 mT and (d) volume susceptibility.
3.2 Magnetic stratigraphy
At site 1092 maximum angular deviation (MAD) values calculated for the remanence components are generally below 10°, indicating well-defined magnetization components (Figs 6 and 7). The mean inclination in the sampled section (65.9°) is close to that expected (64.5°) for a geocentric axial dipole field at the site. Component declinations undergo 180°shifts at polarity reversals for much of the section. In some intervals, particularly at 124–130 mcd, the declination is more variable than would be expected, possibly indicating twisting of this core (1092C-13H) during drilling. The magnetic polarity stratigraphy can be correlated by pattern fit of polarity zones to the CK92/95 GPTS (Fig. 8, Table 1) from 39 mcd (the base of the Olduvai subchron) to 58 mcd, and from 73 to 185 mcd (Fig. 8). The 58–73 mcd interval corresponding to the Gilbert Chron (C3) cannot be correlated, possibly owing to the presence of one or more sedimentary hiatuses (Fig. 6). Hole 1092A continues below the base of the composite section (185 mcd) to a depth of 220 mcd (Fig. 8). Chrons C5ABr-C5Bn.1n have been identified in the 185–220 mcd interval from shipboard data (Shipboard Scientific Party 1999). Interval sedimentation rates at site 1092 (Fig. 9) were calculated using the magnetic polarity interpretation shown in Fig. 8.
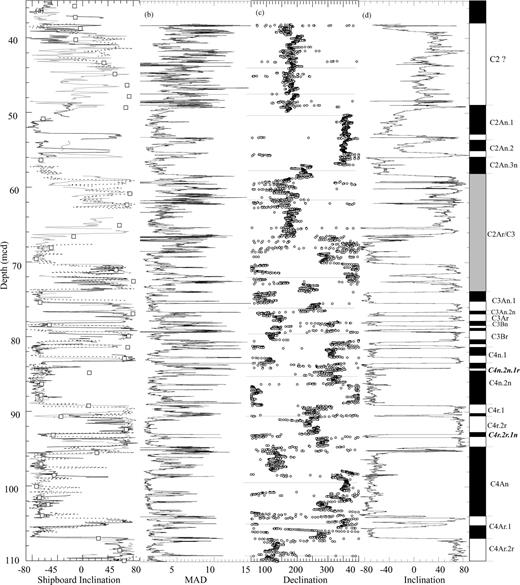
ODP site 1092: 35–110 mcd. (a) Shipboard measurements of palaeomagnetic inclination after AF demagnetization at a peak field of 25 mT. The continuous black line indicates data from hole 1092A, the dashed line indicates data from hole 1092B, and the continuous grey line indicates data from hole 1092C. Open squares represent component inclinations derived from AF demagnetization of discrete samples. (b) U-channel maximum angular deviation values. (c) U-channel component declination. Core breaks are indicated by horizontal lines. (d) U-channel component inclination data and polarity interpretation. Chrons are labelled according to Cande & Kent (1992a, 1995). Grey interval (C2Ar/C3) represents interval of uninterpretable polarity stratigraphy. Labels for subchrons not included in CK92/95 are in italics.
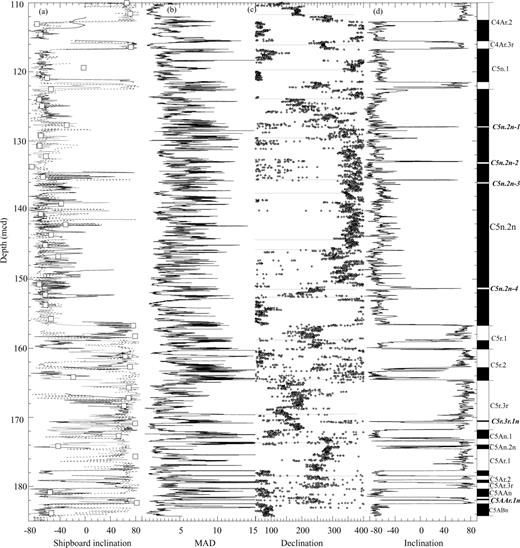
ODP site 1092: 110–185 mcd (a) Shipboard inclination (as for Fig. 6). (b) U-channel maximum angular deviation values. (c) U-channel component declination. Core breaks are indicated by horizontal lines. (d) U-channel component inclination data and polarity interpretation. Labels for subchrons not included in CK92/95 are in italics.
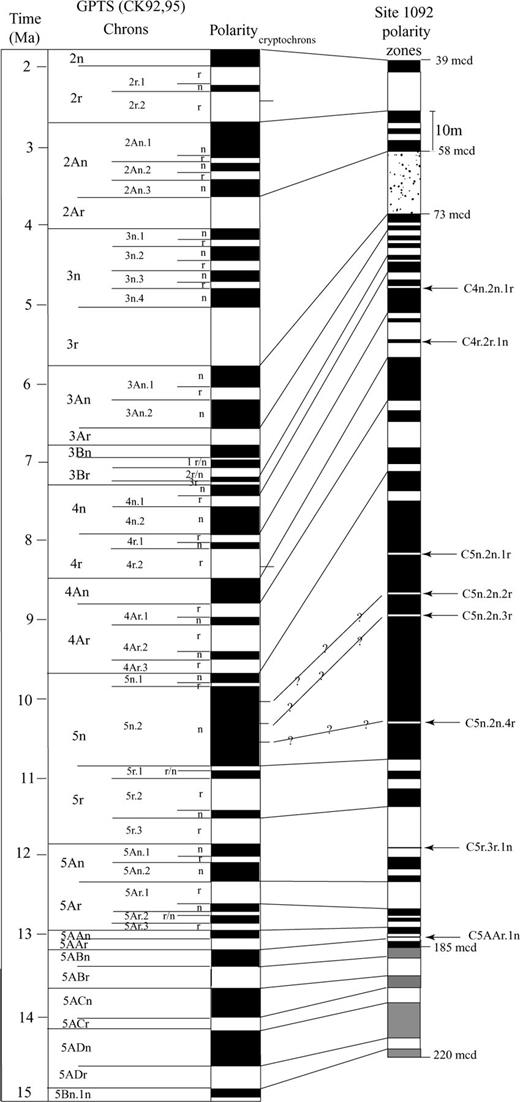
Correlation of the polarity stratigraphy at ODP site 1092 with the GPTS of Cande & Kent (1992a, 1995). Stippled area indicates interval of uninterpretable polarity stratigraphy. Grey shading in the 185–220 interval indicates the interpretation from shipboard data only.

Positions of the polarity zone boundaries at site 1092 in metres composite depth. Ages are from the GPTS of Cande & Kent (1992a, 1995). Asterisks indicate ages calculated for the short polarity not represented in the GPTS. Italics indicate results (Shipboard Scientific Party 1999) from below the composite section sampled with u-channels.
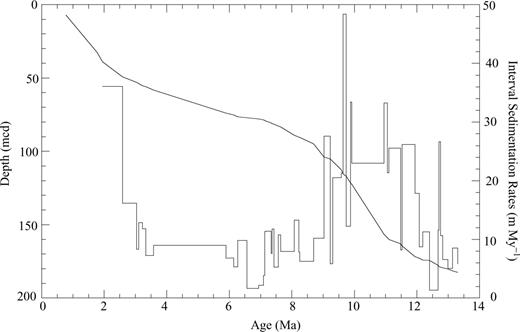
Interval sedimentation rates and depth plotted versus age calculated from the age model produced by correlation of the polarity stratigraphy at site 1092 to the GPTS of Cande & Kent (1992a, 1995).
A normal-polarity subchron is recognized within chron C4r.2r (Fig. 6) that may correlate with cryptochron C4r.2r-1 in CK92/95 (Fig. 8). This zone of normal polarity has also been identified by Schneider (1995) at ODP site 845 in the eastern equatorial Pacific. Three other polarity subchrons not found in CK92/95 are identified: one in C4n.2n (Fig. 6), one in C5r.3r and one in C5AAr (Fig. 7).
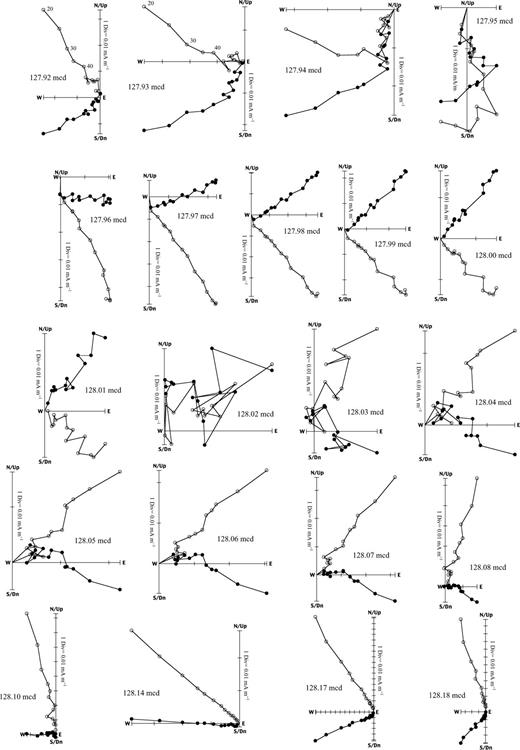
Four thin reverse-polarity zones are found within the polarity zone that correlates with C5n.2n (Fig. 7). The equivalent subchrons are labelled C5n.2n-1-4. Component directions that define the polarity subzones have MAD values <15° and orthogonal projections of AF demagnetization data also indicate that these short reverse-polarity intervals are characterized by well-defined magnetization components. In the example shown in Fig. 10, the orthogonal projections from this 26 cm thick interval (representing C5n.2n-1) are complicated by more than one NRM component; however, both normal and reverse-polarity directions are clearly recorded. At 128.18 mcd the polarity can be seen to be normal, while at 128.08 mcd the onset of the transition to reverse polarity is recorded. At 128.01 mcd the polarity is fully reversed and remains reversed until 127.95 mcd at the transition to normal polarity. The transition is complete by 127.92 mcd with a return to normal polarity. The high-coercivity component has a reverse direction at 128.07 mcd, below the level at which the lower-coercivity component shows fully reverse polarity (at 128.01 mcd). This implies that the high-coercivity carrier acquires a magnetization a few centimetres below the level at which the low-coercivity magnetization is acquired. Assuming constant sedimentation rates within C5n.2n, the estimated durations of the subchrons are in the 3–6 kyr range, and the estimated ages are: C5n.2n-1, 10.08; C5n.2n-2, 10.24; C5n.2n-3, 10.32 and C5n.2n-4, 10.79 Ma (Table 1).
Orthogonal projections showing event C5n.2n-1, in core section 1092C-13H-6, during AF demagnetization at peak fields from 20 to 60 mT in increments of 5 mT, and 60–100 mT in 10 mT increments. Open circles represent projections of the vector endpoint on the vertical plane. Closed circles represent projections of the vector endpoint on the horizontal plane.
3.3 Normalized remanence data
NRM/ARM or NRM/IRM are the standard sedimentary relative palaeointensity proxies. For normalized remanence data to yield useful palaeointensity proxies, the normalizer (ARM or IRM) should activate the same grains that carry the NRM, thereby compensating for changes in the concentration of NRM-carrying grains, and the NRM should be carried by pseudo-single domain (1–15 µm) magnetite grains. Concentration variations of more than an order of magnitude, as measured by variations in volume susceptibility, ARM and IRM, should be avoided as normalization is unlikely to compensate for large changes in the concentration of remanence-carrying grains caused by the effect of grain interactions (King 1983; Tauxe 1993). At site 1092, the sediments above 120 mcd are not suitable for palaeointensity study because of very large changes in the concentration of magnetic minerals as indicated by large changes in NRM, ARM and IRM intensities (Fig. 5). Below 120 mcd, the magnetic concentration parameters vary by less than an order of magnitude, and therefore these sediments may provide palaeointensity estimates. The possible presence of magnetic minerals other than magnetite could, however, complicate palaeointensity estimates. Between 120 and 160 mcd, AF demagnetization data show little evidence for high-coercivity components (Fig. 10), that are apparently present elsewhere (Fig. 2). S-ratios are fairly constant at values of ∼0.8 (Fig. 11) in the 120–160 mcd interval with only small variations. This indicates that there is little change in the concentration of higher-coercivity material(s) in this interval. We have computed values of NRM/IRM and NRM/ARM after AF demagnetization at 5 mT steps in the 20–60 mT range for the 120–160 mcd interval. The mean of these nine values of NRM/ARM and NRM/IRM were calculated at 1 cm intervals (Fig. 11). The mean NRM/ARM closely resembles the mean NRM/IRM, although NRM/IRM values are more constant during stepwise AF demagnetization, indicating that the coercivity of IRM more closely mimics the coercivity of NRM. To support the results from NRM/ARM and NRM/IRM, several other palaeointensity proxies were determined: the slope of NRM versus IRM, the slope of NRM versus ARM, and subtracted vector normalization. All proxies yielded a very similar variability.
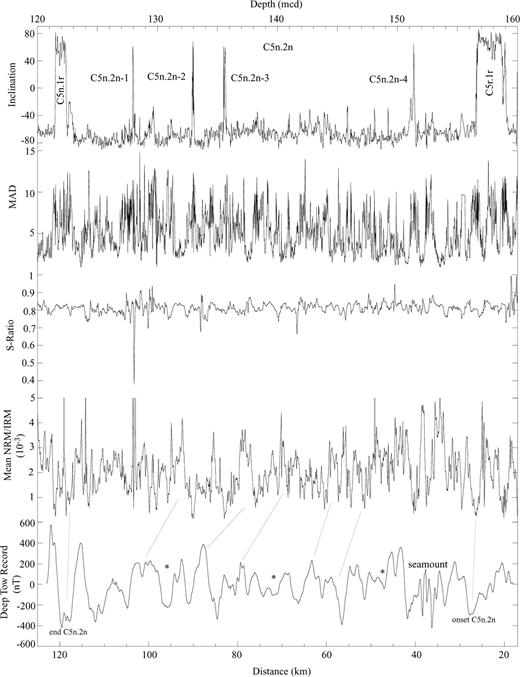
Polarity zone correlates with C5n.2n at site 1092: component inclinations, MAD values, S-ratios, mean NRM/IRM and the deep-tow marine magnetic anomaly (MMA) record of Bowers (2001) from 19°S on the EPR. Correlations of the CK92/95 cryptochrons to the MMA record are indicated (asterisks) after Bowers (2001). Tentative correlation lines are marked between the deep-tow magnetic anomaly record and the site 1092 palaeointensity proxy record (mean NRM/IRM).
4 Discussion
4.1 Biostratigraphy
Diatoms provide the only available biostratigraphy from the site (Censarek & Gersonde 2002) and provide a potential means of checking the polarity zone correlation to the GPTS. Miocene diatom events, however, have not been well tied to polarity stratigraphies in the Southern Ocean. ODP sites 689 and 690, drilled on the Maud Rise during ODP leg 113, provide two of the more complete magnetic stratigraphies for the Miocene—Pliocene from the Southern Ocean (Speiss 1990). Several diatom events yield consistent correlation with the GPTS at holes 689B, 690B and at site 1092. The first occurrence datum (FOD) of Hemidiscus triangularis occurs within C3Br.2r at site 1092 and hole 689B. The FOD of Asteromphalus kennettii is found within C5n.2n at holes 689B and 690B, and at site 1092. The last occurrence datum (LOD) of Nitzschia denticuloides occurs close to the onset of C5r.3r at all three sites. An age of 14.2 Ma was given by Censarek & Gersonde (2002)for the FOD of Denticulopsis simonsenii based on the correlation of this event to C5ADn at holes 689B and 690B. The interpretation of the polarity stratigraphy in this interval at holes 689B and 690B is, however, equivocal owing to numerous hiatuses. The same age for the FOD of D. simonsenii was also reported from site 744 (ODP leg 119) on the Kerguelen Plateau (Baldauf & Barron 1991); however, this is also uncertain because of the poorly defined magnetostratigraphy from site 744 (Keating & Sakai 1991). At site 1092, the interpretation of the polarity stratigraphy results in a correlation of the FOD of D. simonsenii to C5ABn that yields an age of ∼13.4 Ma for this event.
The absence of a number of diatom events in the 62.14–68.62 mcd interval at site 1092 was interpreted by Censarek & Gersonde (2002) as indicating two hiatuses within the Gilbert Chron. The apparent normal-polarity zone in the 66–70 mcd interval (Fig. 6) therefore cannot be confidently assigned to any of the four normal-polarity subchrons within the Gilbert Chron.
Censarek & Gersonde (2002) advocated a hiatus at ∼178 mcd on the basis of the coincidence of the FOD of Denticulopsis praedimorpha and N. denticuloides and the LOD of Actinocyclus ingens (Censarek & Gersonde 2002). This hiatus is not apparent from the magnetostratigraphic record, as C5Ar.1r, C5Ar.1n, C5Ar.2r, C5Ar.2n and C5Ar.3r are all clearly recorded in this interval.
4.2 Subchron C5n.2n
Polarity subchron C5n.2n in CK92/95 includes three ‘cryptochrons’ first recorded as ‘tiny wiggles’ in marine magnetic anomaly (MMA) profiles from the North Pacific Ocean (Blakely 1974). The ‘tiny wiggles’ in MMA records have been thought to represent fluctuations in the intensity of the geomagnetic field (Cande & LaBrecque 1974; Cande & Kent 1992b) and/or short-polarity intervals (Blakely & Cox 1972; Blakely 1974). Over the last 25 years, ‘tiny wiggles’ in MMA records of C5n.2n have been represented as polarity subchrons in several versions of the GPTS, notably those of Ness (1980) and Harland (1982); Harland (1990). They were not included in the GPTS by Lowrie & Alvarez (1981) or Berggren (1985) because of the lack of confirming magnetostratigraphic evidence for reversals of the geomagnetic field in this interval. At site 1092, the interval between 122 and 156 mcd correlates with C5n.2n, providing a 34 m thick interval with a mean sedimentation rate of 3.3 cm kyr−1. This relatively high sedimentation rate (Fig. 9) facilitates recognition of fine-scale features in the directional and palaeointensity record.
The palaeomagnetic data from C5n.2n were treated using the deconvolution scheme of Oda & Shibuya (1996), which has been modified for u-channel data (Guyodo 2002). The deconvolution was performed on data from each demagnetization step, and the magnetization components were then recalculated from the deconvolved data. The resolution of palaeomagnetic inclination from the four short-polarity subzones within C5n.2n is increased after deconvolution (Fig. 12).
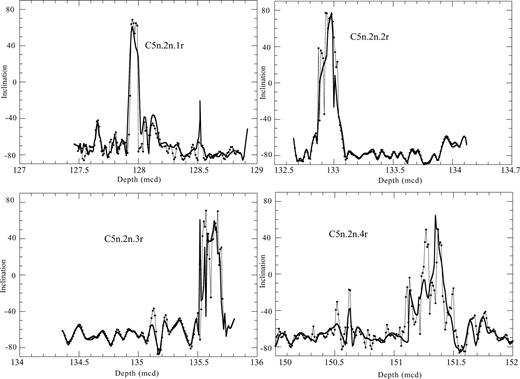
Component inclinations plotted against metres composite depth for the four short-polarity subzones within C5n.2n. The thicker line indicates u-channel component inclinations and the thinner line with points indicates the same data after deconvolution.
Polarity subchron C5n.2n has been recorded at ODP site 884 on the slopes of the Detroit Seamount (NW Pacific). Three polarity subzones were identified in the polarity zone interpreted as correlating with C5n.2n (Roberts & Lewin-Harris 2000). These subchrons were estimated to have durations of 6, 26 and 28 kyr, assuming constant sedimentation rates in C5n.2n. The duration of the subzones at ODP site 884 and ambiguities in the interpretation of the polarity stratigraphy at this site makes it unlikely that these are the same subchrons recorded at ODP site 1092.
Continental records of short-polarity events in C5n.2n have been reported from NE Spain (Garces 1996), Bolivia (Roperch 1999) and western China (Li 1997). The section from the Pyrenees in NE Spain consists of a composite section from two terrestrial sequences that cover the interval from 8.7 to 11.1 Ma (Garces 1996). The magnetic stratigraphy can be interpreted on the basis of a polarity zone pattern fit to the GPTS aided by the FOD of Hipparion. The polarity zone correlating with C5n.2n has a thickness of 175 m and includes a ∼5 m polarity zone in its upper part that was correlated with cryptochron C5n.2n-1 in CK92/95.
A 4.5 km thick composite section of red-beds from the Bolivian Altiplano produced a magnetic stratigraphy for the 9–14 Ma interval (Roperch 1999). The polarity zone correlating with C5n.2n is 1 km thick in this section and contains a single 5 m thick polarity zone that correlated with cryptochron C5n.2n-1. The interpretation of the polarity stratigraphy is supported by 40Ar/39Ar age determinations on two tuff layers within the section (one within C5n.2n).
An upper Cenozoic section in western China recorded three short reverse-polarity zones within C5n.2n (Li 1997). The polarity interpretation at the site is fairly unambiguous, and is corroborated by the presence of vertebrate fossils. The events are, however, only represented by single discrete samples. The authors correlate these events with the three cryptochrons in CK92/95.
Recent studies have shown that Quaternary sedimentary palaeointensity records can be correlated over large distances (e.g. Meynadier 1992; Guyodo & Valet 1996; Stoner 2000). Valet & Meynadier (1993) produced a palaeointensity record for the interval 0–4 Ma and Tauxe & Hartl (1997) produced an 11 Myr record of Oligocene age. The sediments at site 1092 have produced high-quality directional palaeomagnetic data, indicating that the characteristic magnetization component was acquired early in the history of the sediment (Fig. 10). For the 120–160 mcd interval, the magnetic concentration parameters are less variable (Fig. 5), and the influence of high-coercivity minerals appears to be reduced (Fig. 10). The mean NRM/IRM record (Fig. 11) is consistent with other palaeointensity proxies: NRM/ARM, the slope of NRM versus IRM, the slope of NRM versus ARM and subtracted vector normalization.
A single track of deep-tow magnetic anomaly data, covering chron 5, was collected in 1998 at 19°S on the flanks of the East Pacific Rise (Bowers 2001). The half-spreading rate at this site was estimated to have been 9 cm yr−1 for the Late Miocene. This profile revealed more than twice as many ‘tiny wiggles’ as seen in profiles from the North Pacific region, where Blakely (1974) first identified the four short-wavelength anomalies within C5. Bowers (2001) identified a number of short-wavelength positive magnetic anomalies within C5n.2n, several of which were interpreted as correlating with the three cryptochrons in the CK92/95 GPTS (Fig. 11). Because of the high resolution of the 19°S profile, we have attempted to correlate it to the palaeointensity record from C5n.2n at site 1092 (Fig. 11). Using 12 tie points an optimal correlation between the palaeointensity proxy and the deep-tow anomaly data can be achieved (r= 0.5), resulting in sedimentation rates within C5n.2n varying from 2.2 to 5 cm kyr−1.
5 Conclusions
The polarity stratigraphy at ODP site 1092, from u-channel samples, extends from the base of the Olduvai subchron to subchron C5ABn (∼13.5 Ma). The magnetic stratigraphy is one of the more complete of this age from the Southern Oceans. Sedimentation rates at the site vary from ∼0.5 to 5 cm k yr−1(Fig. 9) and increased during C5n.2n, allowing recognition of fine-scale features in both the directional and the palaeointensity records (Fig. 11).
Four reverse-polarity subchrons are observed within C5n.2n that may correlate with ‘cryptochrons’ in CK92/95. A short normal-polarity subchron within C4r.2r appears to correlate with a subchron recognized in sediments from ODP leg 138 (Schneider 1995) and with another cryptochron in CK92/95. At site 1092, three other subchrons not represented in CK92/95, are recognized within chrons C4n.2n, C5r.3r and C5AAr. The estimated duration of short-polarity subchrons within C5n.2n (3–6 kyr) is consistent with short events representing reversals of the magnetic field in the Earth's outer core, but not in the solid inner core, where the field must change by diffusion with a timescale of ∼3 kyr (see Gubbins 1999; Hollerbach & Jones 1995). The solid inner core is believed to stabilize field polarity, so that long-lasting polarity subchrons only become established if the reversed outer core field persists for sufficient time for it to diffuse into the inner core.
The CK92/95 GPTS includes 21 ‘cryptochrons’ in the Late Eocene and Oligocene, four in the Late Miocene (three in C5n.2n and one in C4r.2r) and three in the Plio-Pleistocene. Recently, it has been shown that short directional ‘events’ were commonplace over the last 2 Myr, both for the Brunhes Chron (Lund 2001) and Matuyama Chron (Singer 1999; Channell 2002). Magnetostratigraphic studies of marine and terrestrial sediments of Eocene—Oligocene age show, thus far, a lack of short directional events. The Late Miocene palaeomagnetic record at site 1092 provides evidence for brief polarity subchrons not present in CK92/95, and indicates that at least some of the ‘tiny wiggles’ observed in MMA records are caused by geomagnetic polarity reversals.
Acknowledgments
A. Roberts, J. Stoner and an anonymous reviewer provided constructive comments that helped to improve the manuscript. We thank J. Gee and S. Cande for providing us with the MMA deep-tow data and a preprint of Bowers (2001). We thank the Institute for Rock Magnetism in Minneapolis for use of its facilities. The IRM is funded by the Keck Foundation, the National Science Foundation and the University of Minnesota. The staff of the ODP core repository in Bremen were very helpful with core sampling. This research was funded by grants from ODP/USSSP and the National Science Foundation (OCE 97-11424).
Note Added in Proof
Based on recent down-core XRF measurements, Thomas Westerhold at the University of Bremen has produced a revised composite depth section for ODP Site 1092 (Westerhold, private communication). These new data allow improved correlation between holes at Site 1092 and have important ramifications for the reversed polarity subchrons identified within C5n.2n. In the new composite depth section, the overlap of cores 1092A-13H and 1092C-14H, that record polarity subchrons within C5n.2n, changes by 2.57 m relative to the shipboard mcd (used in this paper). Short polarity subchrons labelled C5n.2n-2 (recorded in core 1092A-13H) and C5n.2n-3 (recorded in core 1092C-14H) now become a single subchron recorded in both Hole 1092A and Hole 1092C. When the same mcd adjustment is applied to the normalized remanence record, the correlation to the deep tow magnetic anomaly record (Fig. 11) is slightly improved.
References
