


Summary
A paleomagnetic study was carried out on recent volcanic rocks exposed on Deception Island (63.0°S, 60.6°W), Antarctica. Sampling comprised all stratigraphic units exposed on the island, which include basaltic, andesitic and trachytic lavas, basaltic dykes and pyroclastic flows. Following stepwise thermal and alternating field demagnetization procedures, consistent characteristic remanence directions were determined at 21 sites, using principal-component analysis. The overall mean remanence direction for the Deception Island rocks is dec. 348.8°, inc. −73.7°, α95= 4.4°, N= 21, and is consistent within error with the geocentric axial dipole direction at the study locality. All of the studied rocks show normal polarity, indicating a Brunhes Chron age. The only available radiometric date of 153 ± 46 kyr agrees with this and suggests a minimum chronostratigraphic span of 100 kyr for the sampled rocks. The site mean directions show a Fisherian distribution and dispersion values compatible with current palaeosecular variation models. No evidence of the far-sided or right-handed effect is found in our data.
Introduction
The study of the origin and behaviour of the Earth's magnetic field is a branch of geophysics that has received very broad and deep interest over the last few decades (see, for example, Merrill 1996). Despite the extraordinary progress made in theoretical and simulation studies, observational results of the field parameters remain a fundamental tool for its description, and provide constraints that every model of the field must account for (e.g. Carlut & Courtillot 1998, and references therein). Since recorded observations only go back a few centuries in the best cases (Merrill 1996), reconstruction of the field direction and intensity in previous times must rely on paleomagnetic studies, both in archaeological and geological materials.
This is hampered, however, by the discontinuous character, both in time and space, of the sources of these data, the scarce number of published studies and the fact that many of the old published data do not withstand present-day reliability criteria (e.g. McElhinny 1996). However, many of these unreliable data are still accepted in most compilations because their exclusion would slim the databases too much for any modelling or inversion (Carlut & Courtillot 1998). In particular, there is a remarkable paucity of paleomagnetic data from the Southern Hemisphere for the last few million years. This is due in part to the reduced continental masses in this hemisphere, but an uneven distribution of study localities makes things even worse (Quidelleur 1994). Until recent years there was no reliable paleomagnetic record from lava flows of the last 5 Myr for the whole world in a longitude band between 40° and 80°W (Quidelleur 1994). This gap has recently started to fill up, although the published studies on this longitude band only correspond to low latitudes (Canon-Tapia 1994; Carlut 2000).
The existence of several volcanic islands with Plio-Quaternary deposits in the extreme north of the Antarctic Peninsula, around 63°S and 60°W, provides an excellent target for paleomagnetic studies that may fill some gaps in the present database. Previous studies by Blundell (1962) and Valencio & Fourcade (1969) on rocks of Deception Island were based on a small number of samples and did not use detailed stepwise demagnetization techniques, thus leaving doubts concerning their reliability. Considering that paleomagnetic studies from recent volcanic rocks in high southern latitudes would certainly provide some further constraints for a better modelling of the Earth's magnetic field behaviour, a paleomagnetic study was carried out on several recent dykes and lavas and pyroclastic flows from Deception Island (DI), located at 62°57′S- 60°37′W.
Deception Island is situated in the Bransfield Strait marginal basin that separates the South Shetland Islands archipelago from the Antarctic Peninsula (Fig. 1). It has a horseshoe-shaped morphology (Fig. 2) generated by the collapse of the central part of a stratovolcano. The origin of the volcano is related to a spreading centre in the Bransfield Strait, which is responsible for a line of submerged seamounts. This paper presents paleomagnetic results from samples collected during fieldwork on Deception Island in the summer seasons of 1996 and 1997.
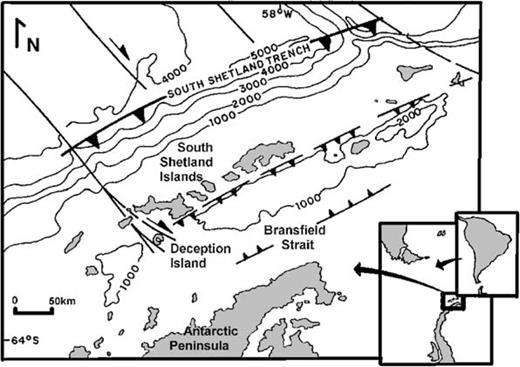
Regional geotectonic framework of the Drake Passage and location of the South Shetland Islands.

Geologic map of Deception Island and location of paleomagnetic sampling sites (taken from Smellie 1997 and Baraldo & Rinaldi 2000).
Geological Background
The region is characterized by complex tectonic processes, which involve the southern tip of South America, the Drake Passage and the Antarctic Peninsula (Fig. 1). Seismicity in the Bransfield Strait reveals active subduction with backarc extension (Pelayo & Wiens 1989). The geochemical character of the volcanic islands in the Bransfield Strait is transitional between calc-alkaline and MORB and the composition of the volcanic rocks of Deception Island ranges from olivine basalt to rhyodacite (Weaver 1979; Risso 1994).
According to a preliminary paleomagnetic study by Valencio & Fourcade (1969) and Valencio (1979), the age of the rocks exposed on the island corresponds to the Brunhes Chron, as only normal polarities were found. This would suggest a maximum age of 780 kyr (Cande & Kent 1995), although the small number of samples studied did not provide any certainty. Our systematic study, however, has confirmed this young age for all rocks exposed on the island (see also Baraldo 1999; Rapalini & Baraldo 1999). A 153 ± 46 kyr K—Ar age was reported by Keller (1991), but owing to the lack of a precise stratigraphic position or location of the analysed sample, this can only be taken as a minimum age for the island. It also means that our sampling encompassed at least 100 kyr, considering that volcanic activity has still been observed in historic times.
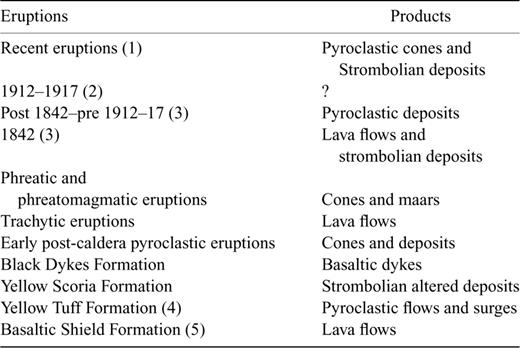
Simplified stratigraphic chart of volcanic and pyroclastic rocks of Deception Island following Baraldo & Rinaldi (2000). (1) Baker (1975); (2) Orheim (1971); (3) Roobol (1973); (4) and (5) Martí & Baraldo (1990).
The post-caldera phase is divided into different eruptive episodes: early post-caldera effusive eruptions (EPE) made up of lava flows with basaltic to andesitic composition; early post-caldera pyroclastic eruptions (EPP), composed of air-fall and surge deposits from surtseyan eruptions; trachytic eruptions (TE), represented by lava flows and pumiceous deposits; phreatic and phreatomagmatic eruptions (PE); and, finally, historic eruptions (HE). The latter were studied by Roobol (1973), who compared historical maps of Deception Island with modern maps and aerial photographs. The most recent registered eruptions (1967, 1969 and 1970) were studied by Fourcade (1968, 1971), Fourcade & Viramonte (1972), Valenzuela (1970), Orheim (1971), González Ferrán (1971a,b), Baker (1975), De Rosa (1995), Mazzuoli (1987), Ortíz (1987) and Aparicio (1997).
Structural and stratigraphic evidence suggest that the pre-caldera deposits of BSF and YTF were generated from a single vent. Regional and local tectonics had an important influence on the generation and emplacement of the syn-caldera volcanism, by creating two subparallel NE—SW rifting areas, where most of the YSF and BDF deposits were emplaced (Baraldo & Rinaldi 2000). This was characterized by the emplacement of dykes and some strombolian deposits parallel to the caldera rim as well as the development of extensional fractures and faults at Macaroni and South Points. However, the tectonic influence in the magmatic processes and morphologic evolution of the island is still under debate (Rey 1997; Martí 1996; Baraldo & Rinaldi 2000). Nevertheless, the collapse of the caldera structure was undoubtedly controlled by the structural weakness related to the presence of a magma chamber (Baraldo & Rinaldi 2000).
According to the extensive distribution of the early post-caldera effusive eruptions, the central collapse proceeded gradually, thus giving time for lavas to flow into and out of the caldera rim. Once the collapse was well under way, the later volcanic events (since TE) took place exclusively inside the caldera rim (Baraldo & Rinaldi 2000).
Paleomagnetic Study
28 sampling sites were located on different stratigraphic units across the whole island (Fig. 2, Table 2). Five sites were located on BSF (DI02, DI10, DI13, DI80, DI90), seven on YTF (DI08, DI09, DI11, DI12, DI15, DI20, DI23), two on YSF (DI07, DI28), two on BDF (DI16, DI17), eight on EPE (DI06, DI19, DI25, DI27, DI29, DI30, DI34, DI35), three on TE (DI03, DI04, DI31), and finally, one on the 1842 lava flow deposit (DI01). Six to ten oriented cores were drilled at each site and later sliced into one or two 2.2 cm high specimens. All samples were processed with a DC-SQUID cryogenic magnetometer (2G-750R). Magnetic cleaning was performed with a three-axis static alternating field (AF) degausser attached to the cryogenic magnetometer or a Schonsted TSD-1 thermal demagnetizer. One specimen per site was stepwise AF demagnetized in steps of 3, 6, 9, 12, 15, 20, 25, 30, 40, 50, 70, 90, 110 and 130 mT. Thermal demagnetization was performed on one sample from each site in steps of 100, 150, 200, 250, 300, 350, 400, 450, 500, 550, 600 °C. After that, the best demagnetization process was selected for the remaining samples at each site, resulting in thermal demagnetization for pyroclastic rocks (YTF and YSF) and AF demagnetization for the rest of the units. A similar detailed demagnetization was applied to all samples.
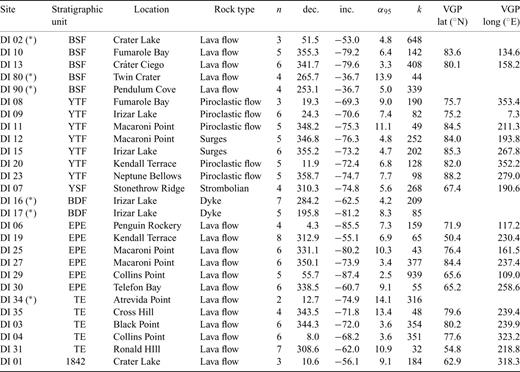
Site mean remanence directions for Deception Island: (*) direction ruled out owing to inferred tectonic disturbance or a low number of samples.
Analysis of paleomagnetic results was performed by a visual inspection of Zijderveld diagrams (Fig. 3) and determination of component directions by principal-component analysis (Kirschvink 1980). Maximum angular deviations (MAD) up to 15° were accepted with at least three (four or more in most cases) consecutive demagnetization steps; although nearly 95 per cent of the components determined had MAD <10° and nearly 65 per cent had MAD <5°.
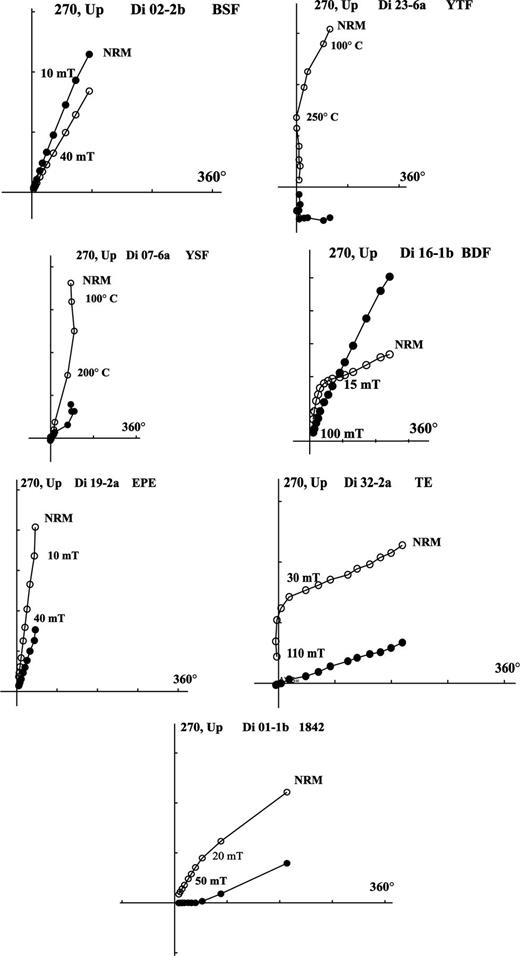
Representative demagnetization behaviour of samples from Deception Island. Open (solid) symbols represent vector endpoints projected on the vertical (horizontal) plane.
The bulk magnetic susceptibility (k) of all samples was measured with a RMSH-III susceptibility meter. A good correlation between bulk magnetic susceptibility and lithology was found in each stratigraphic unit (Baraldo & Rinaldi 2000). Changes in k values owing to chemical reactions during experimental heating were monitored in at least one sample per site. They generally showed no significant changes with temperature.
Hysteresis cycles (Fig. 4) and forward and backfield isothermal remanent magnetization curves were produced and analysed for a sample per site with a MicroMag 2900 alternating gradient magnetometer (Princeton Measurements Corp.). Jrs/Js (saturation remanent magnetization/saturation magnetization) and Hcr/Hc (remanent coercive force/coercive force) relations were calculated. Fig. 5 shows the distribution of the Deception Island rocks in the typical Day (1977) plot, to infer the domain size of the ferrimagnetic fraction. A large majority of the analysed samples fall in the pseudo-single domain (PSD) field, suggesting that most rocks from Deception Island are potentially good recorders of the geomagnetic field direction.
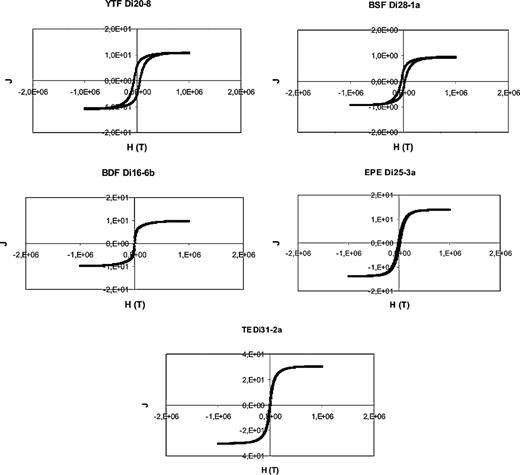
Hysteresis loops for representative samples of Deception Island. Note that in all cases saturation is reached with moderate to low magnetic fields (ferrimagnetic carrier).
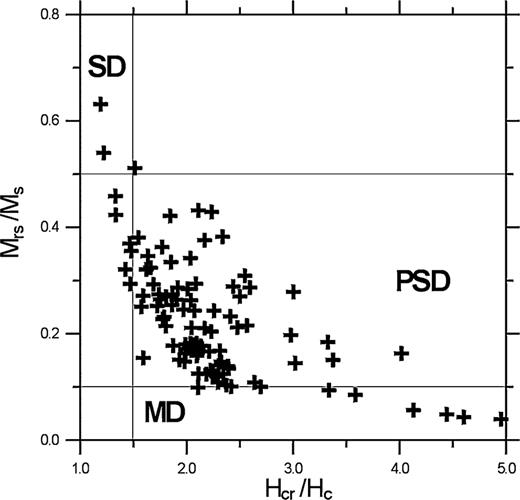
Distribution of the samples from Deception Island in a Day (1977) diagram. Note that most samples fall in the PSD field.
The samples processed showed two different demagnetization behaviours, corresponding to the rock type. Some of them presented only one component of remanence while the others showed two components (Fig. 3, Table 2). The latter is the case for most pyroclastic rocks (YTF and YSF, sites DI07, DI08, DI09, DI11, DI12, DI15, DI20, DI23, DI28). In these rocks, a low-temperature component (A) could be isolated between 20–100 and 300–400 °C with a steep and upward (negative) inclination, coincident with the expected recent field direction at Deception Island. A second magnetic component (B), trending towards the origin of the Zijderveld diagram, was isolated in all samples between 300–400 and 500 °C. No sample analysed showed unblocking temperatures higher than 500 °C. Component B showed a non-systematic direction both within and between sites. Components A and B had very little if any superposition of their unblocking temperature spectra. While A directions are very well grouped around the expected magnetic field direction, the scatter of B directions is conspicuous (Fig. 6). The unblocking temperatures and response to AF demagnetization suggest that the magnetic carrier of component B is a mineral from the titanomagnetite series. If A is carried by the same magnetic mineral as B, then it is likely that A and B are partial thermal remanence acquired by cooling during ejection (B) and after deposition (A) of this material. This suggests that the unblocking temperature of A may correspond to the emplacement temperature of the pyroclastic debris (Rapalini & Baraldo 1999). However, a definitive proof of this hypothesis is now under study. Because of the randomness of B and the coincidence of A with the expected magnetic field direction, component A is the one considered in this paper.
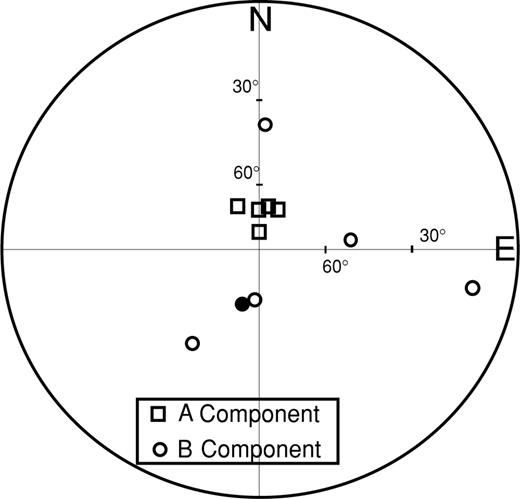
Distribution of low (squares) and high (circles) temperature components determined from site DI-09 corresponding to the Yellow Tuff Formation. The tight grouping of the low-temperature component and scatter of the high temperature one may suggest a partial thermal remanence acquired after deposition of the pyroclastic flow. For further discussion see the text.
The sites on the YTF correspond to two different lithologies (Martí & Baraldo 1990): laminar pyroclastic flow deposits of the lower member (DI08, DI09, DI11, DI20, DI23) and turbulent pyroclastic surge deposits of the upper member (DI12, DI15). Remanence directions from the YTF are well grouped, suggesting a short deposition time. The lava flows of the BSF (DI02, DI10, DI13, DI80, DI90; Figs 3 and 7), presented only one component with a high within-site direction consistency. However, sites DI02, DI80 and DI90 were excluded from further analysis because it was inferred that they have been affected by tilting during the caldera collapse by field observations and confirmed by comparison of their remanence directions with those from sites that were not affected by the structural collapse of the caldera (DI-10) (Baraldo 1999). YSF is represented by only two sites (DI07 and DI28), one of which (DI28) was rejected owing to a lack of coherent directions. Site DI07 has a mean direction close to those from YTF (Fig. 7). This could mean a short time span between the emplacement of both formations.
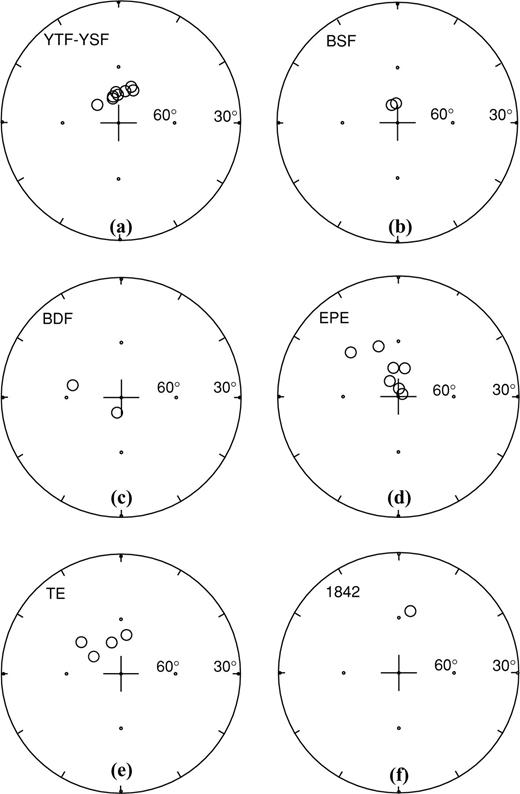
Characteristic mean site directions for each unit of the Deception Island rocks. For more details see the text and Table 2.
Samples from BDF (sites DI16 and DI17; Figs 3 and 7) showed two components with low directional consistency, especially those with lower coercivities. The higher-coercivity component is considered as recording the Earth's magnetic field direction at the time of the intrusion of the dykes. However, their directions are somewhat anomalous, which could be due to the fact that both dykes were emplaced in a tectonically disturbed area.
Most EPE sites (DI06, DI19, DI25, DI27, DI29, DI30) showed univectorial behaviour except for sites DI06 and DI34, in which two components were determined. Each site represents a different lava flow. Their directions are well grouped except for sites DI19 and DI30, which may suggest a longer time span for the extrusion of these flows, consistent with field observations (Baraldo & Rinaldi 2000).
Most samples from TE sites (DI03, DI04, DI31, DI34, DI35) showed two components of magnetization, except for site DI03. The low-coercivity component presented random directions. The high-coercivity component was therefore assumed to represent the Earth's magnetic field direction at the time of extrusion of these rocks. Site mean directions show some scatter, suggesting a longer time for the eruption of the trachytic flows. One site was excluded owing to the low number of samples (DI34).
HE is represented solely by site DI01, which corresponds to the lava flow from the 1842 eruption. It shows two components of different coercivity. The low-coercivity one is rejected because of its scattered directions. The high-coercivity component mean direction is consistent with the expected values for Deception Island in 1842, computed backward from the IGRF of 1901 (Fig. 7).
Statistical Analysis and Conclusions
Figs 8(a) and (b) and Table 2 show site-mean and overall mean remanence directions. The overall mean value: dec. 348.8°, inc. −73.7°, α95= 4.4°, obtained on the basis of 21 sites, agrees with the expected geocentric axial dipole (GAD) direction for the sampling area (dec. 0°, inc. −75.7°, Fig. 8b). A virtual geomagnetic pole (VGP) was calculated for each site, and they are presented in Fig. 8(c). All computed VGPs correspond to a normal polarity. Together with the geological and geochronological evidence this is taken as an additional argument that all exposed rocks on the island were extruded during the Brunhes normal-polarity chron and therefore should be younger than 780 kyr (Cande & Kent 1995).
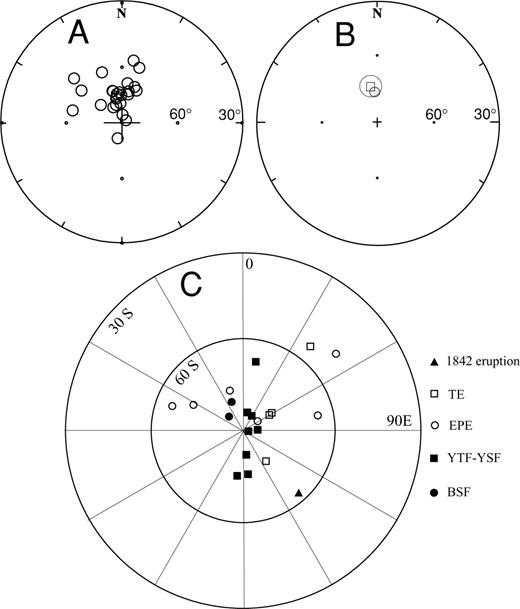
(a) Mean site directions for the Deception Island rocks. (b) Overall site mean direction (square) with its α95 and the expected geocentric axial dipole direction for Deception Island (grey circle). (c) South VGPs distribution for Deception Island rocks. Different symbols correspond to different geological units. For further references see the text and Tables 1 and 2.
The distribution of VGPs follows the stratigraphic relationships (Fig. 8). The similarity of all YTF and YSF VGPs suggests a short time for the extrusion, or remanence acquisition, of these rocks. In particular, VGPs from YTF can be subdivided into two groups. Those VGPs from sites DI8, DI9 and DI20 are somewhat displaced from the main group. They correspond to the lower member of the formation exposed on the western side of the island. This could indicate that emplacement of deposits of the lower member in this part of the island was not contemporaneous with that of those on the eastern side.
The remaining units tend to show a much larger dispersion, suggesting a longer time for their extrusion. However, they tend not to overlap with the former. Although a first-order clockwise pattern of distribution of all VGPs may be inferred (Fig. 8c), considering the uncertainties in the age of the different formations and the likely discontinuities in the stratigraphic succession, this could very well be an artefact and may not have any geomagnetic meaning.
The average of all computed VGPs is: 84.4°S, 48.1°E, A95= 7.0°, K= 21.5, N= 21. If VGPs computed from mean site directions with α95 > 10° are excluded, the calculated pole is indistinguishable from the previous calculation (86.2°S, 64.2°E, A95= 7.9°, K= 21.1, N= 17). Since the rocks studied span at least the last 100 kyr, it is likely that large amounts of secular variation were averaged out in the mean geomagnetic pole. A comparison of our data with PSV models was made by statistical analyses with graphical and formal testing procedures. Probability plots were used to check the goodness of fit of a Fisher distribution to the VGPs (Fisher 1987). Quantile—quantile (Q—Q) colatitude plots, using the exponential model (Fig. 9a) are reasonably linear, passing through the origin irrespective of the plots for the whole set of VGPs or for VGPs from site directions with α95 < 10°. In both cases the inverse of the line slope gives a similar graphical estimate of the precision parameter (k′= 20), which agrees well with the value obtained from the mean pole calculation. Q—Q longitude plots, using the uniform model (Fig. 9b) are approximately linear, passing through the origin. The slope of the lines of best least-squares fit are close to but somewhat less than 45° (43° for the whole data set and 44° for the sites with α95 < 10°). Therefore, neither plot suggests any important departure from the hypothesis that the underlying distribution is Fisherian. Given the similarity of both data sets it is considered more convenient to use the whole population of VGPs in order to work with a larger sample size.
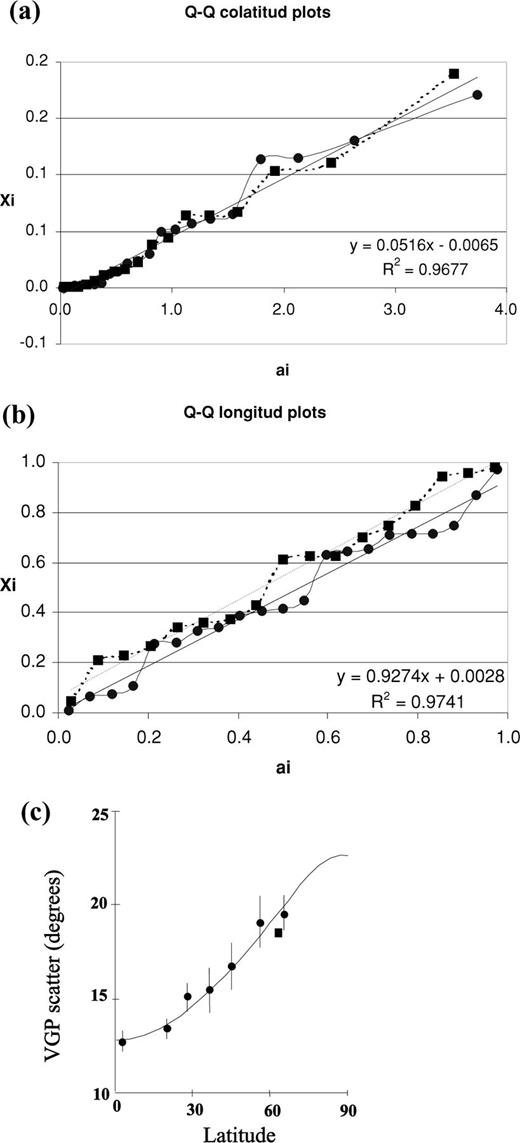
(a) Statistical Q—Q analysis for latitudinal distribution of VGPs for Deception Island for the whole data set (circles) and for VGPs from sites with α95 < 10° (squares), (b) idem (a) for longitudinal distribution, (c) comparison between the latitude variation of geomagnetic VGP dispersion for model G (circles, from McElhinny & McFadden 1997) and VGP dispersion data from Deception Island (square). For further references see the text.
Tests of significance (Stephens 1974) were used as an analytical procedure. The colatitude test gives a Kolmogorov—Smirnov modified statistic D*n= 1.205. This value is less than the critical value at a 95 per cent confidence level of Dc= 1.358. The longitude test gives a Kuiper modified statistic V*n= 1.078, less than the critical value at a 95 per cent confidence level of Vc= 1.747. Therefore, the hypothesis of a Fisher distribution cannot be rejected. This confirms the conclusions reached from the previous graphical analysis. So we accept the Fisher distribution as a model for the VGPs of Deception Island.
To check whether the data set average out the effects of palaeosecular variation, we compared the estimated parameters with different PSV models.
In order to compare the palaeosecular variation at Deception island with that predicted by an A type PSV model (Irving & Ward 1964), the model predicted value of the Fisher precision parameter was calculated. Following McFadden (1980) the most efficient predictor for the secular variation according to this model is k′= 18.1 (1 + 3 sin2λ), where λ is the site latitude (λ= 63°S, hence k′= 61.21). The value obtained from the Deception Island rocks is k= 53.83 with upper and lower limits (at 95 per cent confidence levels) of ku= 81.25 and kl= 38.82. The predicted value is close to that obtained and well within the upper and lower limits, suggesting a positive result for the test.
If the angular dispersion is used to characterize the secular variation, we obtain a value of s=θ63= 81°/√k= 17.46.
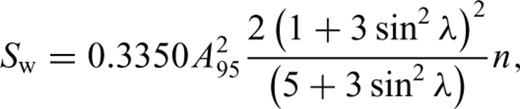
If Δi is the angular distance of the ith VGP from the geographic pole, the angular standard deviation (ASD), sp of N VGPs is given by  .
.
These results agree with the least-squares fit curve for model G for the combined polarity VGP scatter for the past 5 Ma (McElhinny & McFadden 1997, Fig. 9c).
Our palaeosecular variation data agree with the models employed. If these models are correct this would imply that our data has averaged out most PSV. If this is accepted, our new data could be utilized in analysing the time-averaged geomagnetic field. For several decades, the existence of long-term non-dipolar contributions superimposed on the geocentric axial dipole that last for several million years have been advocated (e.g. Wilson 1970). Recent analyses of global databases for the last 5 Myr (Constable & Parker 1988; Schneider & Kent 1990; McElhinny 1996; Carlut & Courtillot 1998) have agreed in the presence of a persistent axial quadrupole term (g02) of approximately 4–5 per cent of the axial dipole. This would account for the far-sided effect, first identified by Wilson (1970). Other, non-axial second-order terms cannot be established yet from the data presently available. Despite the apparent robustness of the axial quadrupole term, Carlut & Courtillot (1998) made the interesting observation that a stringent selection of data, based upon proper laboratory procedures in the paleomagnetic study, would lead to a very diminished database.
Our results show no evidence of the far-sided effect as the calculated mean paleomagnetic direction is 2° away from the expected GAD direction, well within its α95 (4.4°). In any case, the inclination of the calculated mean direction is lower than the expected one, in opposition to the expected higher inclinations in the southern hemisphere owing to the far-sided effect. There is no evidence in our data of the less conspicuous right-handed effect (Wilson 1971).
It is interesting that similarly to our new data, recent studies in the same longitude band at 35°S (the Azufre Volcano, Argentina, Canon-Tapia 1994) and at 16°N (Guadeloupe island, West Indies, Carlut 2000) have found no evidence for a far-sided effect. This is consistent, however, with the expected values of inclination anomaly, with respect to the GAD values, for the average global field model presented by Carlut & Courtillot (1998) for the Brunhes chron. According to this model at the three localities, the expected inclination should depart by less than 1° from the GAD inclination.
Acknowledgments
The authors wish to thank the Universidad de Buenos Aires and the Universidad Nacional Autónoma de Mexico, where these studies were carried out. Grants from the Universidad de Buenos Aires (AX43 and X045 to AER) and financial support from CONICET (Argentina) and CONACYT (Mexico) permitted travel of some of the authors between Argentina and Mexico. Field trips were possible owing to the support of the Instituto Antártico Argentino, to which the authors are gratefully indebted. Comments and suggestions by two anonymous reviewers improved the final version of our manuscript.
References
