


Summary
The discovery of a post tectonic natural remanent magnetization (NRM) carried by pyrrhotite in the Dauphinoise Zone of the Western Alps allows us to test the ability of these rocks to record a sequence of magnetic polarity versus temperature acquired during their slow cooling. Several laboratory experiments [composite partial thermal remanent magnetizations (pTRMs), Thellier–Thellier experiments, TRM thermal demagnetization] as well as NRM demagnetization were performed. This shows that the pyrrhotite grains are single domain sized and that they are able to record successive independent pTRMs. The NRM thermal demagnetization analysis demonstrates the occurrence of several antiparallel components. A comparison between NRM and TRM thermal demagnetizations is attempted in order to highlight small pTRMs naturally recorded in a temperature interval of only a few degrees. We attempt to retrieve the temperature at which each reversal occurs during the post metamorphic cooling. This method, called thermopalaeomagnetism, is discussed and developed in order to delineate the sequence of polarity chrons recorded versus temperature.
Introduction and background
Introduction
One particularly intriguing problem in understanding mountain belt evolution is when and how metamorphic rocks are exhumed, which requires the establishment of pressure–temperature–time (P–T–t) paths of the various units of the belt. P–T conditions can be estimated from the paragenesis of metamorphic minerals, while geochronological methods provide a closure age. The corresponding closure temperature is often difficult to assess, so the development of alternative thermogeochronological methods is desirable. Palaeomagnetism may provide such a new method.
The cooling rate (between 10 and 100 °C Myr−1) of metamorphic rocks can allow them to record a succession of geomagnetic field polarities. Slower cooling has enabled the recording of apparent polar wander (Dodson & McClelland Brown 1985), while faster cooling of an intrusion has been used to produce a record of a field reversal (Dodson et al. 1978 and Williams & Fuller 1982). The particular record of a polarity sequence is called a thermopalaeomagnetic record (Crouzet 1997). In theory, such a record may allow the determination of successive T–t couples with better precisions in age and temperature than other classical geochronological methods.
The possibility of retrieving a polarity versus temperature sequence through thermal demagnetization in the laboratory requires the independence of successive partial thermoremanent magnetizations (pTRMs) and the equality, for similar cooling rates, of blocking (Tb) and unblocking temperatures. Since the studies of Thellier (1938) and Néel (1949), it has been known that single domain (SD) magnetic grains fulfil these conditions.
Previous studies (Rochette et al. 1992; Crouzet 1997; Crouzet et al. 1997) have demonstrated that the natural remanent magnetization (NRM) of the Liassic marly limestones of the Dauphinoise Zone, which is carried by pyrrhotite, consists of post metamorphic pTRMs of opposite polarities. Crouzet et al. (1997) have reported the probable SD structure of pyrrhotite using pTRM experiments. Rochette et al. (1992) suggested a comparison between TRM and NRM slopes and proposed the reversals chronology idea. If we are able to find the acquisition temperature of each pTRM, we can build a polarity sequence versus temperature. Matching this sequence with the geomagnetic polarity timescale should in principle provide ages much more precise than those that can be obtained by direct dating of the rock themselves with classical geochronological methods. The present paper will go further along this line to demonstrate the reliability of the thermopalaeomagnetic method in these rocks and put forward a robust procedure to retrieve a polarity sequence from NRM and TRM thermal demagnetization curves. As a result, a polarity versus temperature sequence recorded during the cooling of this area will be proposed. However, the correlation of this sequence with the polarity timescale, together with the geodynamic implications of these results, will be the subject of a forthcoming paper.
Geological setting
In the inner part of the Dauphinoise Zone, the Bourg d'Oisans area is of particular interest because tectonic structures are well preserved. This Liassic sedimentary sequence mainly consists of marly limestones and black shales and is regarded as the sedimentary cover of the external crystalline massif of the French Western Alps (Fig. 1). During the Alpine orogeny, the well stratified monotonous argillaceous limestones have undergone an intense and spectacular deformation that is easily observed in the landscape. A large part of the deformation is accommodated by pressure solution (Gratier et al. 1973; Vialon 1974; Gratier & Vialon 1980). The age of the regional deformation is considered to be Oligocene (Gratier et al. 1973) and is probably synchronous with metamorphism. In the studied area, metamorphism was dated by Nziengui (1993) at 26.3 ± 1.6 Ma using the K/Ar method on the < 2 µm fraction of the metasediments (mainly phyllites).
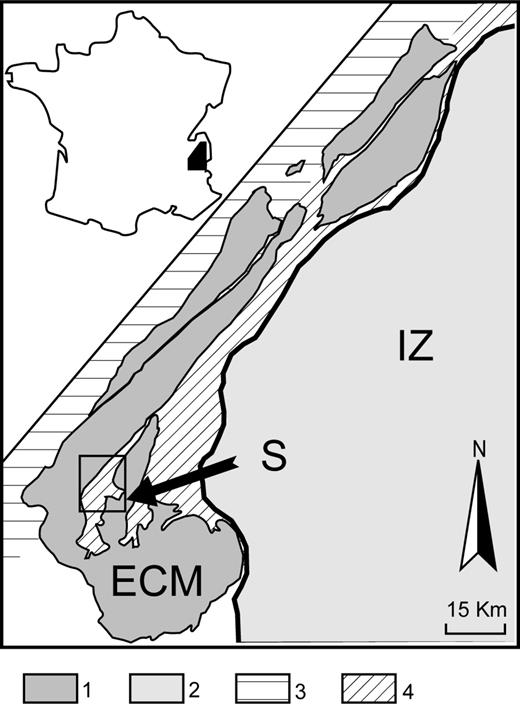
Location of the study area (S) in the western French Alps. 1: Crystalline basement of the External Crystalline Massifs (ECM); 2: internal zones (IZ); 3: sedimentary cover with occurrence of magnetite; 4: metamorphic sedimentary cover with occurrence of pyrrhotite.
The study of Jullien & Goffé 1993) on mineralogical assemblages in the Aalenian schists from the Eastern Dauphinoise Zone shows the occurrence of cookeı¨te [LiAl4 (Si3Al)O10(OH)8] and a lack of pyrophyllite [Al2Si4O10(OH)2]. This led them to propose a possible temperature for the metamorphism between 300 and 350 °C.
The origin of pyrrhotite in the inner part of the Zone Dauphinoise
Under metamorphic conditions various mechanisms and P–T conditions can result in the crystallization of pyrrhotite. The simplest reaction involves the transformation of pyrite into pyrrhotite under appropriate redox conditions (Carpenter 1974; Ferry 1981; Hall 1986; Rochette 1987). This transformation is generally assumed to occur at temperatures close to the biotite isograd (around 400 °C). However, according to Lambert (1973), in the presence of carbonates and water, this reaction could occur above 200 °C.
In the Western, non metamorphic part of the Dauphinoise Zone, pyrrhotite is not found in the marly limestones and black shale facies. In this area, the occurrence of magnetite has been demonstrated (Rochette & Lamarche 1986; Aubourg & Rochette 1992). In the Bourg d'Oisans area, pyrite and pyrrhotite coexist. The pyrite grains cross cut the main cleavage (S1) and were thus probably formed after the main deformation. The peak metamorphic temperature of 350 °C is above the Curie point of pyrrhotite (320 °C, e.g. Dekkers 1988, 1989) but is probably not sufficient to transform pyrite to pyrrhotite. According to Rochette (1987), this transformation occurs in the same facies in the Central Alps close to the Lepontine dome where the reported temperature during metamorphism was close to 550 °C (Hunziker et al. 1992). Therefore, Rochette & Lamarche (1986) and Rochette (1987) proposed that pyrrhotite derives from sedimentary magnetite. The conditions for this transformation, maturation of the organic matter and fluid circulation, seem to have been particularly favourable in Liassic black shales and limestones of the Dauphinoise Zone (Western Alps). Pyrrhotite probably appears during or just after the metamorphic event in Upper Oligocene times (Gratier et al. 1973; Nziengui 1993).
Before bedding attitude correction, the regional NRM direction is very close to the Oligo Miocene palaeofield direction, while the Liassic limestones have undergone an intense deformation with folding and a slaty cleavage. Therefore, we can conclude that the magnetization was acquired after the Oligo Miocene main syncleavage folding (Lamarche et al. 1988; Ménard & Rochette 1992; Rochette et al. 1992; Crouzet et al. 1996).
Sampling and measurements
Thanks to the good quality of the outcrops, the Bourg d'Oisans area was densely sampled (Fig. 2), especially along the roads. The distance between neighbouring sites varies from 100 m to 1 km in order to allow comparison of the magnetic behaviour from site to site. About 8 samples per site were collected. A total of about 360 samples from 54 sites were cored using a portable drill and oriented with a magnetic compass.
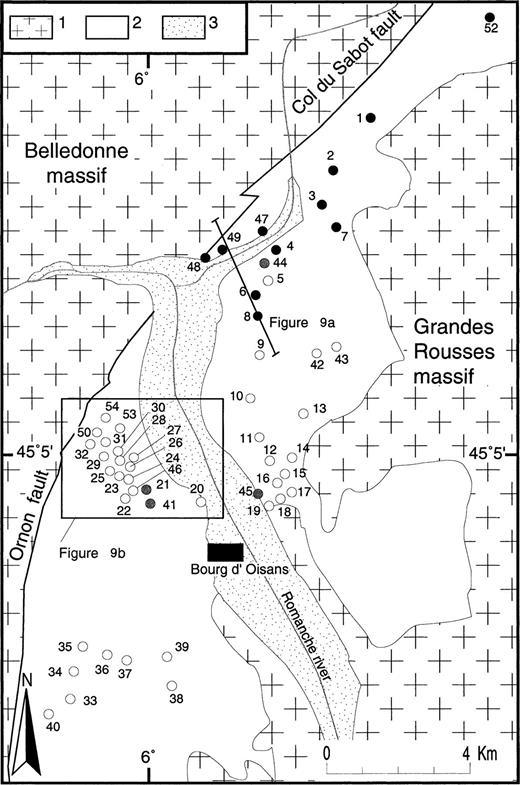
Map showing the locations of the sites in the study area. 1: Crystalline basement, 2: Mesozoic cover (mainly Liassic marly limestones), 3: Quaternary deposits. The polarity of the site after thermal demagnetization at 150 °C is indicated: white—reverse; black—normal; grey—samples of normal and reverse polarity at the same site. The location of Fig. 9 is indicated.
Isothermal remanent magnetization (IRM) was imparted in 10 samples at a 1.5 T field. Thermal demagnetization of IRM and of laboratory pTRM was carried out using a Magnetic Measurements Thermal Demagnetizer 1 oven. All these remanence measurements were made on a 2G Enterprises cryogenic magnetometer.
NRM measurements were carried out with a Molspin spinner magnetometer before and after heating at 150 °C. One or two specimens per site were selected according to intensity and directional stability. These samples were heated in steps of 5 °C between 260 and 360 °C using a classical palaeomagnetic furnace or in steps of 4 °C between 245 and 360 °C using a palaeointensity furnace. These experiments were performed under a vacuum. After each heating step, the magnetization (NRM or TRM) was measured using a CTF cryogenic magnetometer.
In the second experiment (using the palaeointensity furnace), the Coe (1967) method was used to determine simultaneously ‘NRM lost’ and ‘laboratory pTRM acquired’. The applied field was 20 µΤ during acquisition of the pTRM. The samples were always placed in the same position in the palaeointensity furnace during successive heatings but with a rotation of 180° between each step. Thus, even if the absolute temperature reached by each sample is not accurately calibrated, the temperature difference between two successive heatings can be considered to be equal to 5 °C. During all experiments, the low field susceptibility at room temperature was measured after each heating step, with a Bartington MS2 instrument to detect possible changes in magnetic properties.
The absolute temperature reached by the samples during successive heatings is known with a ±2 °C uncertainty. However, as the samples were always at the same place in the oven, the relative temperature accuracy between two successive heating steps does not exceed 1 °C. Errors in magnetization estimates could be due to (1) rapid variations of the baseline of the magnetometer, (2) variations of the magnetization of the holder, and (3) viscous remanent magnetization (VRM) acquired in the laboratory. The measurement procedure allows us to follow the decrease of the viscous magnetization in the zero field measurement region of the magnetometer. Measurements were started when the VRM had completely disappeared. We estimate the error in intensity measurement to be around 5 × 10⁻⁶ A m−1.
Results
AF demagnetization of NRM and thermal demagnetization of IRM
Two experiments were carried out in order to determine the magnetic mineralogy. (1) Alternating field (AF) demagnetization of the NRM demonstrates a very high resistance to AF, which suggests the absence of magnetite and multidomain pyrrhotite. (2) Thermal demagnetization of isothermal remanent magnetization (IRM) acquired in 1.5 T shows clearly the occurrence of only one magnetic mineral with maximum unblocking temperatures (Tub) between 285 and 325 °C, compatible with the presence of monoclinic pyrrhotite. This wide range of Tub is probably due to a thermal gradient in the MMTD 1 furnace as revealed by Ni–Cr thermocouple measurements. Nevertheless, this confirms the previous identifications of pyrrhotite in the same area and rock facies (Lamarche et al. 1988; Rochette et al. 1990, 1992; Crouzet et al. 1996; Crouzet et al. 1997).
Thermal demagnetization of the NRM and laboratory TRM
The changes in susceptibility during thermal treatment do not exceed 10 per cent. The absence of any significant variation indicates the probable stability of the magnetic mineralogy up to 335 °C.
The orthogonal demagnetization plots of NRM (Zijderveld 1967) are multicomponent between 250 °C and the maximum unblocking temperature of 325 °C (Fig. 3). Below about 200 °C, some viscous and a few goethite components were frequently found. The Zijderveld plots show several different antipodal components (Fig. 3), which are also clearly seen in the intensity versus temperature curves (Fig. 4). Assuming that the NRM in the entire collection of demagnetized samples is a stack of successive pTRMs, it is possible to extract several components from this composite signal. A first correlation between the sample signals was performed in order to recognize the prominent components. Their directions were extracted for all the samples, when they were recognized, using principal component analysis (Kirschvink 1980). Crouzet et al. (1997) have demonstrated the overlapping of all the confidence cones. This suggests that all the components share the same direction. Crouzet et al. (1996) have also demonstrated that the characteristic remanent magnetization directions coincide very well with the Miocene expected direction and become dispersed upon bedding correction; the fold test is therefore negative. Since the samples contain only one direction (with both polarities) above 250 °C, we can simply interpret the NRM intensity variations as a function of temperature in terms of normal and reverse polarities (Fig. 4). Several well individualized events highlighted by grey segments in Fig. 4 are interpreted as pTRMs. The TRM intensity decay curves of the same samples are plotted together with the NRM curves after adjusting the NRM and TRM slopes just below the Curie temperature (Tc) (see Discussion). The NRM curves of samples from the same site (i.e. site 30, Fig. 4) and from different sites (compare samples from site 30 and sample 53/2b in Fig. 4) are similar. Even small changes in intensity that do not occur at the same temperature may be correlated. This suggests that they are not an artefact due to a particular heating. Rochette et al. (1992) interpreted such curves in terms of successive normal and reversed chrons, a polarity change corresponding to a change in sign of the slope of the curves. For example, sites 41, 30, 44 and 48 would have recorded 4, 3, 2 and 1 successive chrons, respectively. However, a major problem arises when considering the parts of the M(T) curves where no changes of sign are observed but only a break in slope or plateau like behaviour. This occurs in particular at temperatures < 270 °C and at around 300 °C in samples from site 30 (Fig. 4). A clear transition from ‘up and down’ behaviour to change of slope behaviour is seen when comparing samples from sites 6 and 8 in Fig. 4. The small reversed component that can be identified in sample 6/6 in between the well recorded normal components 1 and 2 is no longer apparent in sample 8/2. However, it is still recorded in the slope decrease around 295 °C. To explain this behaviour, we can come up with several hypotheses: (1) self reversal phenomena; (2) gaps in the unblocking temperature spectra; (3) chemical origin of the NRM due to retrograde reactions during the uplift (= cooling) or chemical remanent magnetization (CRM) creation during the laboratory experiments, (4) thermoviscous remagnetization during a long stay at a peak temperature below Tc, (5) pTRMs may be not perfectly independent and reversible, and (6) antipodal pTRMs recorded over a few degrees, thus not resolved by the demagnetization resolution.
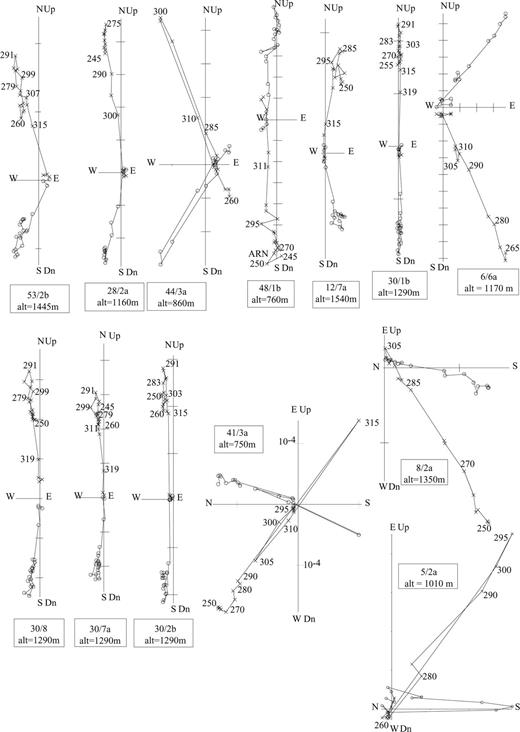
Examples of NRM demagnetization orthogonal projection showing the collinearity of all components. Specimen number and altitude are indicated. (Numbers=temperature in °C; X, O are vertical and horizontal projections, respectively; scale ticks=10−4 A m−1).

Examples of NRM thermal demagnetization intensity curves for the same samples as in Fig. 3. Corresponding laboratory TRM (B = 20 µT) demagnetization curves are also shown. To compare the two curves, the TRM is multiplied by the ratio labelled k (NRM slope divided by TRM slope). The TRM plots as a negative when the first NRM component recorded just below Tc is reversed. The slopes are calculated at temperatures just lower than Tc. Segments labelled 1–3 are used to calculate the ‘apparent palaeointensity’ (Fig. 8).
- 1
In principle, self reversals may be an alternative explanation for the NRM behaviour. In monoclinic pyrrhotite, self reversal was first observed by Bhimasankaram (1964). Self reversals are possible when two magnetic phases coexist. In this case, a self reversal occurs at a fixed ordering temperature. To explain the remarkable behaviour during thermal demagnetization of pyrrhotite from the Dauphinoise Zone, we must invoke successive self reversals that occurred at different temperatures. The occurrence of only one magnetic mineral, monoclinic pyrrhotite, in the studied samples (Crouzet et al. 1997) does not support this interpretation. The absence of magnetite and hexagonal pyrrhotite, which is ferrimagnetic between 210 and 280 °C (Bennett & Graham 1980; Dekkers 1988), together with the regular shape of TRM curves (Rochette et al. 1992; Crouzet 1997; Fig. 4) suggests that self reversal processes are very unlikely.
- 2
The comparison between NRM and TRM (Fig. 5) helps us to understand the NRM behaviour better. The TRM demagnetization curves show continuous unblocking spectra. Therefore, a gap in the unblocking spectra is excluded.
- 3
In order to interpret the observed thermal behaviour of NRM in terms of CRM, we must think in terms of CRMs acquired during different normal and reverse chrons with no overlapping blocking spectra. Moreover, the occurrence of successively normal and reversed components as a function of altitude (Ménard & Rochette 1992; Rochette et al. 1992; Crouzet et al. 1996), as predicted in the TRM hypothesis, seems incompatible with CRM. An assumed CRM overprint should have the same polarity for all samples. Fig. 4 shows that this is not the case. Therefore, the CRM scenario is very unlikely. The fact that NRM thermal demagnetization behaviour is very similar, but shifted in temperature, for samples from different sites (e.g. sites 53 and 30 in Fig. 4) cannot be accounted for by creation of CRM. Finally, pyrrhotite growth is more likely to occur during prograde or peak metamorphism than during retrograde metamorphism, which is required for the CRM hypothesis.
- 4
If a thermoviscous remanence played a role then a single polarity with very low intensity should be observed as high reversal frequency implies an average of normal and reverse directions. Moreover, just below Tc (i.e. above 300 °C) the time–temperature curves (Dunlop et al. 2000) are so steep that thermoviscous acquisition and TRM are practically identical. One should also consider that rapid cooling is inferred for the area and that conductive heating and cooling do not allow complex time–temperature paths. In fact, the ‘thermoviscous effect’ will be taken into account by the cooling rate correction discussed later.
- 5
As will be shown in the following section, pTRMs are independent to within 2 °C in the samples used for pTRM experiments. Therefore, we can assume the same for the entire collection.
- 6
The measured NRMs are therefore interpreted as the sum of pTRMs acquired during post metamorphic cooling through successive polarity chrons (Crouzet et al. 1997). However, the number of chrons used to account for the difference between the NRM and TRM curves (Fig. 4) will be much larger than suggested by Rochette et al. (1992). To support the quantitative use of NRM versus TRM intensity curves to delineate small chrons, various TRM/TRM experiments were performed.

Thellier–Thellier experiment on two successive TRMs (TRM and TRM′) showing that pyrrhotite seems to be able to record palaeointensity faithfully. Closed symbols are used to calculate the regression.
TRM/TRM experiments
In order to test the SD state of pyrrhotite grains and their ability to record successive pTRMs, several experiments were performed.
Thellier–Thellier (1959) experiments on two total TRMs (TRM and TRM′) were performed. The TRM was created in a field around 30 µT, while during the Thellier–Thellier experiment a 53.7 µT field was used to create TRM′. The good consistency of the results shows that the pTRMs are independent and that the rocks are able to record the palaeointensity without visible mineralogical changes during heating (Fig. 5).
In a second experiment, composite pTRMs were imparted to several samples in a field of 53.7 µΤ. In order to simulate polarity reversals during cooling, the experiment was carried out as follows:
- 1
heating to 350 °C in zero field and cooling in a field of 53.7 µΤ down to room temperature;
- 2
a second heating to 300 °C in zero field and cooling in a field of 53.7 µΤ, in the opposite direction to the previous field down to room temperature;
- 3
a third heating to 290 °C and cooling in a field of 53.7 µΤ with the same polarity as for the first heating down to room temperature.
A single cooling experiment with successive reversals of the applied field during cooling was attempted but it appeared that the temperature control in the samples at the time of the switch was too problematic in our palaeomagnetic oven.
Thermal demagnetization was carried out at successive steps: 100 °C, 170 °C, 230 °C, 250 °C, 260 °C, 270 °C, 275 °C, and every 3 or 4 °C up to 325 °C, then at 330 °C and 350 °C. Fig. 6 shows the results of this stepwise thermal demagnetization and the behaviour of the room temperature susceptibility after each heating step. No significant changes in susceptibility are observed. The reversed pTRM acquired between 300 and 290 °C is clearly evidenced. These experiments show that the unblocking temperature is equal to the blocking temperature. This is characteristic of SD grains (Bol'shakov & Shcherbakova 1979).
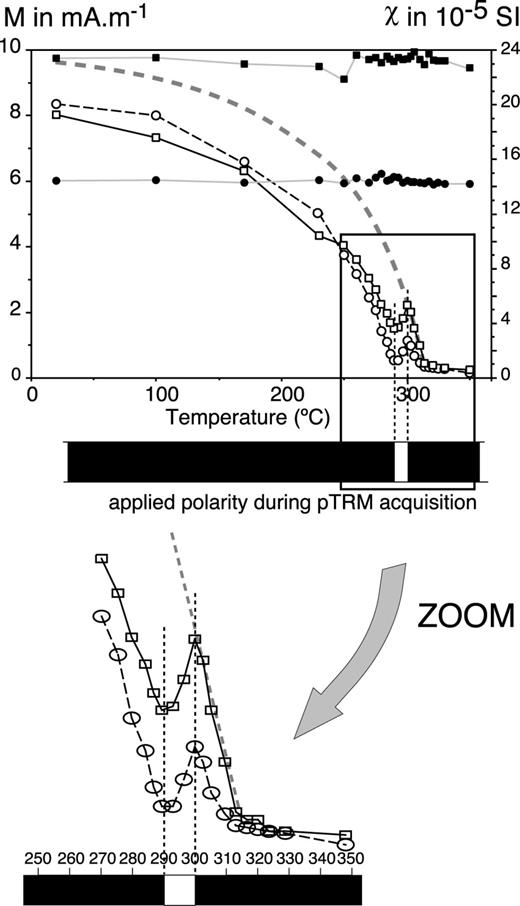
Thermal demagnetization of a composite TRM including a reversed polarity field between 300 and 290 °C from two samples (M, open symbols) and the susceptibility evolution (χ, closed symbols) showing equal blocking and unblocking temperatures.
A third experiment was carried out under the same conditions but with 11 pTRMs of different polarity. This was done in order to simulate the record of many successive magnetic polarities during very slow cooling in nature. However, this experiment does not account for the very different cooling rates in nature and in the laboratory. This point will be discussed later.
The thermal demagnetization of the 11 pTRMs, named A to K in Fig. 7, was performed using steps of 2 or 3 °C between 247 and 315 °C, and then 5 °C up to 340 °C. An estimated error of ±1 °C on the temperature actually reached at each heating step contributes to some noise on the demagnetization curve. Moreover, the intensity measured is rather weak (range 10−9−5 × 10⁻⁹), while the uncertainty is around 2 × 10⁻¹⁰ A m2. The pTRM, labelled C, recorded over 3 °C only (at ∼260 °C) is not clearly detected on the thermal demagnetization curve. There is, however, a change in the general slope around the expected temperature for pTRM C (260–263 °C). The same feature can be observed at ∼290 °C for the pTRM labelled H. In contrast, all the other pTRMs can be detected by well pronounced changes in the remanence intensity. The unblocking temperatures again appear equal to the blocking temperature within ±2 °C. These observations support our interpretation of NRM in terms of successive pTRMs of opposite polarities acquired during the slow cooling of the studied metamorphic rocks.
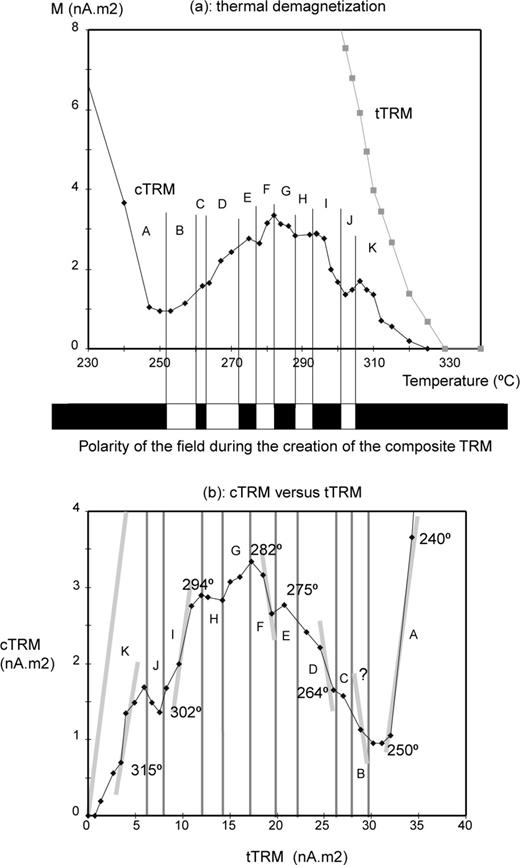
(a) Thermal demagnetization of a composite TRM including five reversed intervals acquired at the following temperatures: 305–301 °C, 293–288 °C, 282–277 °C, 272–263 °C and 260–252 °C. A good correspondence between blocking and unblocking temperatures is observed. For comparison, the ‘total’ TRM (tTRM) demagnetization intensity curve, acquired under 53.7 µT without any reversal, is shown. (b) Same composite TRM (cTRM) together with total TRM (tTRM) obtained in a Thellier–Thellier experiment.
The results of this experiment show that the samples are able to record a complex sequence of successive pTRMs, of different polarity, acquired over small temperature intervals. To test whether each pTRM previously described is able to record the palaeointensity of the applied field, a TRM was imparted by heating up to 350 °C and cooling to room temperature, without reversing the applied field, using the same rate and the same field of 53.7 µΤ as for the acquisition of the successive antiparallel composite pTRMs. A thermal demagnetization was then performed exactly as described for the thermal demagnetization of the antiparallel composite TRM (cTRM). In order to minimize the number of heatings, no pTRM checks were made. On Fig. 7(b) we plot for each heating step the cTRM versus total TRM (tTRM).
Ideally, a slope equal to ±1 is expected for each polarity recorded. For the data close to a reversal, the slope is clearly different. The existence of a distribution of relaxation times, dependent on grain size, implies that the magnetization blocking is not instantaneous but occurs over a temperature interval (ΔTb) that is typically < 5 °C (Dodson & McClelland Brown 1980, 1985). For this reason, the ideal slope cannot be reached for the smaller chrons. Taking into account an error of ±1 °C in the temperature reached during each step of heating and an error of ±2 × 10⁻¹⁰ A m2 in TRM intensity values, the data are compatible with the expected ideal slope for chrons A, B, D, F, I and K. This suggests that pTRMs may be used to determine palaeointensity, provided the temperature interval during which the field is constant exceeds 5–7 °C and enough data points are available to determine it statistically.
Discussion
In order to interpret the NRM demagnetization curves, the ratio (k) of NRM and TRM slopes was calculated on temperature intervals with well defined chrons (1–3), defined by at least two measured points and outlined in Fig. 4.
Fig. 8 shows the k values multiplied by the intensity of the laboratory applied field during the TRM acquisition. These ‘apparent palaeointensity’ values (mean=9.5±2.9 µΤ) are very similar to those obtained by Rochette et al. (1992) using the maximum NRM slope just below Tc. These very low values are probably not a good estimate of palaeointensity of the geomagnetic field because of various possible causes for bias including very slow cooling rate, NRM acquisition at high pressure and poor line fits. However, the coherence of ‘apparent palaeointensity’ values found throughout the temperature range of Fig. 8 is a further check of the validity of our interpretation of NRM in terms of pTRM.
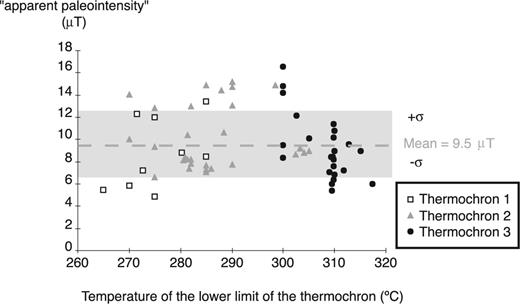
Plot of the apparent palaeointensity values obtained on individual samples for different chrons as a function of recording temperature, together with overall mean value (= 9.5 µΤ) and standard deviation (=2.9 µΤ).
Taking into account the mean value of apparent palaeointensity and the TRM decay curve, it is possible to calculate the theoretical slope of the NRM at each temperature for a given sample. This allows us to interpret the NRM demagnetization curve in terms of successive pTRMs (Fig. 9). Obviously, chrons 1–3 defined in Fig. 4 do show several measured values on the predicted slope. However, we must introduce several small events (=small pTRM) in order to fit the measurements data points.
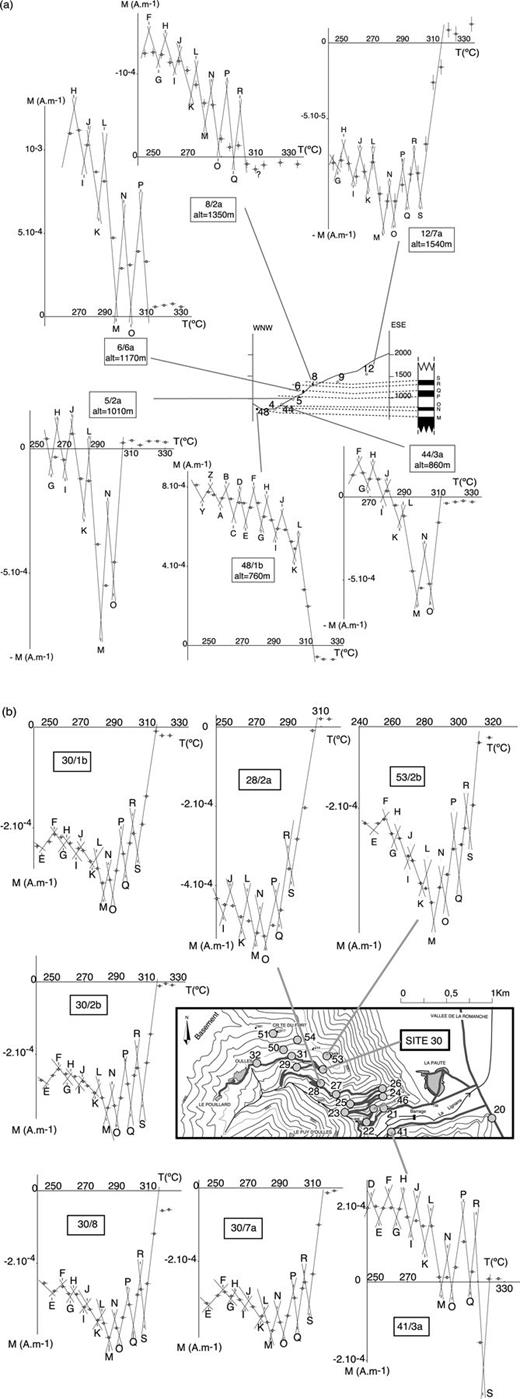
Interpreted NRM demagnetization curves (same samples as in Figs 3 and 4) using the comparison NRM/TRM and the criteria discussed in the text, showing in (a) a general trend versus elevation and in (b) a good consistency between neighbouring sites. X error bars correspond to thermal uncertainty and Y error bars correspond to intensity measurement error estimation. Graph with no Y error bars mean that the Y error bars are smaller than the size of the data point.
The following steps were used to determine the number and interval of unblocking temperatures of each pTRM.
(1)As only one or two samples per site were used for the fine thermal demagnetization, we used site 30 as the starting point because nine samples were treated. A first polarity sequence was derived using all the samples of site 30. A correlation between the signals of all the samples was attempted. Small pTRMs are introduced in order to build exactly the same reversals sequence for all the samples. The variation in the length of each pTRM from neighbouring samples was minimized as well as the number of reversals recorded.
(2)A precise correlation between the signal of neighbouring sites was attempted. This correlation was made with the same constraints as for building the site 30 reversals sequence. When looking at a new sample (i.e. the nth sample), it was not always possible to fit its curve to the previous sequence established on n − 1 samples. In such a case, all the n − 1 sample interpretations were reassessed with the smallest change possible in order to take into account the information of the nth sample. No mathematical functions fitted the previous constraints. Therefore, this work was undertaken by hand. Taking into account all the constraints previously described, it was not easy to find a solution for all the samples. Then, even if several solutions were in theory possible, the geologically most realistic was chosen.
These correlations were made assuming possible errors discussed previously. With these criteria, a few small chrons covering only 2 or 3 °C have to be introduced (Fig. 9). Those small events probably cannot be evidenced by changes in the sign of the NRM slope because of several factors: (1) the sampling steps of 4 or 5 °C are too large, and (2) even if we use steps of 2 °C for thermal demagnetization, the magnetic grains are not able to record a change in the slope due to a filtering process (see reversal C in Fig. 7). This filtering process could be due to (1) the width of the blocking thermal interval of the magnetic grains, (2) the cooling rate, and (3) gaps in the grain size distribution. Looking at the TRM thermal demagnetization behaviour, the grain size distribution seems quite homogeneous. The combination of (1) and (2) implies that small events are not recorded. For example, taking into account that one grain acquired its magnetization over 3 °C and undergoes a cooling rate of 30 °C Myr−1, events shorter than 100 kyr cannot be recorded anyway. Magnetochrons spanning 150 kyr should then be recorded over 5 °C but grains that acquired their magnetization at this time would also be submitted to the normal field during their blocking thermal interval, so the resulting signal would not be perfect (change in the sign of the NRM slope) but rather would show plateau like behaviour. Therefore, Fig. 9 must be regarded only as a geometric construction in order to attempt to retrieve the temperature of each reversal. It should be kept in mind that the other very important point in making this interpretation is the correlation between neighbouring samples, which gives important constraints.
The overall interpretation of the NRM thermal demagnetization at all sites allows us to define the unblocking temperature of successive reversals in a composite polarity sequence with a precision approaching a few degrees. Due to the fact that the various samples acquired their magnetization at different times, this correlation leads to a composite sequence of 21 reversals labelled Y to S. The synthetic sequence is reported in Table 1. As a given reversal is recorded at various temperatures depending on the location of the sample, we must choose a site and a reference reversal in order to define an ‘absolute’ temperature. This is site 30 located at 1290 m altitude, of which nine samples were treated. The reference reversal is the first one recorded by the nine samples, that is, the highest temperature one (reversal labelled S). For those nine samples, the mean temperature for this reversal is 308 °C. The laboratory unblocking temperature of each reversal at site 30 (Table 2) is derived from Table 1. This sequence of reversal temperature may be used to obtain a set of T–t pairs by correlating the sequence with the global polarity timescale using variable cooling rates. The coherence of a synchronous temperature map (for reversal M) in terms of vertical and horizontal temperature gradients has been demonstrated by Crouzet et al. (1999).
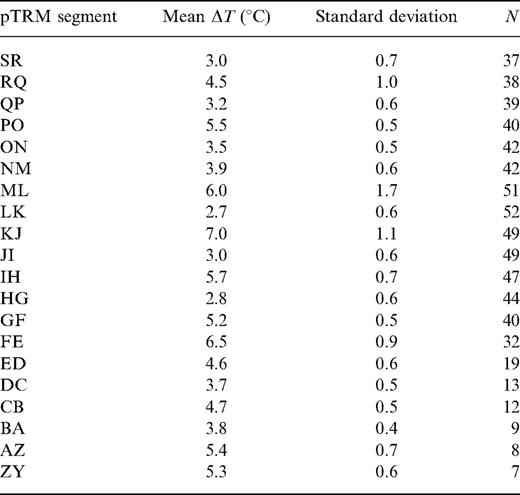
Mean thermal range of natural pTRMs (in °C) for the entire collection of treated samples deduced from the NRM thermal demagnetization interpretation (Fig. 9). Standard deviation and number of samples used (N) are indicated. See text for more details.
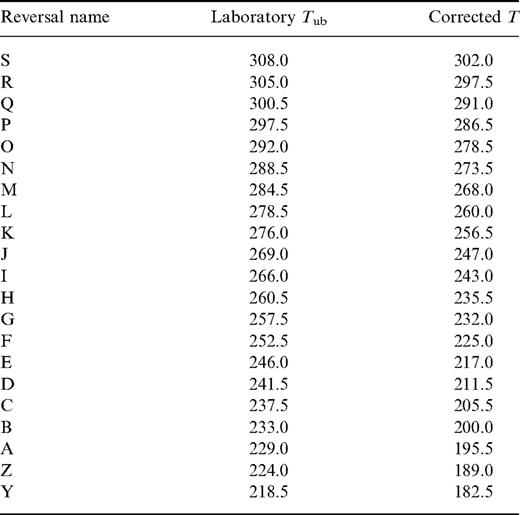
Laboratory unblocking temperatures (°C) and inferred geological blocking temperatures (°C) for all the reversals. The laboratory unblocking temperature is deduced from the temperature of reversal S at site 30 and data from Table 1. The geological blocking temperature is derived from the laboratory unblocking temperature according to Crouzet et al. (1999) (1999).
However, further data treatment is necessary to obtain unbiased palaeotemperatures. Indeed, the laboratory unblocking temperatures are larger than the natural blocking temperatures because of the difference in cooling rates. In order to establish a correction, we must use the temperature dependence of SD relaxation time τ derived by Néel (1949) and discussed by Pullaiah et al. (1975) and Dunlop et al. (2000). Assuming a natural cooling rate of 30 °C Myr−1 (i.e. 10−12 K s−1), the natural blocking temperature can be estimated (Table 2). The sensitivity of this correction, which varies from 0 at Tc to 37 °C for the youngest reversal (at 220 °C), to a change of natural cooling rate is negligible in the geologically realistic 10–100 °C Myr−1 range. See Crouzet et al. (1999) or Dunlop et al. (2000) for a complete development of this correction.
Conclusions
The thermomagnetic experiments reported in this paper confirm that the NRM of Liassic marly limestones and black shales of the inner part of the Zone Dauphinoise have recorded successive magnetic polarity chrons during slow cooling during the Miocene. This conclusion is supported by the presence of antiparallel components of NRM within each rock sample, the similarity of the NRM(T°) curves for samples from the same site, and the logical evolution of these curves when samples from sites with different elevations are compared. Furthermore, the experiments carried out on laboratory TRMs show that blocking and unblocking temperatures are the same and that pTRMs are independent of each other. These properties, which are essential for the present study, are due to the presence of SD pyrrhotite as a magnetic carrier.
A method based on the comparison between NRM and TRM on the same sample is proposed in order to interpret the NRM intensity versus temperature curve behaviour. Thanks to a precise correlation between neighbouring samples (or sites), it is possible to establish a synthetic reversal sequence versus temperature.
It is possible in principle to determine the ages of magnetochrons Y to S by comparing the thermopalaeomagnetic sequence (Table 2) and the global polarity timescale. If we are able to perform this comparison, temperature/age pairs are established with a precision better than any other classical geochronological method. This may also determine the cooling rate. This correlation and geological applications will be developed in a forthcoming paper. We propose to use the thermal recording of polarity reversals during slow cooling of metamorphic rocks as a new geochronological method: thermopalaeomagnetism. Provided that magnetization is thermoremanent and carried by SD grains, it allows a completely new and independent approach to the thermal and tectonic events associated with the late evolution of a mountain belt.
Acknowledgments
Michel Prévot is deeply thanked for giving us access to the Montpellier palaeomagnetic laboratory, and for discussions about data interpretation. The manuscript was greatly improved with the help of E. McClelland, M. J. Dekkers and P. Camps. We thank R. Enkin and F. Heller for very helpful reviews. This study was supported by the programme INSU DBT ‘Fluides dans la croûte’.
References
