-
PDF
- Split View
-
Views
-
Cite
Cite
Karsten Gohl, Gabriele Uenzelmann-Neben, The crustal role of the Agulhas Plateau, southwest Indian Ocean: evidence from seismic profiling, Geophysical Journal International, Volume 144, Issue 3, March 2001, Pages 632–646, https://doi.org/10.1046/j.1365-246x.2001.01368.x
Close - Share Icon Share
Summary
Its key geographical position near the reconstructed centre of the Gondwana break-up between Antarctica, South America and Africa has brought attention to the Agulhas Plateau, an oceanic plateau in the southwest Indian Ocean, with regard to its crustal nature and origin. The majority of previous studies have suggested a dominantly continental origin. As part of the project SETARAP (Sedimentation and Tectonics of the Agulhas Ridge and Agulhas Plateau), we conducted an extensive seismic survey over the plateau with the aim of solving the questions about its crustal structure, origin and role in a plate tectonic reconstruction context. In addition to 1550 km of high-resolution seismic reflection profiles, we recorded deep-crustal large-offset and wide-angle reflection/refraction data from an ocean-bottom hydrophone (OBH) profile across the southern plateau. The reflection data show clear indications of numerous volcanic extrusion centres with a random distribution. We are able to date this phase of voluminous volcanism to Late Cretaceous time, a period when numerous other large igneous provinces formed. Traveltime inversion of the deep-crustal OBH records reveals an up to 25 km thick crust with velocities between 7.0 and 7.6 km s−1 for the lower 50–70 per cent of its crustal column. We do not find indications for continental affinity but rather a predominantly oceanic origin of the Agulhas Plateau, similar to that inferred for the Northern Kerguelen and Ontong–Java plateaus. In Late Cretaceous time, its main crustal growth was controlled by the proximity of spreading centres and by passage over the Bouvet hotspot at 80–100 Ma.
1 Introduction
The Agulhas Plateau is an oceanic plateau in the southwest Indian Ocean that covers an area of more than 300 000 km2 and rises about 2.5 km above the surrounding ocean floor(Figs 1 and 2). Since the first mapping of its morphology by Heezen & Tharp (1964), the plateau has been the target of a number of geoscientific investigations aiming to resolve its geological–tectonic structure and origin. Early studies by Heezen & Tharp (1964), Scrutton (1973), Barrett (1977) and Tucholke & Carpenter (1977) revealed regional differences in the relief of the seafloor and the acoustic basement, with the northern plateau exhibiting an irregular basement morphology while the basement of the southern plateau is rather smooth. Tucholke . (1981) also recognized areas of irregular basement along a 30–90 km wide zone trending south-southwest and in other smaller areas within the smooth basement region. While the rough basement topography and indications of high velocities from a few seismic refraction data from the northern plateau suggest an oceanic origin (Barrett 1977; Tucholke . 1981), the discussion on the evolution of the southern plateau has been more controversial. Dredged samples of quartzo-feldspathic gneisses and sparse seismic refraction data gave reasons to suggest that the southern plateau is of continental origin (Allen & Tucholke 1981; Tucholke . 1981). Ocean Drilling Project (ODP) data at the Northeast Georgia Rise, however, led to the suggestion of an equivalent evolution of this rise and the Agulhas Plateau, and thus an oceanic origin for the plateau (Kristoffersen & LaBrecque 1991). A key to the answer is knowledge of the deep structure and thickness of the Agulhas Plateau and therefore its origin, which has remained an enigma mainly due to the lack of seismic data from the lower crust and crust–mantle boundary. Analyses of geoid and gravity anomaly data across the plateau suggested a crustal thickness ranging from 12 km (Angevine & Turcotte 1983) to 21–23 km (Graham & Hales 1965; Ben-Avraham . 1995), but the lower boundaries of these models could not be constrained by seismic information. These estimates are not indicative of either continental or oceanic crust, although Ben-Avraham . (1995) argued for a thinned continental crust beneath the southern plateau. In comparison, large magnetic anomalies mapped from profiles across the plateau (Le Pichon & Heirtzler 1968; Barrett 1977) as well as the dominant MAGSAT anomaly over the region (Antoine & Moyes 1992) have been used as an argument for an oceanic origin.
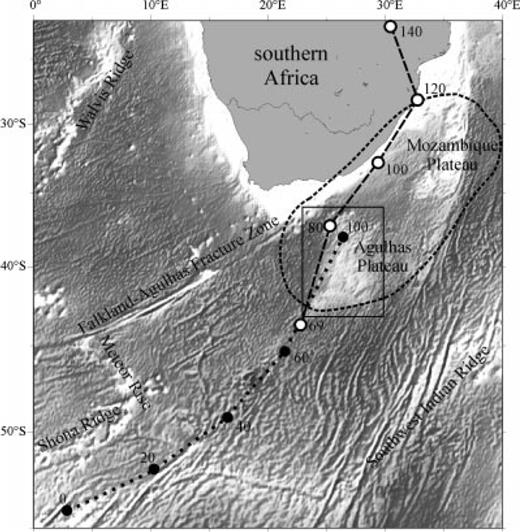
Overview of present geodynamic features of the southeast Atlantic and southwest Indian Ocean region. The positive Agulhas MAGSAT anomaly (short-dashed line) covers most of the region over the Agulhas and Mozambique plateaus (Antoine & Moyes 1992). The Bouvet hotspot track is shown according to the coordinate/time reconstructions (Ma) of Hartnady & le Roex (1985) (dotted line and black dots) and Martin (1987) (long-dashed line and white dots). The box indicates the area of the Agulhas Plateau shown in Fig. 2. Bathymetry is derived from the Smith & Sandwell (1997) 2′ × 2′ satellite data set.
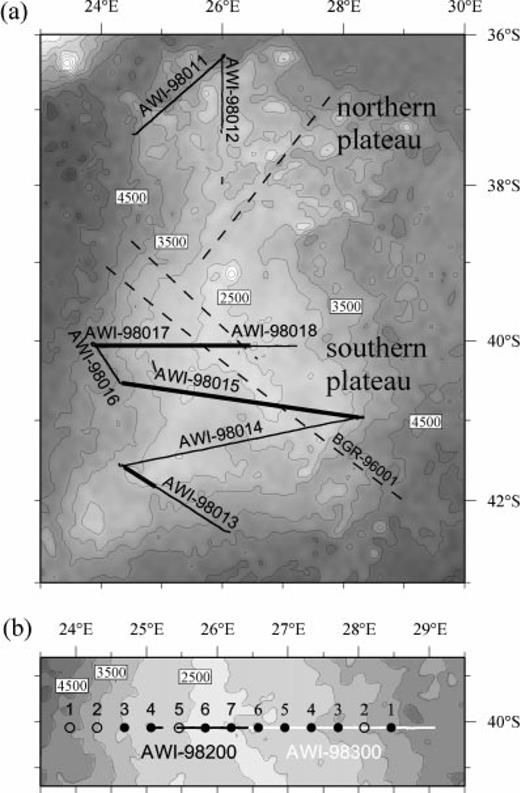
(a) Bathymetry map of the Agulhas Plateau with locations of SETARAP seismic reflection lines (solid) and existing seismic profiles (dashed) acquired by Tucholke . (1981) and by BGR (K. Hinz, unpublished data). Profiles shown in this paper are marked with bold solid lines. (b) Locations of the two wide-angle reflection/refraction shot profiles (black and white lines) with OBH stations (solid circles). The open circles indicate OBHs that recorded no useful data. The bathymetry is derived from the Smith & Sandwell (1997) 2′ × 2′ satellite data set. Bathymetric contour interval is 500 m.
Investigation of the origin and composition of the Agulhas Plateau is important because of its key geographical position at or near the reconstructed centre of the Gondwana break-up between Antarctica, South America and Africa (e.g. LaBrecque & Hayes 1979; Lawver . 1985; Martin & Hartnady 1986). Whether the plateau (or segments of it) existed as part of the continent prior to break-up or was created by magmatic events during the break-up and subsequent rifting, or whether it is dominantly a product of accreted and extruded material due to the passage over one or more mantle hotspots are questions under current debate. Another aspect is its possible role as part of the worldwide suite of large igneous provinces (LIPs) (Coffin & Eldholm 1994).
As part of the project ‘Sedimentation and Tectonics of the Agulhas Ridge and Agulhas Plateau (SETARAP)’, we acquired seismic reflection and deep-crustal refraction data across the Agulhas Plateau (Fig. 2) in early 1998 to address these questions. A first analysis of the reflection data and the ocean-bottom hydrophone (OBH) recordings provided preliminary estimates of the distribution and extent of volcanic extrusion centres, and revealed first estimates for the deep-crustal structure and composition (Uenzelmann-Neben . 1999). A thorough analysis of both seismic data sets and gravity anomalies allows us to construct a structural framework of the southern plateau and to place constraints on its crustal role in the post-Gondwana break-up scenario.
2 Geological-tectonic setting of the agulhas plateau
The tectonic history of the present southern Atlantic and southwestern Indian Ocean region in the context of Gondwana break-up and the subsequent seafloor spreading has been complex, which complicates defining the role the Agulhas Plateau played in a plate tectonic reconstruction. Significant movement (> 1200 km), associated with the separation of South America from Africa, occurred along the Falkland–Agulhas fracture zone, which is the dominant tectonic feature of the area north of the Agulhas Plateau (Fig. 1). Tucholke . (1981) associated the changes in relative plate motions with a series of ridge jumps based on the geometry of magnetic anomaly lineations and other geophysical constraints. The formation of a ridge–ridge–ridge (RRR) triple junction between the African, South American and Antarctic plates about late Albian time, centred on the northern end of the Agulhas Plateau, has been suggested as being responsible for the formation of the rugged morphology of the crust in that region (Tucholke . 1981; Martin & Hartnady 1986). The RRR triple junction has also been suggested as the cause of the narrow zone of irregular basement that trends south-southwest across the southern Agulhas Plateau (Tucholke . 1981).
The reconstruction of microplates in the southern Atlantic region places the eastern margin of the Falkland Plateau adjacent to the Maurice Ewing Bank by rotation of the South American continent back to its original pre-drift position against the African continent (LaBrecque & Hayes 1979; Martin & Hartnady 1986; Marshall 1994). If the crust of the present southern Agulhas Plateau existed before the Gondwana break-up, it was probably situated adjacent to the Mozambique Ridge and south of the Falkland Plateau at around 130 Ma (chron M10). Allen & Tucholke (1981) and Tucholke . (1981) used the recovery of low- to high-grade metamorphic gneisses of quartzo-feldspathic composition, dredged from exposed basement, as evidence for continental crust in the southern Agulhas Plateau. One sample has a K–Ar age of about 1100 Myr (Allen & Tucholke 1981) and might be associated with the Namaqualand–Natal belt of South Africa (900–1200 Ma), the Falkland Islands (900–1200 Ma) and the Haag Nunataks of East Antarctica (1000 Ma). Another sample was K–Ar dated at 480–500 Myr and is comparable in age and composition to gneisses of the southern African Damara orogen, which formed a belt continuous with the Beardmore and Ross orogens in Antarctica. Both samples were collected from the western edge of the plateau, which is generally regarded to have been adjacent to the Falkland Plateau before the break-up. Metamorphic rocks were not unique to the dredge samples. A large number of samples of extrusive and intrusive, mafic to felsic igneous rocks were also recovered (Allen & Tucholke 1981).
Significant thermal events affecting the formation of the Agulhas Plateau have been associated with the Agulhas MAGSAT anomaly (Antoine & Moyes 1992). This very pronounced high-amplitude (up to 6 nT) satellite magnetic anomaly is situated off the southeast coast of southern Africa and includes the area of the Agulhas Plateau and Mozambique Ridge (Fig. 1). The anomaly has been related to a thermoremanent magnetization acquired during the Cretaceous quiet period (Fullerton . 1989) and is interpreted as being caused by magmatic events during a period between the beginning of Gondwana fragmentation and the early Cretaceous (Antoine & Moyes 1992). Antoine & Moyes (1992) further associated the magnetization contrast of the area under the anomaly with either thickened oceanic lithosphere or a remnant signature of a lithosphere above hotter than normal asthenosphere that initiated the Gondwana break-up in this region.
At least one mantle hotspot had significant thermal influence on the southern African region. The 120–80 Ma section of the Bouvet hotspot track follows the Agulhas margin of South Africa (Fig. 1), the sheared margin between Africa and the Falkland Plateau (Martin 1987). At approximately 80–100 Ma, the Bouvet hotspot was centred beneath the northern tip of the Agulhas Plateau and may have provided a source of volcanism (Hartnady & le Roex 1985; Martin 1987).
Evidence for recent, possibly Quaternary, tectonic activity has been found in the northeastern Agulhas Plateau and Mozambique Ridge, which are underlain by relatively young, possibly post-Pliocene, volcanic intrusions (Ben-Avraham . 1995). The intrusive bodies cross-cut seismic reflectors, interpreted as Oligocene sediments, and deform overlying sediments of Miocene and Pliocene age.
3 High-resolution seismic reflection data
3.1 Data acquisition and processing
We acquired six high-resolution seismic reflection profiles of 1550 km total length on the southern Agulhas Plateau in 1998 (Fig. 2a). Two GI-guns™ were fired at a nominal interval of 37.5 m, generating reflection signals with recorded frequencies of up to 220 Hz. Each GI-gun™ was fired from a generator chamber of 0.7 l volume to generate the signal, while firing of pressurized air of an injector chamber of 1.7 l volume was delayed to suppress the bubble effect. This provided a vertical resolution of approximately 3.5 m. The data were recorded with a 96-channel, 2700 m long streamer with a 2400 m active section.
Pre-stack processing of the multichannel seismic data comprised geometry definition for common depth-point (CDP) processing (CDP interval 25 m), spherical divergence correction, bandpass filtering, CDP sorting, trace-editing, and a detailed velocity analysis on every 100th CDP. The derivation of the stacking velocities from the normal move-out is accurate to within about 10 per cent. The velocity field distinctly shows the transition from sedimentary rocks (values of 2800 m s−1 and lower) to lava flows and basement (values between 3500 and 5000 m s−1). Stacking was followed by a finite-difference omega-x migration. This method was especially useful in regions with heavily inclined reflectors, for example, for those possibly caused by volcanic flows. As no gain function (e.g. AGC) was applied, the amplitudes in the profiles shown represent values relative to the maximum of the entire section.
3.2 Excessive volcanism
The seismic reflection data show that the southern Agulhas Plateau is characterized by a large number of basement highs of circular appearance interpreted as extrusion centres that are distributed randomly and do not follow a ridge or spreading-axis trend. Dipping reflectors emerge from the extrusion centres (Figs 3 and 4). These reflections can be followed for several kilometres, with some being up to 15 km long (Fig. 3). They overlap and form subparallel stratified sequences. Those structural characteristics and a rise in interval velocity from less than 2800 m s−1 (indicative of sedimentary layers) to values of 3500 and up to 5000 m s−1, derived from velocity analyses of CDP gathers, led to the interpretation of the flow-like reflections as volcanic flows. Similar dipping reflections are observed on seismic line BGR-96001 (location in Fig. 2) and are interpreted as a thick volcanic sequence emplaced during the Cretaceous magnetic quiet zone due to their location relative to magnetic anomaly 34 (K. Hinz, personal communication, 1996). The Kerguelen Plateau, a volcanic structure in the southern Indian Ocean, is also characterized by basement highs and dipping flow-like reflections, which Schaming & Rotstein (1990) traced back to hotspot volcanism superimposed on an active spreading ridge.
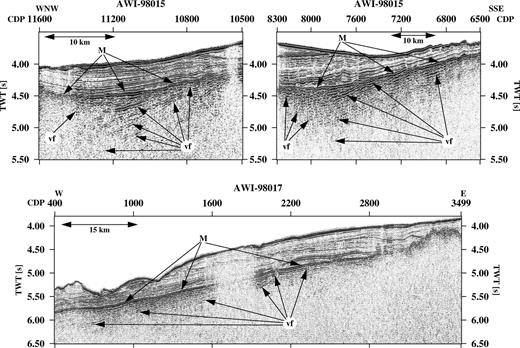
Three examples of flow-like reflections emerging from extrusion centres, which are interpreted as volcanic flows. The reflections form subparallel stratified sequences and can be followed for up to 15 km. M: reflector Maastrichtian; vf: volcanic flow. Profile locations are marked in Fig. 2(a)).
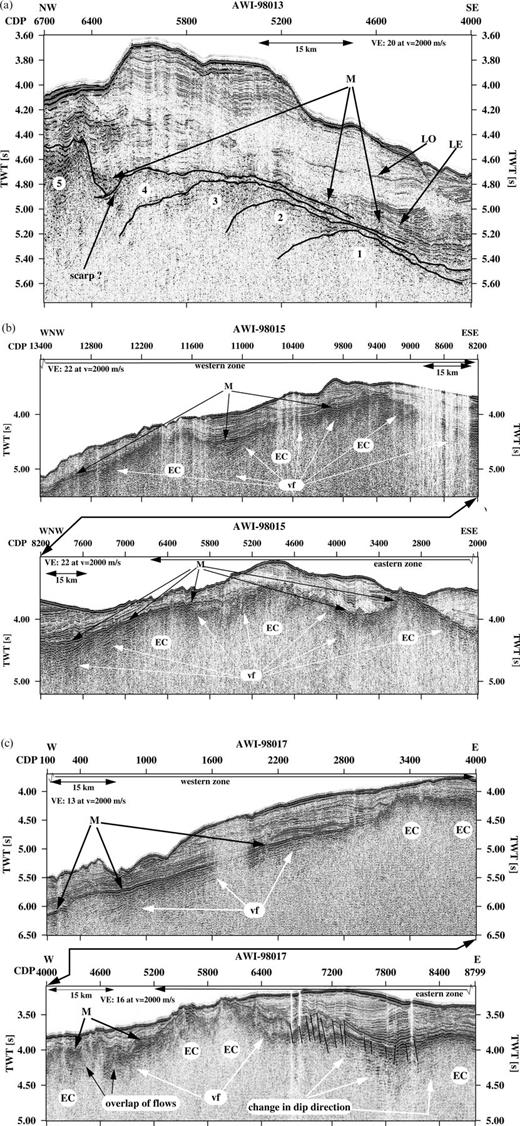
SETARAP seismic reflection data from profiles (a) AWI-98013, (b) AWI-98015 and (c) AWI-98017 showing volcanic flows emerging from extrusion centres (EC). LE: Lower Eocene; LO: Lower Oligocene; M: Maastrichtian; vf: volcanic flow. Note the change in dip direction of the volcanic flows on line AWI-98017. The numbers in (a) indicate the stages of subsequent extrusion centre build-up.
Due to a lack of seismic energy, it was not possible to resolve the base of the volcanic flows, but they form suites that are at least 2.5 km thick (observed over 1 s two-way traveltime and using vP = 5 km s−1, derived from velocity analysis of CDP gathers). Considering the area covered by seismic reflection lines that exhibit flow-like structures and a minimum thickness of 2.5 km for the volcanic flows, the minimum amount of material extruded is found to be 150 000 km3. As this takes into account only the volcanic flows and not acoustic basement material, the Agulhas Plateau falls well within the classification of a LIP such as the Etendeka province (e.g. Milner . 1992). Mid-ocean ridge volcanism as the primary mechanism for formation is unlikely because the mapped extrusion centres do not form an elongated structure such as a ridge or spreading axis as observed on the Kerguelen Plateau (Schaming & Rotstein 1990).
The volcanic flows themselves have not been sampled, but Tucholke & Carpenter (1977) cored the sedimentary rocks lying directly on top of the flows. At the sediment–flow interface, an erosional unconformity was created between Cenomanian and Maastrichtian times (about 92–67 Ma). Since the sedimentary layers appear to be little affected by the volcanism, we infer that the volcanism took place prior to the onset of sedimentation.
The vast amount of volcanic material appears to have been extruded within the short period between formation of the northern Agulhas Plateau and the onset of sedimentation. This is evident from the non-disruptive stratigraphy of the sedimentary layers (Figs 4b and c). Only in three locations did we find slight evidence for renewed synsedimentary volcanic activity. There, the sedimentary layers are bulged and disturbed by basement mounds. In another location, an extrusion centre pierces the lava flows of an older extrusion centre and the sedimentary layers and breaks through the seafloor. This indicates a more recent period of renewed volcanic activity. This latter extrusion centre can be found on the southern plateau (seismic line BGR-96001, K. Hinz, personal communication, 1996) near a set of faults on seismic line AWI-98017 (Fig. 4c).
Generally, two zones of extrusion centres can be distinguished: a western zone that lies deeper than an eastern one(Figs 4b and c). Towards the centre of the plateau the two zones merge. On the southern plateau, it can be clearly seen that the flows of the western extrusion centres overlap the flows emerging from the eastern extrusion centres(Figs 3 and 4b and c). This suggests that the western zone comprises younger extrusion centres. Since the extrusion centres of the western zone were not built up as high as the extrusion centres of the eastern zone, we infer that a secondary phase of the excessive volcanism did not produce as much material and, thus, can be considered to have been weaker.
In some places, the extrusion centres show a build-up via several stages (Fig. 4a). There, different smaller individual centres can be differentiated whose flows overlap and become shallower and seem to move into one direction. This indicates a relocation of the extrusion centre during formation, probably as a result of the plateau's separation process from Maud Rise.
Around 93 Ma, a phase of extensive volcanism formed the northern oceanic part of the Agulhas Plateau (Martin & Hartnady 1986; Ben-Avraham . 1995), thereby causing wedges of seaward-dipping reflectors on the western and central plateau (K. Hinz, unpublished data). Similar structures were observed on the Maud Rise, a plateau-like feature off Dronning Maud Land, Antarctica, and discussed as the conjugate margin of the Agulhas Plateau (Martin & Hartnady 1986). Ocean Drilling Program (ODP) Leg 113, Site 690, gave further evidence for a volcanic phase on the Maud Rise by recovering alkali basalts (Shipboard Scientific Party 1988). These basalts are generally associated with the construction of oceanic islands. We suggest that the extrusion centres and volcanic flows are the result of a period of excessive volcanism, which was initiated after the initial formation of the northern Agulhas Plateau (93 Ma) and prior to the onset of sedimentation in the Late Cenomanian. This volcanism is associated with the separation of the Agulhas Plateau and the Maud Rise, a process completed by 95–90 Ma (Martin & Hartnady 1986; Kristoffersen & LaBrecque 1991).
4 Deep-Crustal Structure And Composition
4.1 Ocean-bottom hydrophone recordings
The data used to derive a geophysical model of the Agulhas Plateau consist primarily of seismic refraction and wide-angle reflection records from OBH systems. Two adjacent in-line profiles (AWI-98200 and AWI-98300) were shot across the centre of the plateau coincident with the reflection lines AWI-98017 and AWI-98018 (Fig. 2b). The seismic source consisted of a single 60 l sleeve airgun (Russian-made model PS100) with a working pressure of 10 MPa at a water depth of 15 m fired every 60 s, resulting in a shot spacing of approximately 150 m. Airgun signals were recorded by seven and six OBH systems (type GEOMAR-OBH) along profiles AWI-98200 and AWI-98300, respectively, with a nominal OBH spacing of 32 km. For each OBH, signals were recorded via a single hydrophone onto four channels with different gain factors and at a sample rate of 100 Hz. Due to severe weather, the western profile (AWI-98200) could not be shot to completion, thus resulting in a combined profile length of 375 km with observable data.
Data processing of all OBH records involved bandpass filtering between 4 and 17 Hz. Large-offset records were filtered with a bandpass between 3 and 7 Hz and a dip filter to remove the wrap-around of the direct water-wave arrivals from the preceding shots. First P-wave arrivals were recorded at source–receiver offsets of up to 115 km for profile AWI-98200 (Fig. 5a) and 120 km for profile AWI-98300 (Fig. 5b). Their lowest observable apparent velocities range from 4.5 to 5.4 km s−1 at offsets smaller than 20 km. Arrivals between 20 and 50 km offset have apparent velocities from 5.5 to 6.5 km s−1 and up to 7.0 km s−1 in some records. Velocities range from 6.7 to 7.5 km s−1 for offsets up to 70 km. We do not observe any mid-crustal reflections, but the traveltime–distance data of large-amplitude arrivals at offsets between 40 and 100 km, and up to 150 km in some records, suggest that reflections from the crust–mantle boundary, or Mohorovičič (Moho) discontinuity (PmP phases), are recorded at most OBH stations. Records OBH-5 and OBH-6 of profile AWI-98300 contain first P-wave arrivals at offsets between 70 and 120 km with apparent velocities of 8.0–8.1 km s−1, indicative of upper mantle refractions (Pn). These arrivals are in part better identified by their water-bottom multiples (Fig. 5c).
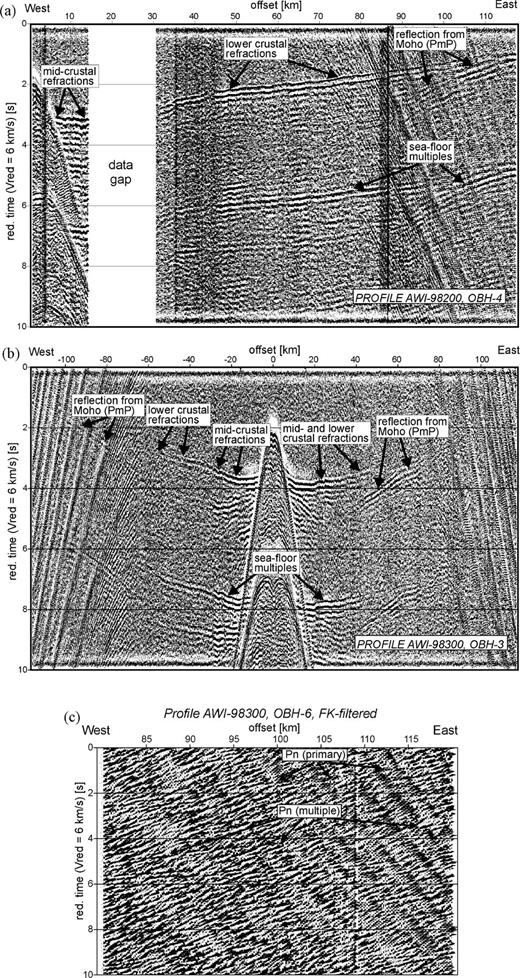
(a) Record OBH-4 of shot profile AWI-98200 and (b) record OBH-3 of shot profile AWI-98300. Note that refracted and reflected arrivals appear to be more visible in the first seafloor multiple. The steeply dipping arrivals at large offsets are wrap-arounds of direct water-wave arrivals from preceding shots. (c) Large-offset window of coherency-filtered data from OBH-6 (AWI-98300), which shows a Pn phase from the upper mantle well preserved in its first multiple. All sections are plotted with a 6 km s−1 reduction velocity.
4.2 Seismic modelling procedure
1-D traveltime inversion estimates provided the initial parametrization for 2-D ray tracing and a generalized linear traveltime inversion scheme (Zelt & Smith 1992). In the 1-D models, it became apparent that P-wave velocities increase rapidly within the upper crust and exceed 7 km s−1 at 8–12 km below seafloor (bsf) under the southern plateau. For the 2-D modelling process, we included refraction and reflection traveltime arrivals with picking uncertainties corresponding to the data quality of the respective seismic phases. Phase picking uncertainties lie between 70 and 100 ms. In order to accommodate the spatial sampling corresponding to the OBH station intervals and seismic phase coverage, the initial 2-D model was parametrized as a trapezoidal grid with a 25 km horizontal spacing of distance–depth–velocity nodes below the seafloor. The initial modelling process commenced with a total of nine layers, of which layer 1 is the water column with a velocity of 1.49 km s−1 and water depths derived from the coincident seismic reflection profiles. Dominant direct water wave arrivals appear as first arrivals at offsets smaller than 5 km, thus preventing a clear observation of refraction arrivals from the uppermost sedimentary layers. We therefore used the depth and interval velocity information from the sedimentary layers observed in the seismic reflection profiles to create the initial model. The reflection data show generally two distinct sedimentary sequences: an upper layer (layer 2) with velocities from 1.8 to 2.4 km s−1, typical of unconsolidated marine sediments, and a lower sedimentary sequence (layer 3) with velocities between 2.1 and 3.1 km s−1, representing a higher degree of compaction. The following layers 4–9 correspond to the observed six groups of distinct traveltime branches of the first arrivals with velocities from 4.5 to 8.1 km s−1(Figs 6a and b). Layer 4 represents the upper basement, and layer 9 is parametrized with P-wave velocities typical of the uppermost mantle.

Fits between observed (vertical bars represent picking uncertainties) and calculated (solid lines) traveltimes of OBH records for (a) model layers 6 and 7 and (b) model layers 8 and 9 using ray tracing and traveltime inversion as described in the text. Layers 6 and 7 represent upper to top of lower crust. Reflections and high-velocity (8.0–8.1 km s−1) refraction arrivals indicate that the interface between model layer 8 and 9 represents the Moho. P-wave velocities are given in km s−1. OBH positions are marked by solid circles. L1–L9 represent layer numbers.
Ray tracing in a layer-stripping approach (layer by layer from top to bottom) was carried out first to reduce the differences between observed and calculated traveltimes by adjusting model parameters in a realistic manner. As no reflection arrivals were observed except from the Moho, only refracted and diving P waves and PmP phases constrain the modelling procedure. Once we achieved a reasonable fit of observed traveltimes within the picking error bounds of the observed data, we applied a damped least-square inversion algorithm (Zelt & Smith 1992) to the traveltime data as a method of fine-tuning the best-fitting model. The inversion also provides numerical estimates of model resolution. To maintain model stability, the number of independent parameters was reduced by fixing the depth of boundary nodes and by inverting for velocities only. We kept all model parameters fixed for areas of limited or non-existent data control such as the two sedimentary layers and the western and eastern model extremities at the lower crustal level. Layer stripping proceeded in a similar manner as during forward modelling, beginning at layer 4 and finishing at layer 9. In general, model instability due to complex refractor geometry was rare. Model instability occurred in layer 5 around 220–250 km model distance, which might correspond to a low-velocity zone in this part of the profile. In this area, it was necessary to manually correct nodes of unrealistic velocity values and to keep them fixed during subsequent iterations. Most layers required between one and three iterations before the rms traveltime residual and χ2 values approached an acceptable level (Table 1). The traveltime data for all layers were fitted with an rms residual time of less than 80 ms(Figs 6a and b). The normalized χ2 values fall around the optimum value of 1. This indicates that traveltimes have been fitted within or close to their assigned uncertainty bounds. The χ2 value of 0.277 for layer 9 (upper mantle) shows the greatest deviation from 1, indicating that statistically the traveltimes were fitted more closely than warranted by the assigned uncertainty values for the Pn phases. This ‘overfitting’ does not necessarily invalidate the velocity assigned to this layer. It rather represents the result of an insufficient number of data points to achieve a valid statistical analysis due to the limited number of Pn arrivals. In this case, a χ2 value of less than 1 is considered acceptable (Zelt & Forsyth 1994).
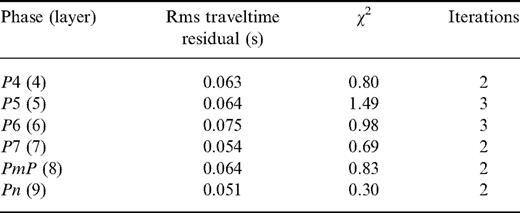
Statistics of linear traveltime inversion for all phases within a particular modelling layer. The layer numbers correspond to modelling layers with layers ȃ3 (water and two sedimentary layers) not included in the inversion procedure. Since most model parameters had been optimized during forward ray tracing, only a few iterations were required for convergence.
4.3 Velocity–depth model
The final velocity–depth model (Fig. 7) beneath the southern Agulhas Plateau includes the uppermost crustal zone, between zero and 1.5–2 km depth bsf, in which P-wave seismic velocities, increasing from 1.7 to 4.0 km s−1, are unconstrained by refraction data but well defined by velocity analyses from coincident CDP reflection profiles. These sedimentary sequences reach their maximum thickness between 250 and 275 km profile distance. Their minimum thickness occurs around 75 km distance, which corresponds to a basement outcrop at CDP 5500–6100 in line AWI-98017 (Fig. 4c).
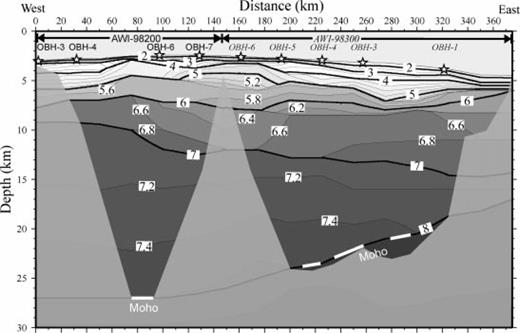
Final velocity–depth model of the southern Agulhas Plateau. Contour interval is 0.2 km s−1. The model shows velocities of well above 7 km s−1 of the lower 50–70 per cent of the crust. The high-velocity ridge in the upper crust at 75 km model distance coincides with an area identified as an extrusion centre in the seismic reflection data (Fig. 4c). The white lines represent regions of the Moho constrained by PmP phases. Seismically unconstrained crustal zones are shaded light grey.
The upper to mid-crustal basement zone has seismic P-wave velocities in the range 4.0–6.6 km s−1 at depths bsf from 1.5–2.0 km to a maximum of 8 km (Fig. 7). This zone contains several velocity discontinuities associated with a rapid increase in seismic P-wave velocity. The increases in seismic velocity within this depth range are constrained by traveltimes for model layers 4, 5 and 6. A velocity discontinuity occurs at the base of this zone where velocities increase from 6.6 to 7.0 km s−1. A possible vertical zone of low velocity can be inferred in model layer 5 between 220 and 250 km profile distance. The extent of this zone is poorly resolved with respect to OBH spacing and is only suggested by an increase in slope of the refraction arrival between 43 and 63 km in profile AWI-98300 recorded by OBH-5.
We define the lower crustal zone for the Agulhas Plateau where P-wave velocities range from 7.0 to 7.6 km s−1 (Fig. 7). Velocities of 7.0–7.1 km s−1 are mainly constrained by refracted rays that turn at 7–10 km depth bsf (10–13 km total depth). At deeper levels of the eastern transect segment, the numerous overlapping and reversed ray paths of the downgoing and returning PmP and Pn phases constrain velocities up to 7.6 km s−1, while the western transect segment is less controlled due to the lack of refracted arrivals. The lower crustal zone shows a relatively low vertical velocity gradient within its 9–17 km thickness. The lower crustal boundary is marked by a velocity discontinuity from 7.5–7.6 km s−1 to 8.0–8.1 km s−1 at crustal depths increasing from 17 km bsf in the east to 25 km bsf in the west of the range in which arrivals are observed. The eastern crust–mantle boundary depth is well constrained by large-amplitude PmP arrivals from OBH-3, 4 and 5 (AWI-98300, Fig. 5b) and by Pn phases from OBH-5 and 6 (AWI-98300, Fig. 5c). The western, deeper Moho depth has a larger uncertainty because the thickness of the lower crust at that side is controlled primarily by a PmP phase from OBH-4 (AWI-98200, Fig. 5a).
5 Gravity Model
To test the validity of the velocity–depth model against the regional gravity anomaly field (Fig. 8a) we calculated the gravity anomaly response from a 2-D density–depth model across the Agulhas Plateau and compared it to the observed free-air anomaly signal (Fig. 8b) of the global satellite-derived gravity database of Sandwell & Smith (1997). Smoothing of the measured gravity field was required to remove small-wavelength variations due to upper crustal 2-D and 3-D effects that could not be resolved by the OBH data. We approximated the crust and upper mantle by six model layers (A–F), each with a constant density (Fig. 8b). The densities were taken from the velocity–density relationship of Ludwig . (1970) using average P-wave velocities for the respective layers. The depths of layer boundaries were taken from the velocity–depth model. The coincident seismic CDP data provided depths of the water column (gravity model layer A). Layer B has an assigned density of 2.4 g cm−3 based on the average velocity of 2.5 km s−1 for the sedimentary sequences. We chose this density to be higher than that for normal oceanic sediments (1.8–2.2 g cm−3, after Ludwig . 1970) because of the integrative effect of numerous high-density basalt flows into the sediments. Densities for layer C (2.7 g cm−3) and layer D (3.1 g cm−3) are based on their average seismic velocities of 5.2 and 6.85 km s−1, respectively. The average density of 3.2 g cm−3 for layer E corresponds to the high seismic velocities of 7.1–7.6 km s−1 observed for the lower crust. The density of the upper mantle (layer F) is set to 3.3 g cm−3.
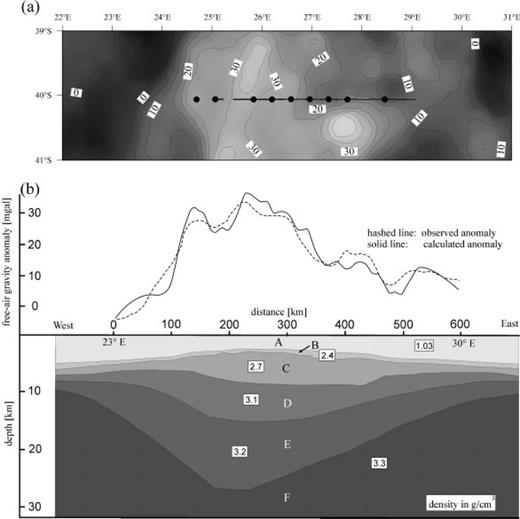
(a) Satellite-derived low-pass filtered gravity field (in mgal) over the Agulhas Plateau (Sandwell & Smith 1997). A cut-off wavelength of 60 km was applied to remove small-wavelength variations. Black lines and dots are SETARAP refraction shot profiles and OBH stations, respectively. (b) 2-D density–depth model, corresponding to the filtered gravity anomaly field (dashed line), along a transect at 40°S. The calculated gravity anomaly response (solid line) matches the observed values with an rms residual of 5–6 mgal. A–F mark the gravity model layers.
The long-wavelength density model response shows a good approximation of the gravity anomaly across the Agulhas Plateau (Fig. 8b). The rms residual between observed and calculated free-air anomaly values is of the order of 5–6 mgal. Differences occur mainly in the short-wavelength band and correspond to small-scale changes in bathymetry and thickness of the sedimentary layers not sampled with the model parameter settings as well as in areas where two dimensions is a poor approximation (e.g. at 370–500 km model distance). The long-wavelength fit provides confirmation of the seismically derived overall depth structure of the plateau, assuming the model velocity–density relation is correct.
6 Discussion of geophysical evidence
The crust of southern Agulhas Plateau consists of at least three seismically distinct zones: an upper crustal zone, including sediments, with P-wave velocities increasing from 1.7 to 4.0 km s−1, a middle crust with velocities of 4.0–6.6 km s−1, and a lower crust with velocities of 7.0–7.6 km s−1 (Fig. 7). The constrained total crustal thickness is 25 ± 2 km at the plateau's centre (40°S, 25.5°E) and decreases to 17 ± 1 km to the east at 40°S and 28°E. An extrapolation from the 2-D gravity model (Fig. 8b) would place the onset of ‘normal’ oceanic crust with thickness of 6–8 km at latitude 40°S to about 22.5°E and 31.5°E. Velocities of the plateau's upper and middle crustal zones are slightly higher than those observed for average oceanic crustal layers 1 (sediments) and 2 (lavas and intrusives) (e.g. White . 1992). However, the outstanding feature as a result of the seismic inversion, and confirmed by gravity modelling, is the overthickened lower crust of high velocities and densities. At the centre of the plateau, the zone with P-wave velocities higher than 7.0 km s−1 reaches a proportional thickness of 50–70 per cent of that of the total crust. The very high velocities of up to 7.6 km s−1 at the crustal base suggest that the lower crust was thickened by the addition of large volumes of mantle-derived material.
Another result of significant interest is the lack of intracrustal reflectors in the OBH recordings. As the recorded large-amplitude Moho reflections from all stations show, this lack is not related to the seismic source type. Since distinct refraction/diving-wave phases are observed from all crustal levels, we can presume that all intracrustal layer boundaries are highly gradational in their compositional change.
Seismic refraction data acquired prior to this SETARAP project include a number of irregularly spaced profiles over the northeast, northwest and central Agulhas Plateau (Green & Hales 1966; Ludwig . 1968; Hales & Nation 1973; Barrett 1977; Tucholke . 1981). Most of these early data sets consist of airgun or explosive shots recorded by sonobuoys, with the exception of a single OBH record. Over the central plateau, these data indicate velocities of 5.8–6.4 km s−1 for a 4.3–7.7 km thick layer beneath the top of the acoustic basement (Tucholke . 1981), which is consistent with our observations. Tucholke . (1981) observed a velocity of 7.1 km s−1 from a zone beneath the western plateau with a maximum depth bsf of 10–14 km. Refraction arrivals from deeper layers or a crust–mantle boundary were not observed.
Based on the velocities and depths calculated and estimated by Tucholke . (1981), Ben-Avraham . (1995) derived a gravity model along the same latitude (40°S) as ours across the southern plateau. Their model consists of densities increasing from 1.9 g cm−3 for the upper crust to 2.92 g cm−3 for the lower crust and 3.1 g cm−3 for the uppermost mantle. We believe that these densities are too low and their crustal thickness is underestimated, given the velocity–depth information available from the recent data. In an earlier study, Angevine & Turcotte (1983) used correlations of geoid anomalies with bathymetry, using a two-layer Airy isostatic model, to derive a model of the Agulhas Plateau in which a thickened crust is underlain by a mantle with an anomalously low density. Our results show that a normal mantle density of 3.3 g cm−3 is sufficient to compensate for the gravity anomaly, if crustal thickness extends to 25 km under the southern plateau.
The seismic velocity distribution underneath the southern plateau does not provide evidence for continental crustal affinity as suggested in earlier work (Allen & Tucholke 1981; Tucholke . 1981). However, velocities of the upper and middle crust to a maximum depth of about 8 km do not necessarily distinguish between overthickened oceanic layer 2 or felsic material of continental origin. We do not exclude the possibility that fragments of continental crustal material may be contained in the plateau, but they would have to be of dimensions smaller than our seismic velocity data allow us to resolve. Another possibility is that fragments of continental crust were altered by younger magmatic events and therefore do not exhibit a seismic velocity typical of continental composition.
A crustal proportion of more than 50 per cent, consisting of rock material with velocities of more than 7 km s−1, must have been added by a steady and long-duration supply of mantle-derived material. This overthickened equivalent of an oceanic layer 3 (Mutter & Mutter 1993) provides the main argument for the suggestion that the southern Agulhas Plateau consists of extremely overthickened oceanic crust. White & McKenzie (1989) have shown that a downward velocity increase to 7.4–7.6 km s−1 can be assigned to material produced by a mantle plume. Adiabatic decompression is generally accepted to be a mechanism for generating large quantities of hot picritic melts. After cooling, such uprising mantle material with melts having an average of 16 per cent MgO shows velocities of 7.2–7.6 km s−1 (McKenzie & Bickle 1988; White & McKenzie 1989).
7 Analogue to other oceanic plateaus?
The controversial discussion on a continental or oceanic origin of the Agulhas Plateau requires a comparison of morphological, geophysical and petrological parameters with those known from other oceanic plateaus. Oceanic plateaus have become of increasing interest in terms of their crustal structure, composition and origin and their contribution in the context of global crustal growth (e.g. Mahoney & Coffin 1997). Therefore, good-quality geological and geophysical data are now available from a number of plateaus.
The Kerguelen Heard plateau, southern Indian Ocean, about three times the surface area of the Agulhas Plateau, is subdivided into geophysically quite different northern and southern parts. Deep-crustal seismic refraction data from the northern Kerguelen Heard Plateau, with the Kerguelen Archipelago in its centre, reveal that an up to 24 km thick crust comprises a lower crust of 15 km thickness with velocities increasing from 6.4 to 7.4 km s−1 (Charvis . 1995). Charvis . (1995) explained the relative thicknesses of oceanic layers 2 and 3 as well as the seismic velocities beneath the archipelago (Fig. 9) with an off-ridge emplacement and related the generation of excessive volcanism to the vicinity of an active spreading centre. Petrological and geochemical analyses of ultramafic and mafic xenoliths from the Kerguelen Archipelago support the geophysical interpretation of oceanic affinity of the northern plateau, but also infer a continental nucleation beneath the archipelago (Gregoire . 1998). Gregoire . (1998) based this hypothesis on the occurrence of a large volume of differentiated magmatic rocks in the upper crust, and on findings of mafic granulites from the vicinity of the crust–mantle boundary that are responsible for a gradational zone with velocities from 7.0 to 7.4 km s−1. A suggestion that at least the northern Kerguelen Heard Plateau is a 100–120 Ma old equivalent of the presently growing Icelandic crust has also been made (Charvis . 1995; Coffin & Gahagan 1995). The southern Kerguelen Heard Plateau, however, shows a continental signature in its seismic data (Fig. 9), with lower crustal velocities of less than 6.9 km s−1 above a 23 km deep (bsf) Moho (Operto & Charvis 1996). Both the absence of high velocities at the base of the crust and a reflective lower crust suggest that the southern plateau represents a stretched continental fragment (Operto & Charvis 1996). This hypothesis is additionally supported by samples of continental affinity found in drill cores of the recent ODP Leg 183 (Coffin . 1999).
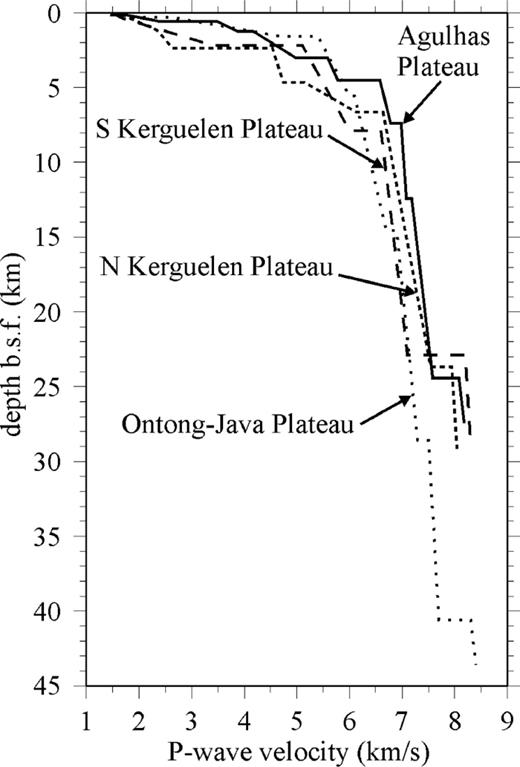
Compilation of average velocity–depth profiles from oceanic plateaus. Data are from Furumoto . (1976), Hussong . (1979) and Neal . (1997) for the Ontong–Java Plateau andCharvis . (1995) and Operto & Charvis (1996) for the northern and southern Kerguelen Heard Plateau. The graphs represent parts of the plateaus where the crust is thickest if known. Depth is below seafloor.
The largest oceanic plateau, the Ontong Java Plateau (western Pacific Ocean), lies generally at water depths of 2–3 km with the central region shallowing to 1.7 km. Its seismic velocity structure (Fig. 9) shows a maximum crustal thickness of 40 km, of which the lower 30 km constitutes the lower crust with velocities increasing from 6.9 to 7.6 km s−1 (Furumoto . 1976; Hussong . 1979; Miura . 1996; Gladczenko . 1997; Neal . 1997). It has been suggested that the plateau was formed at the site of a spreading ridge above or in the vicinity of the Louisville hotspot at about 119 Ma (e.g. Mahoney . 1993). Some mafic granulitic xenoliths have been described and may be equivalent to those of the northern Kerguelen Plateau (M. Gregoire, personal communication, 1999).
The proportional velocity–depth structure of the Agulhas Plateau is analogous to that of the northern Kerguelen Heard Plateau as well as that of the Ontong Java Plateau (Fig. 9). Upper crustal velocities (beneath sediments) lie between 2.5 and 4.5 km s−1 and mid-crustal velocities range from 5.0 to 6.9 km s−1. The main equivalent is the proportional thickness of a lower crustal layer with velocities above 7 km s−1. In all three plateaus, this proportional thickness is above 50 per cent of that of the total crust. Emplacement of all three plateaus occurred during the mid-Cretaceous (100–120 Ma).
8 Implications for the origin of the agulhas plateau
If indications for a predominantly oceanic origin of the Agulhas Plateau are evident, then the question of timing of its major crustal growth phase must be addressed. The observation of undisturbed sedimentation places the latest time for the excessive volcanism at around 90–100 Ma for the southern plateau and about 75–90 Ma for the northern plateau. At 80–100 Ma, the Bouvet hotspot was located in the region of the present Agulhas Plateau (Fig. 1), which has been previously discussed as a source of volcanism for the plateau (Ben-Avraham . 1995). It is possible that the Bouvet hotspot contributed to the largest proportion of the crustal growth. The very high velocities of 7.0–7.6 km s−1 in the lower 50–70 per cent of the crustal column indicate a dominantly mafic composition in the majority of the total crustal volume, requiring a steady mantle source that this mantle hotspot could have delivered.
The plate tectonic reconstruction of the South Atlantic and Southwest Indian Ocean region(Figs 10a and b) from the Early Cretaceous at isochron M0 (about 120 Ma) until the Late Cretaceous at isochron 34 (about 85–90 Ma) does not allow for the Agulhas Plateau to have existed before the break-up of the Falkland Plateau from southern Africa and the Mozambique Plateau. We suggest that at least the major proportion, if not all, of Agulhas Plateau crustal accretion was controlled by the proximity of the African–Antarctic spreading ridge and the southernmost African–South American spreading ridge. The Agulhas Plateau and the Maud Rise probably initially evolved as a single volcanic province but became separated by the African–Antarctic spreading ridge at about 95 Ma. Therefore, we can assume that volcanism and magmatic accretion of the Agulhas Plateau is not associated with that observed from the Falkland Plateau, but rather linked to the early crustal growth of Maud Rise and possibly to magmatism of the Mozambique Plateau. The magmatism associated with the passage of the Agulhas Plateau over the Bouvet hotspot intensified magmatism and forced an increased voluminous accretion of mafic material. The extent of the present MAGSAT anomaly (Fig. 1) covers both the Agulhas and Mozambique plateaus and seems to be limited to the southernmost African plate north of isochron 34.
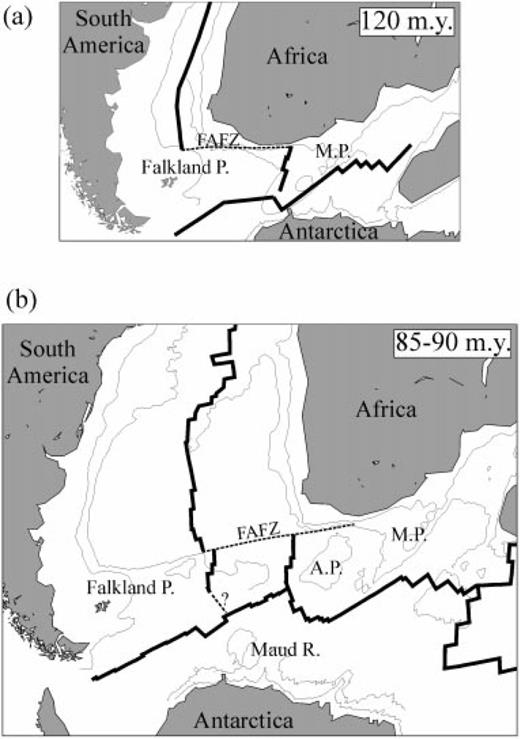
Reconstruction of the South Atlantic and Southwest Indian Ocean region between (a) Early Cretaceous (chron M0) and (b) Late Cretaceous (chron 34). Bold lines represent spreading centres at chrons M0 and 34 (from Müller . 1997). Dashed lines indicate transform boundaries. Note that the two South Atlantic spreading centres between the Falkland and Agulhas Plateaus in the Late Cretaceous reconstruction correspond to a major westward ridge jump along the Falkland–Agulhas Fracture Zone (FAFZ) (Hartnady & le Roex 1985). A.P. and M.P. are abbreviations for the Agulhas and Mozambique plateaus, respectively. The results presented in this paper suggest that the Agulhas Plateau must have come into existence after the Falkland Plateau drifted away from the Mozambique Ridge.
9 Conclusions
An extensive high-resolution seismic reflection and deep-crustal large-offset and wide-angle reflection/refraction survey across the Agulhas Plateau has revealed significant information about the structure and origin of this oceanic plateau. Our main results and implications are as follows.
- 1
The seismic reflection data show numerous volcanic extrusion centres randomly distributed across the plateau. The minimum volume of extruded material is estimated to be 150 000 km3. The major phase of this extensive volcanism can be dated to Late Cretaceous time.
- 2
Evidence from OBH data suggests that the crust underneath the southern plateau is up to 25 km thick. The lower 50–70 per cent of the crustal column consists of material with P-wave velocities increasing with depth from 7.0 to 7.6 km s−1. The velocity–depth profile is similar in proportion to those observed from the Northern Kerguelen Plateau and the Ontong–Java Plateau, which are both large igneous provinces.
- 3
We do not see any evidence for continental affinity but rather for a predominantly oceanic origin of the southern Agulhas Plateau. This is in contradiction to previous studies that were based on analyses of dredged rock samples of quartzo-feldspathic composition and Precambrian ages. It is, however, possible that fragments of continental crust have remained in parts of the present plateau region after the Gondwana break-up. The size of these fragments would probably be beyond the resolution power of the seismic recordings.
- 4
The main crustal growth of the plateau probably occurred in the Early Cretaceous, while close to spreading centres, and in Late Cretaceous time at about 80–100 Ma when the region passed over the Bouvet hotspot. The reconstruction at chron 34 shows that the Falkland Plateau had been completely separated from the Agulhas Plateau at that time. We suggest that volcanism and magmatic accretion of the Agulhas Plateau is not associated with that observed from the Falkland Plateau, but rather linked to the early crustal growth of Maud Rise and possibly to magmatism of the Mozambique Plateau.
Acknowledgments
We acknowledge with gratitude the cooperation of the captain and crew of the Russian MV Petr Kottsov who made it possible to obtain the seismic data. We are also grateful to the technicians Uwe Rosiak and Günter Stoof and the students Michael Seargent, Axel Ehrhardt, Justine Tinker, Kai Bleker, Matthias König and Martin Knoll who participated in the data acquisition on board. Michael Seargent (supported by a GEMOC Scholarship, Macquarie University) and Justine Tinker (University of Cape Town) completed their BSc Honours theses, and Axel Ehrhardt (Universität Münster and AWI) wrote his Diploma (MSc) thesis on aspects of the SETARAP project. Many thanks to Maarten de Wit, Zvi Ben-Avraham and John Rogers from the University of Cape Town for help in planning the cruise and for their input in discussing some of the results. Karl Hinz (Bundesanstalt für Geowissenschaften und Rohstoffe, Germany) generously provided the seismic data of line BGR-96001. Gratefully acknowledged are the constructive comments and suggestions by two anonymous reviewers. The project SETARAP was funded by the German Bundesministerium für Bildung, Forschung und Technologie (BMBF) under contract no. 03G0532A. Additional funds were provided through a Macquarie University Research Grant. This is GEMOC publication no. 231 and AWI publication no. awi-n10007.
References
Author notes
Formerly at: Macquarie University, Department of Earth and Planetary Sciences and Key Centre for Geochemical Evolution and Metallogeny of Continents (GEMOC), Sydney, Australia.


