


Summary
A magnetic study was carried out on lacustrine sediments from the Zoigê basin, Tibetan Plateau, in order to obtain a better understanding of palaeoclimatic changes there. Gyromagnetic remanence (GRM) acquisition is unexpectedly observed during static three‐axis alternating field (AF) demagnetization in about 20 per cent of a large number of samples. X‐ray diffraction (XRD) analysis on a magnetic extract clearly shows that greigite is the dominant magnetic mineral carrier. Scanning electron microscopy (SEM) reveals that the greigite particles are in the grain size range of 200–300 nm, possibly in the single‐domain state. Greigite clumps of about 3 μm size are sealed by silicates. Fitting of XRD peaks yields a crystalline coherence length of about 15 nm, indicating that the particles seen in the SEM are polycrystalline.
GRM intensities of most samples are of the same order as the NRM, while others show much stronger GRM although their magnetic properties are similar. Variation of the demagnetization sequence confirms that GRM is mainly produced perpendicular to the AF direction. The anisotropy direction can be derived from GRM, but more systematic studies are needed for detailed conclusions. An attempt to correct for GRM failed due to high GRM intensities and because smaller GRM acquisition was also found along the demagnetization axis. Behaviours of acquisition and AF demagnetization of GRM are comparable with those of NRM, ARM, IRM, indicating fine grain sizes of remanence carriers.
Introduction
Wilson & Lomax (1972) were the first to discover that a strong remanent magnetization could be induced in a rock when it was rotated in a decreasing alternating field (AF), and they termed this the rotational remanent magnetization (RRM). Since then, a substantial amount of work on RRM has been published (Brock & Iles 1974; Stephenson 1976; Hillhouse 1977; Edwards 1980a,b). A gyromagnetic origin for RRM, proposed by Stephenson (1980a) and Smith & Merrill (1980), is currently widely accepted.
A disturbing magnetization acquired during static three‐axis AF demagnetization of certain rocks was first found by Zijderveld (1975). A relation to magnetic anisotropy was suggested, and a method of correcting for it was developed by Dankers (1978). The origin was explained as gyromagnetic by Stephenson (1980b). The term gyromagnetic remanence (GRM) will be used in this paper in order to make a distinction from RRM. Stephenson (1980b) points out that GRM will be produced in an anisotropic sample in the A×F direction, where A is along the direction of the maximum susceptibility κmax described by an ellipsoid of revolution, and F denotes the axis of the AF field. The magnitude of GRM might be expected to depend on the flip time of the particle moment, the degree of anisotropy, and the angle θ between A and F, and will be minimum when θ is 0° or 90°, and maximum when θ is 45° (Stephenson 1980b; Roperch & Taylor 1986). Some workers (Zijderveld 1975; Dankers & Zijderveld 1981; Roperch & Taylor 1986; Stephenson 1993) have shown that igneous rocks containing small magnetically hard particles of (titano‐)magnetite may acquire a GRM. Other minerals, for example greigite (Snowball 1997), may also acquire a GRM.
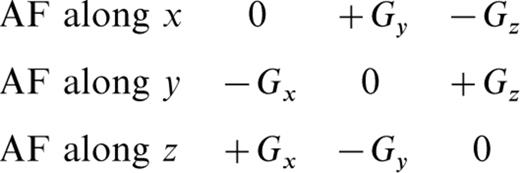
Dankers & Zijderveld (1981) proposed a method to correct for GRM. Since no GRM acquisition is expected along the demagnetization axis, measurements of all three components after each demagnetization step in the x‐, y‐, z‐directions provide results that are not affected by GRM. Stephenson (1993) demonstrated that this correction method is in agreement with theoretical considerations. He showed that GRM can be expected to have the following form:
However, GRM can also be useful. Intensities and directions of GRM provide information on the anisotropy of samples (Roperch & Taylor 1986). Similar tests were initially conducted by Stephenson (1980b, 1981a) for RRM.
Although GRM acquisition during static AF demagnetization has been described and the explanation of its anisotropic origin is accepted, little detail is known about GRM. Not acquired by every anisotropic sample, GRM has only rarely been reported (Roperch & Taylor 1986). It is believed that, when better understood, GRM may provide useful rock magnetic information, as it is not always present and hence reflects differences in magnetic properties of magnetic grains (Tarling 1983).
Lithology, Sampling And Measurements
For studying palaeoclimatic and palaeoenvironmental changes on the Tibetan Plateau, a core called RM was drilled in the Zoigê basin, Gansu Province, China (33°57’N, 102°21’E). The core reached a depth of 310 m and consists almost completely of lacustrine sediments: grey, green‐grey, and dark brown‐grey silty mud, muddy silt, and silty sand, occasionally fine sand layers and frequently thin peat layers. It can be subdivided into three major parts:
(1) 160–310 m—regular sedimentary cyclothems: 10 m thick cycles mixed with green‐grey mud and/or muddy silty sand and peat layers.
(2) 43–160 m—irregular sedimentary cyclothems: dark brown‐grey muddy sediments with the thickness of sedimentary cycles increased to 20 m.
(3) 0–43 m: grey and green‐grey mud with nine thin peat layers between 20 and 43 m, transition sediments between 14 and 20 m, and yellow‐brown fluvial deposits between 0 and 14 m.
For the purpose of studying palaeomagnetism and environmental magnetism, a total of 3774 magnetic samples were obtained from Core RM using 8 cm3 cubic plastic boxes. Because of irrecoverable core rotation, only the vertical direction (z‐axis) of the samples is meaningful. Down to 80 m, specimens were taken in intervals of 5 cm, and below 80 m, in intervals of 10 cm.
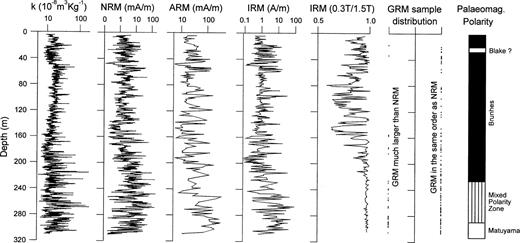
After drying in air, the initial magnetic susceptibility (k), natural remanent magnetization (NRM), anhysteretic remanent magnetization (ARM) and isothermal remanence (IRM) were measured throughout the sequence. Results are plotted in Fig. 1. IRM ratios (0.3 T/1.5 T, both measured in the same direction) reach about 90 per cent (ranging from 75 to 95 per cent) within 0–43 m, nearly 80 per cent (ranging from 65 to 95 per cent) within 43–160 m, and predominantly 95 per cent (very few are within 75–90 per cent) within 160–310 m, which documents a variable magnetic mineralogy. AF demagnetization measurements of samples show that almost all samples have negative inclination below 280 m. Thus, the B/M boundary (0.78 Myr) is estimated to be around 280 m. However, during static three‐axis AF demagnetization GRM was unexpectedly acquired in about 20 per cent of the samples.
Susceptibility (k), natural remanence (NRM), anhysteretic remanence (ARM), isothermal remanence (IRM), ratio of IRMs acquired in 0.3 and 1.5 T, gyromagnetic remanence (GRM), and palaeomagnetic polarities versus depth.
Rock Magnetism
In order to understand better magnetostratigraphy, environmental magnetism and GRM behaviour, magnetic mineral identification was carried out.
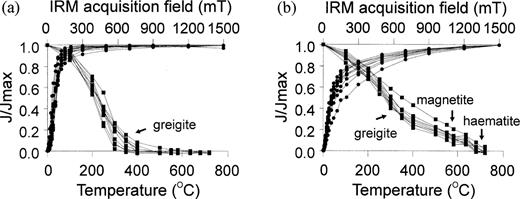
Results of IRM acquisition (in a stable field) and thermal demagnetization of IRM are plotted in Fig. 2. Two types of IRM acquisition curves can be distinguished. One type (Fig. 2a) mainly shows the presence of ferrimagnetic minerals, which achieve 95 per cent of their maximum value at 250–300 mT, and saturate at 500–800 mT. For these samples, thermal demagnetization of IRM reveals a maximum unblocking temperature (T b) of about 300–350 °C. Occasionally, a residual remanence of 10 per cent or less is preserved above 400 °C, indicating a small amount of magnetite, which is confirmed by the presence of the Verwey transition observed during low‐temperature IRM experiments (Fig. 3a). Iron sulphides are suspected to account for the low unblocking phase. Ferrimagnetic pyrrhotite has a Curie temperature of about 320 °C, but higher T b values up to 350 °C have been reported (Rochette et al. 1990). The Curie temperature of greigite cannot be determined because it decomposes before reaching the Curie point (Snowball & Thompson 1990; Hoffmann 1992). Greigite‐bearing samples display a characteristic high‐temperature transition behaviour with a major drop in magnetization between about 300 and 400 °C during heating in air (Snowball & Thompson 1990; Hoffmann 1992; Roberts & Turner 1993; Roberts 1995). Pyrrhotite usually loses most of its remanence within a narrow temperature range below the Curie temperature. The rather gradual decrease below 300 °C as well as the tail to 400 °C or even higher in Fig. 2(a) point to greigite rather than pyrrhotite. The second group of samples (Fig. 2b) shows both ferrimagnetic and hard antiferromagnetic components. At 250–300 mT about 70 per cent of the maximum IRM is obtained. Also for this type a low unblocking phase with a maximum T b of 300–350 °C occurs. Higher values of maximum T b of 580 and 680 °C represent magnetite and haematite, respectively, which are clearly more important here than in Fig. 2(a). The type of demagnetization behaviour shown in Fig. 2(a) is dominant between 0 and 43 m, is less represented between 43 and 160 m, and is almost exclusive between 160 and 310 m.
IRM acquisition curves (circles) and thermal demagnetization of IRM (squares) for different types of samples.
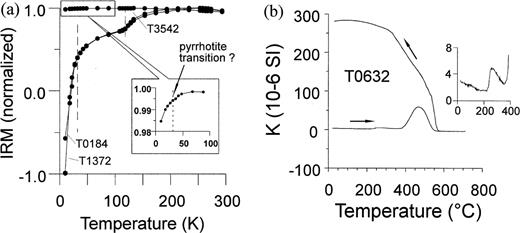
For seven GRM‐acquiring samples, IRM acquired in a 3 T field was measured during cooling down to 10 K using a MPMS SQUID magnetometer (Quantum Design). All samples more or less exhibit the Verwey transition at about 120 K, which is characteristic of non‐oxidized magnetite (Fig. 3a). Generally, the occurrence of a magnetic transition at 30–34 K has been proposed as the most definitive evidence for identifying magnetically ferrimagnetic pyrrhotite (Rochette et al. 1990). For greigite such a low‐temperature phase transition does not exist (Spender et al. 1972; Roberts 1995), or occurs at a very low temperature of about 4 K (Rochette et al. 1994). Most samples show a dramatic decrease at 50–10 K (Fig. 3a), which probably represents an induced magnetization caused by a residual magnetic field of the MPMS (Jackson et al. 1993). However, Verosub et al. (1994) suggest that this steep decay indicates an important contribution of superparamagnetic material to low‐temperature IRM. They argue that, as the temperature is decreased, more and more of the superparamagnetic grains can behave as single‐domain grains. Even if some pyrrhotite is contained, the transition could be concealed by such marked changes of magnetization intensity. Only one sample (T3542) shows a faint indication of a pyrrhotite transition (Fig. 3a inset). This sample is characterized by an IRM intensity about 50 times higher compared to the other two samples shown in Fig. 3(a), and magnetization is quite constant from room temperature down to 4 K. A much higher concentration of ferrimagnetic minerals can be expected, which suppresses paramagnetic effects.
(a) Cooling of IRM (acquired at room temperature) in zero field. The temperature of 120 K denotes the Verwey transition of magnetite. The decay of IRM between 50 and 10 K may be caused by the ordering of paramagnetic minerals. Only one sample (T3542) shows a weak indication of a pyrrhotite transition. (b) The susceptibility versus temperature curve. The λ‐transition of pyrrhotite is indicated by an increase around 220 °C during heating (shown enlarged in the inset).
Thermomagnetic curves of susceptibility were measured with a CS‐2 temperature device (AGICO) attached to a KLY‐2 susceptibility bridge (AGICO), cycling between room temperature and 700 °C. The measurements were masked by the formation of magnetite in all samples during heating. Some samples showed an increase starting at about 220 °C during heating (Fig. 3b), which could correspond to the λ‐transition of pyrrhotite from antiferromagnetic to ferromagnetic pyrrhotite (Dekkers 1989; Zapletal 1993).
Xrd, Edx And Sem Analysis
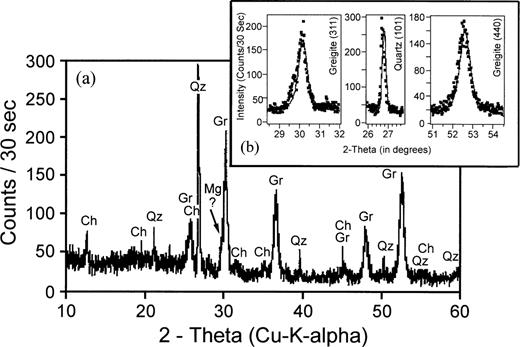
The strongest positive identification of the magnetic component unblocked at 300–350 °C comes from X‐ray diffraction (XRD) results (Fig. 4a) for magnetic extracts using a mixture of 10 samples of the type in Fig. 2(a). Only about 15 mg of the mineral separates were available for X‐ray diffraction. The substance was suspended in pure alcohol, spread on a glass slide and left to dry. No grinding or pressure was applied to the sample to avoid any reaction or transformation of the delicate material. During the evaporation of the alcohol, the mineral grains agglomerated such that an ideal, perfect flat mount surface could not be obtained. The result (Fig. 4a) proves the presence of greigite (labelled Gr) besides some quartz (Qz) and chlorite (clinochlore, Ch) and possibly some magnetite. The greigite lines show significant broadening.
(a) Diffractogram of the mineral separate (from GRM‐produced samples) taken with Cu–K‐α radiation and a secondary monochromator. Greigite (Gr) is identified as the dominant magnetic mineral (magnetite, denoted as Mg, may be present as well in small amounts). The major impurities from the sedimentary environment are quartz (Qz) and chlorite (clinochlore, Ch). Note the significant Lorentzian broadening of the greigite peaks, indicating a small crystalline coherence length. All peaks are shown on the same 2θ‐scale. The diffractogram was collected between 5° and 90° (2θ) with Cu–K‐α radiation on a computerized Philips Bragg‐Brentano diffractometer equipped with a secondary monochromator. The stepwidth was 0.02° with a counting time of 30 s per step. (b) Typical profile fits of greigite diffraction maxima and the quartz (101) peak which was used as an internal standard.
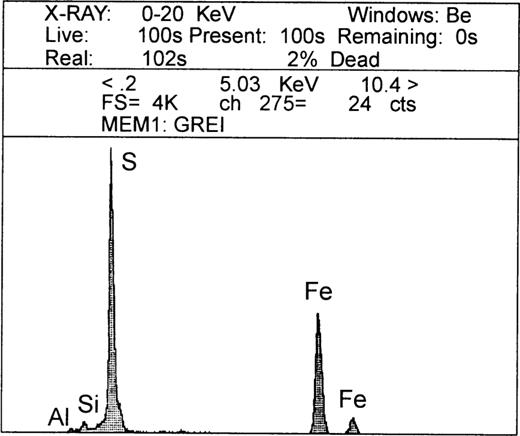
Scanning electron microscopy (SEM) and energy‐dispersive X‐ray (EDX) analysis were performed on a JEOL scanning electron microscope with attached EG&G Ortec System 5000. The extract used for XRD analysis was also used for SEM observations. SEM images of the magnetic extract show well‐embedded light‐grey particles (ranging around several μm) sealed by dark‐grey particles (Figs 5a and b). An EDX analysis (Fig. 6) proves the existence of iron sulphides (iron and sulphur peaks) and silicates (Si and Al peaks). Seen in connection with the XRD results, the light‐grey particles are expected to be greigite, while the dark‐grey ones should consist of silicates. Another SEM picture (Fig. 5c) shows both well‐embedded greigite clumps sealed by silicates at the left upper edge and ‘open’ greigite clumps mixed with silicates in the centre. The first pattern is predominant (90 per cent) in the whole section. Further zooming clearly reveals unsealed greigite clumps of around 3 μm size (Fig. 5d), and greigite particles which adhere to silicates (Fig. 5e). Higher magnification of Fig. 5(c) shows that single greigite crystallites range around 200–300 nm (Fig. 5f), probably in the SD state (Hoffmann 1992).
SEM images in backscattered mode. (a) Overview of the section; (b) well‐embedded greigite (light‐grey particles) sealed by silicates (dark); (c) greigite sealed by silicate (upper left corner) and greigite mixed with silicate (centre); (d) greigite clumps (unsealed by silicate); (e) quartz grain covered by greigite; (f) greigite particles ranging between 200 and 300 nm.
Energy‐dispersive X‐ray analysis (EDX) of iron‐sulphide particles in Fig. 5. Fe and S indicate greigite, while Si and Al arise from silicates.
For further analysis of grain size, the resolved XRD peaks of quartz and greigite (Fig. 4b) were fitted as K‐α1–K‐α2 doublets with a pseudo‐Voigt profile function (Snyder 1995), i.e. the sum of a Gaussian and a Lorentzian peak with identical full width at half maximum (FWHM). For the greigite peaks, the obtained Lorentzian component of the profile was 80 per cent and the line width of the order of 0.6–0.9° 2θ. The Lorentzian line profile is indicative of grain‐size broadening. The quartz (101) had a FWHM of 0.19° 2θ and was of almost Gaussian shape (90 per cent); it was significantly broader than the quartz (101) line of an external quartz calibration standard (0.12° 2 θ FWHW). We attribute the extra broadening and the Gaussian shape of the quartz peak to the roughness of the dried suspension of the mineral separate rather than to any defects of the quartz crystals. The best method of processing is to deconvolve the peak profiles with the experimental resolution function. The (101) quartz peak of the sample was used as an internal standard for this purpose. The deconvolution was performed numerically for all greigite peaks: the quartz peak profile was convoluted with an 80 per cent‐Lorentzian pseudo‐Voigt curve of various trial widths until the convolution had the FWHM of the observed greigite diffraction line. The 2θ‐dependence of the quartz line‐width was ignored because of the lack of precise information. Thus, the determined width of the deconvolved greigite peaks was used to calculate a nominal crystallite size D by the Scherrer equation:

where λ is the wavelength and K is a shape factor (Klug & Alexander 1954) which takes a value of 0.89 for spherical particles and 0.94 for cubes. We used a value of 0.915. Within data scatter, the FWHM and its 1/cosθ‐dependence were well described by the Scherrer equation with a nominal crystallite size of 15.4±1 nm. The (220)‐line appears broader than expected by this simple model. However, a rather strong line of clinochlore is superimposed upon this greigite line, making it appear broader than it actually is. As these two lines cannot be separated experimentally, we choose to ignore this data point. The quoted error interval of ±1 nm acknowledges the unknown value for K; the error of the nominal crystallite size due to data scatter is much smaller.
The crystallite coherence length of only 15 nm seems to be incompatible with the SEM observations by a factor of 15–20. However, if the coherent crystallite size is 200–300 nm, only large statistical variations of the lattice parameters due to non‐homogeneity and defect strains could explain the line broadening. Statistical lattice strains lead to a proportionality between FWHM and tanθ. Within data scatter, however, there is no evidence of a θ dependence of the FWHM of the deconvolved greigite peaks other than 1/cosθ. Furthermore, the statistical distribution of defect strains leads typically to a Gaussian peak shape, while we observe a dominantly Lorentzian peak shape for the greigite peaks, which is clearly indicative of grain‐size broadening. Note that a small Gaussian component of the greigite profile must be expected due to the grain‐size distribution. Thus, in our data, there is no evidence for a major contribution of defect strain to the broadening of the greigite line. To explain the discrepancy, the particles seen in SEM images may consist of polycrystalline constituents. Whereas crystallites of 15 nm are probably in a superparamagnetic state, it can be expected that polycrystalline ‘conglomerates’ of 200–300 nm have an SD‐like behaviour because of magnetic interaction.
Origin Of Greigite
Greigite has experienced increasing attention in palaeomagnetic and environmental investigations (Snowball 1991; Fassbinder & Stanjek 1994; Hallam & Maher 1994; Reynolds et al. 1994; Stanjek et al. 1994; Bazylinski et al. 1995; Florindo & Sagnotti 1995; Jelinowska et al. 1995; Dekkers & Schoonen 1996; Roberts et al. 1996; Torri et al. 1996). Although it is mostly reported to carry a secondary chemical remanence due to authigenic formation (Snowball & Thompson 1990), we cannot distinguish whether the greigite in our samples is of biochemical origin or perhaps even consists of magnetosomes (e.g. Stanjek et al. 1994).However, it is reported that greigite oxidizes easily once the sediment is exposed to air (Snowball & Thompson 1988; Ariztegui & Dobson 1996). Our samples were taken in the summer of 1993. After drying in air, the samples were stored at room temperature. Nevertheless, greigite is still found in our magnetic extract. It seems to be fairly stable upon exposure to air, probably because the particles are well sealed by silicates. In this case, greigite could be produced in an early stage during or soon after the deposition of the sediments, and may carry a primary remanence.
Observed GRM Acquisition
An automatic degausser system (2G Enterprises), attached to the SQUID magnetometer, was used for routine AF demagnetization. AF cleaning with this instrument is performed statically, first by demagnetizing the z‐component (along the system axis) inside a solenoid, then by translating the sample into a transverse coil system for demagnetization of the y‐component, followed by the x‐component after 90° clockwise rotation of the sample around the z‐axis (demagnetization characteristics: frequency 50 Hz, decay time 2 s).
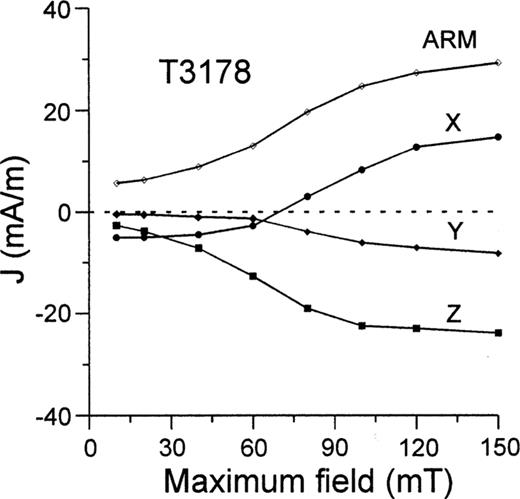
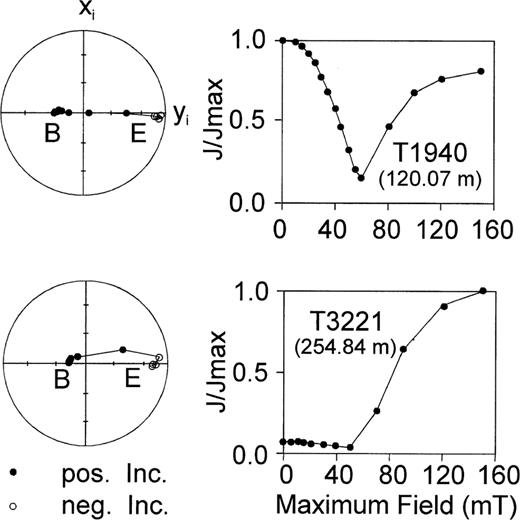
Most GRMs present after 150 mT AF demagnetization are of the same order as the NRM; others are much higher (Figs 1 and 7). Generally, GRM in high fields was aligned in the y–z plane, perpendicular to the last demagnetization (x) direction, as expected. Surprisingly, however, it was mostly orientated close to the y‐axis of the sample coordinate system. Almost all samples that acquired a GRM are of the type shown in Fig. 2(a), although not every sample of this type produced a GRM. Samples from this group were selected for all tests discussed further below.

GRM acquisition during AF demagnetization of two representative samples. Equal‐area projections demonstrate that GRM is acquired close to the y‐direction of the instrument system (xi, yi, zi) corresponding to the sample system here (the common orientation for standard measurements). B, E denote the beginning and end of demagnetization, respectively. Note that GRM intensities of most samples (like T1940) are of the same order as the NRM, while some others (like T3221) are much higher.
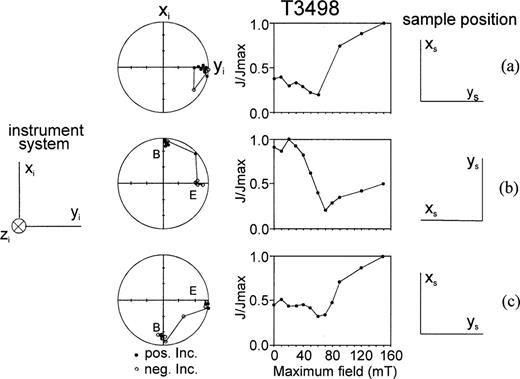
For one sample, the orientation with respect to the instrument coordinate system was varied (Fig. 8), and the normal AF demagnetization procedure (z, y, x sequence) was applied after each rotation. First, the sample system was orientated in accordance with the instrument system, and stepwise AF demagnetization was conducted until 150 mT. In this way, GRM was produced along the y‐axis (Fig. 8a) as described above. Then the sample system was rotated counterclockwise in the instrument system by 90° around the z‐axis and the stepwise AF demagnetization sequence was performed again. In this case, the previously acquired GRM (which, after sample rotation, is orientated along the x‐axis of the instrument system—shown by ‘B’ in Fig. 8b) was demagnetized to about 20 per cent of its initial remanence (initial decrease in Fig. 8b) up to 70 mT. Then, a new GRM was evidently acquired approximately in the y‐direction of the instrument system, which corresponds to the x‐axis of the sample system at this stage (Fig. 8b). In a third step, the sample was rotated back to its initial position of Fig. 8(a). During AF demagnetization, GRM acquisition was observed along the y‐axis of the instrument system (Fig. 8c), as before. We recognize that the GRM produced during the preceding steps may not be totally demagnetized up to 80 mT. However, this has only a minor impact on our conclusion: that the newly produced GRM is dominant and always reset in the y‐axis of the instrument coordinate system in high fields.
GRM acquisitions for different positions of the sample (sample system xs, ys, zs) in the instrument (instrument or measurement system xi, yi, zi). The sample is rotated around the z‐axis. B, E denote the beginning and end of demagnetization, respectively.
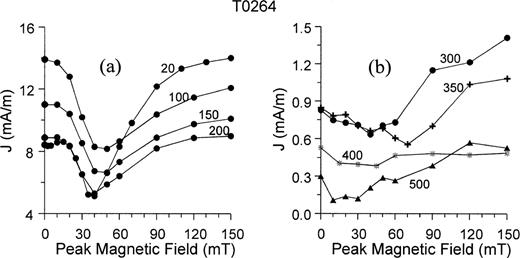
Another experiment was done with sequences of normal stepwise AF demagnetization after heating the sample to different temperatures (Fig. 9). First, the NRM was stepwise AF demagnetized at room temperature and a GRM was produced (curve ‘20’). Then, the sample was thermally demagnetized at 100 °C. After cooling, the sample was AF demagnetized again (curve ‘100’ in Fig. 9a). In subsequent cycles, the sample was thermally demagnetized at higher temperatures, and, after each heating step, AF demagnetization was performed. The final GRM always pointed to the y‐direction of the instrument coordinate system in this test. The beginning of curve ‘350’ (Fig. 9b) represents the GRM intensity of the preceding curve (endpoint of curve ‘300’) after applying thermal demagnetization at 350 °C. Note that heating partly decreases the remanence intensity. Figs 9(a) and (b) are plotted on different scales, since intensities are much lower after heating to more than 300 °C. High GRM was no longer observed after thermal treatment at 350 °C, a fact related to the decomposition of greigite, as confirmed by thermal demagnetization of IRM (Fig. 2). Residual GRM in Fig. 9(b) might be caused by minute remainders of greigite or other minerals, such as, for example SD magnetite. From the test sequence shown in Fig. 9, it can be concluded that greigite is responsible for GRM acquisition in our samples.
GRM acquisition after stepwise heating. Numbers indicate temperatures in °C. Full AF demagnetization curves are shown. Note the different scales in parts a and b (see details in text). The starting point of ‘20’ represents the NRM intensity.
A basic question is whether the observed remanence indeed represents a GRM or whether possibly an anhysteretic remanence (ARM) may account for it. From the results shown above, an ARM can be ruled out because it should be produced in all samples if a DC bias field exists in the instrument. The strongest indication is provided by the formation of a large quantity of magnetite in all tested samples during heating to 400 °C (e.g. Fig. 3b). This newly formed magnetite fraction should acquire a considerable ARM during the experiments shown in Fig. 9 beyond 400 °C, which is not the case.
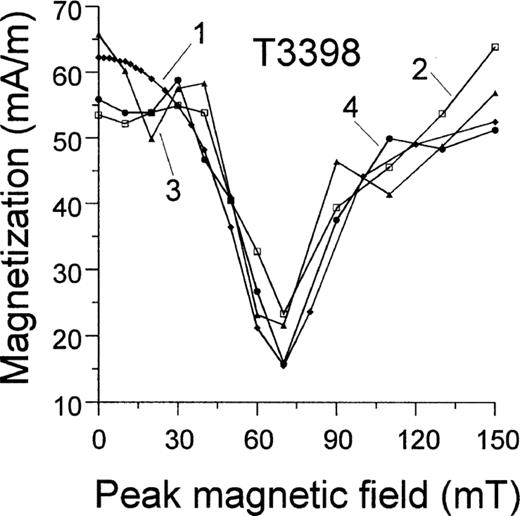
Repeated AF demagnetization cycles (Fig. 10) demonstrate that GRM acquisition can be reproduced. The sample in Fig. 10 has been demagnetized four times within one year. All curves are nearly identical. Such experiments were conducted for many samples, and all show the same result.
Repeated AF demagnetization for sample T3398. Curve number 1 denotes the initial demagnetization of NRM.
Correction For GRM
The method of Dankers & Zijderveld (1981) was used to extract the characteristic NRM. One sample was demagnetized along the z‐, y‐, x‐axes (in this order) in the same peak field, and the complete remanence was measured after demagnetization along each single axis. This procedure was repeated with higher AF peak fields up to 150 mT. When we take the remanence components measured after demagnetization along the last step (the x‐axis) for each peak field we get the normal demagnetization curve that shows an intensity increase at high fields due to GRM acquisition (Fig. 11a). For example, for 150 mT we measured the following components (in mA m−1):
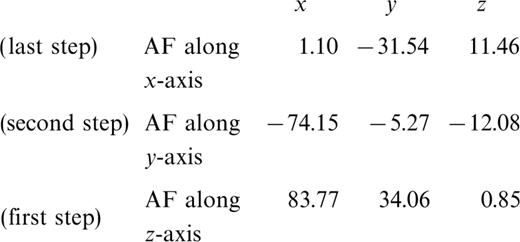
Note that, after each AF demagnetization procedure, GRM was always mainly perpendicular to the axis along which the AF demagnetization was conducted. Components of (3) include NRM and GRM, with main diagonal values (1.10, −5.27, 0.85) representing components of NRM (x, y, z). Subtracting NRM components from each line in (3) we obtain the GRM components:
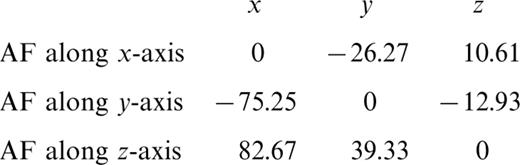
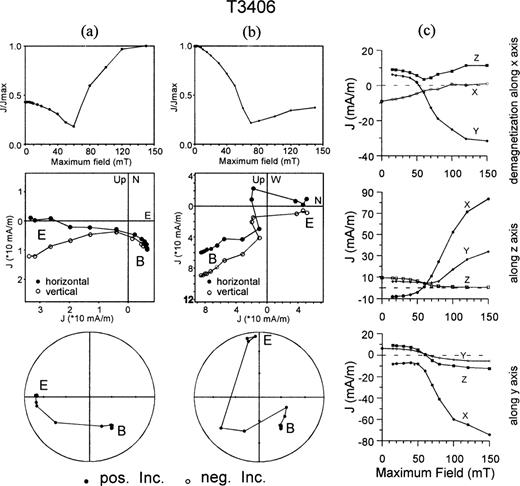
Comparing (4) with (1), we see a remarkable discrepancy in the y‐component of GRM. Correction does not completely remove the contribution of GRM. Still, a remanence increase occurs above 80 mT (Fig. 11b). The data measured after AF demagnetization along the z‐, y‐, x‐axes separately are shown in Fig. 11(c). Components x and z go to zero when AF demagnetization is conducted along the x‐ and z‐axes, respectively. In contrast, when AF demagnetization is executed along the y‐axis, the y component does not become zero. Probably, the −5.27 reading in (3) taken as the y‐component of NRM includes some GRM, which results in a big difference in the y column in (4).
GRM correction results using the method of Dankers & Zijderveld (1981). (a, b) Intensity curves, Zijderveld diagrams, and equal‐area projections for AF demagnetization. (a) before correction and (b) after correction. B, E indicate the starting and end points, respectively. (c) Individual components after partial demagnetization along single axes.
Several reasons could account for the failure of the GRM correction. First, the much higher GRM intensity as compared with the NRM may not be totally demagnetized to reveal the true NRM. Second, only perfect tumbling demagnetization can get the sample into a ‘cycling state’ (Stephenson 1993); in our case, the magnetic state of the sample may be different for z, y and x demagnetization directions. However, neither Dankers & Zijderveld (1981) nor Stephenson (1988) demagnetized their samples between different steps by tumbling. A further reason for the failure of the GRM correction might be that some GRM is also produced along the demagnetization direction (Stephenson 1981b, 1993; Roperch & Taylor 1986). Evidence for this can be found in our samples along the y‐axis (Fig. 11c) and will be developed further below (Fig. 12).
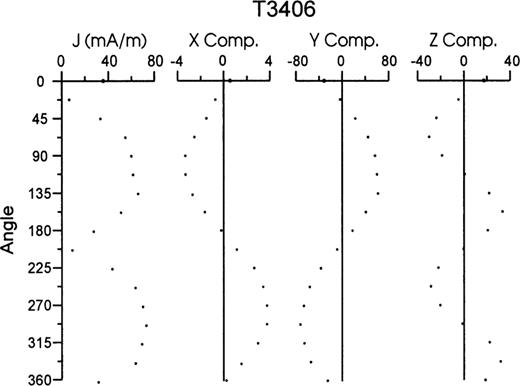
GRM acquisition (intensity and single components) for stepwise rotation of the sample coordinate system versus the instrument (measurement) system. An angle of 0 corresponds to the normal measurement position (see text).
Further GRM Experiments And Discussion
To check the anisotropy of the GRM‐acquired sample, the demagnetization sequence was systematically changed. However, the instrument coordinate system always coincides with the specimen system.After complete demagnetization at 150 mT, the GRM was measured. Results are given in Table 1.

No major GRM was acquired when y was selected as the final demagnetization direction, and GRM intensities were similar whether x or z was chosen as the last demagnetization direction. Regarding the fact that GRM is produced in the A×F direction and the intensity of GRM is zero for an angle of 0° or 90° between A and F, the maximum anisotropy of this sample should be parallel or perpendicular to the y‐axis. The parallel option can be excluded, because no major GRM should be produced, even with x or z as the last demagnetization direction. Only if maximum anisotropy is aligned approximately within the x–z plane, at an intermediate angle between the x‐ and z‐axis, can we explain that GRM of similar intensity is acquired whether the x‐ or z‐axis is demagnetized last and that no GRM is observed when the y‐axis is demagnetized last.
In a more detailed experiment, the AF field direction was varied within the x–y plane of the sample. To do this, the sample was rotated stepwise around the z‐axis by increments of 22.5° and after each rotation step an AF of 150 mT was applied along the x‐axis of the instrument coordinate system. The procedure is similar to those used by Stephenson (1981a) and Roperch & Taylor (1986). Results are shown in Fig. 12. An angle of 0° corresponds to demagnetization along the x‐axis of the sample, 90° to along the y‐axis, 180° to along the −x‐axis, etc. Zero values of GRM are expected when the AF axis is perpendicular or parallel to the axis of maximum anisotropy. This can be used to interpret the results in Fig. 12. If the maximum anisotropy axis is within the x–y plane, four GRM minima should appear (two parallel and two perpendicular directions of the maximum anisotropy axis with respect to the AF field). Only two minima are observed, indicating that the maximum anisotropy axis has to be apart from the x–y plane of the sample. In this case, the AF axis is never parallel to the maximum anisotropy axis but at two positions it becomes perpendicular to it. Using angles of maximum values of GRM in Fig. 12 as well as the corresponding GRM directions, maximum anisotropy is expected in an intermediate angle for all three sample axes. A detailed anisotropy analysis is not our intention here but will be considered for future investigations. Still, we have to be careful with quantitative conclusions. In particular, it is difficult to explain why the GRM is much higher along the samples’y‐axis than along the x‐direction, except for a few samples like the one in Fig. 11. The x–y plane corresponds to the bedding plane, and equal distribution of maximum anisotropy axes within this plane can be generally expected for a pure sedimentary fabric with no control over the azimuthal orientation, as in our drilling core; AMS measurements for a population of about 20 samples confirm that, in fact, such a sedimentary fabric is present. However, susceptibility is mainly dominated by the paramagnetic minerals and only anisotropy of remanence (ARM or IRM) may provide more information.
However, two other important results can be acquired from the test above. First, GRM (if we call such a component a GRM) can be produced even along the direction of the AF field. The x‐component in Fig. 12 is small, but shows a sinusoidal shape. Roperch & Taylor (1986) once observed that in the samples where the GRM vector is large with respect to the NRM, a small component of GRM can be significant along the axis of demagnetization. Stephenson (1981b) also found that a component can be present along the field axis, and explained it by the flip of a single‐domain particle moment whose internal energy is represented by a triaxial ellipsoid. Second, different amounts of GRM acquisition during routine demagnetization (see Fig. 7, and ‘GRM samples distribution’ in Fig. 1) may be explained by this test. For sample T3406, the NRM is 14.44 mA m−1, and the GRM acquired in 150 mT is 33.58 mA m−1. However, as the angle between the AF and the sample coordinate system is systematically changed, the GRM intensity at 150 mT reaches up to about 70 mA m−1. Depending on the angle between A and F, the GRM acquisition of a single sample could be zero or much larger than the NRM, although the magnetic properties of samples that have acquired the GRM are the same.
GRM is reported to be independent of the presence of a DC field and to be simply superposed on ARM acquisition, with direction and intensity comparable to that produced without the DC field (Roperch & Taylor 1986). An ARM acquisition experiment (Fig. 13) was carried out with both AF and DC (0.05 mT) fields, along the coil axis (DC field along −z). The total remanence acquired was found to be inclined to the z‐axis. This can be explained by an anisotropic acquisition of ARM or by a GRM acquisition independent of the presence of a direct field. This problem should be further investigated because it also affects studies of ARM anisotropy.
Intensity and single components of ARM during AF demagnetization (ARM acquired in a DC field of 50 μT along −z‐axis, see text).
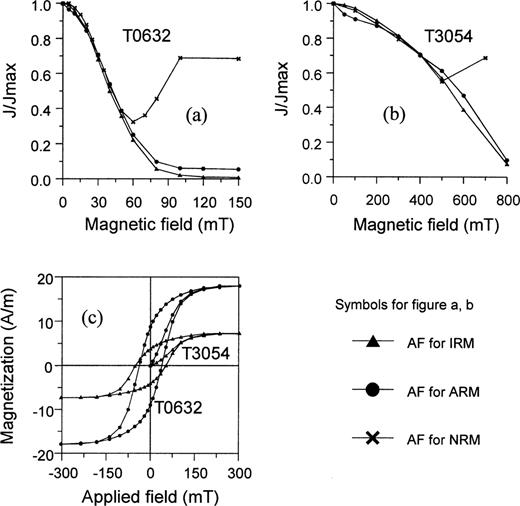
In another series of tests, NRM, ARM, IRM and GRM were compared with each other. The low‐field AF demagnetization behaviours of NRM, ARM and IRM are similar for the samples shown in Figs 14 (a) and (b). The demagnetization behaviours of NRM and GRM coincide as well (Fig. 10). From Figs 10 and 14, it can be concluded that the AF demagnetization behaviours of NRM, ARM, IRM and GRM are the same in our samples.
(a,b) Comparison of NRM, ARM and IRM demagnetization for two samples; (c) hysteresis loops for these two samples.
It is reported that RRM is magnetically harder than ARM, and is thus possibly confined to single‐domain (SD) particles with a high coercivity (Stephenson 1976; Edwards 1984). GRM is also reported to be confined to fine‐grained particles (Potter & Stephenson 1986; Stephenson 1993). If this is correct, it is likely that grain sizes of ferrimagnetic particles in our samples are in a SD state and quite homogenous, since AF demagnetization behaviours for different types of remanence are the same. Magnetically hard properties are confirmed by hysteresis measurements (using a VFTB instrument developed by Dr N. Peterson, Magnetic Measurements Ltd) shown in Fig. 14(c) (Mrs/Ms, Bc and Bcr for sample T3054: 0.48, 38.18 mT, 65.78 mT; for T0632: 0.48, 32.44 mT, 55.69 mT) and also confirmed by SEM as discussed above.
Conclusions
Summarizing the discussions above, we draw the following conclusions.
(1) Greigite is the dominant magnetic mineral and GRM carrier in the lacustrine sediments from the Zoigê Basin, eastern Tibetan Plateau. Small particles in a SD state are evidenced. Minor contributions from magnetite, haematite and pyrrhotite do not disturb the general rock magnetic observations.
(2) GRM is confirmed to be acquired mainly along the direction perpendicular to the AF axis. The fact that GRM intensities are mostly of the same order as NRM or even much higher can be explained by their dependence on the angle between the AF and maximum anisotropy axis.
(3) Small GRM acquisition (5 per cent of the total GRM) is found even along the demagnetization axis, which may lead to incomplete correction for GRM. Alternatively, higher GRM than NRM intensity, or static AF demagnetization (no ‘cyclic state’) may explain the failure of the GRM correction.
Acknowledgements
This work was funded by the Chinese Climbing Program and by Deutsche Forschungsgemeinschast (AP 34/10–1). The first author acknowledges financial support from Max‐Planck‐Gesellschaft. We wish to thank M. Hanzlik for the SEM and EDX work, M. Weiß for measuring hysteresis loops and G. Göltz for carring out low‐temperature IRM runs. We are grateful to M. J. Dekkers, I. Snowball and another, anonymous, reviewer for their stimulating comments.
References
