


Abstract
Although the role of place on health is not new, less is known about how place matters for cognition. By investigating both neighborhood and home as the sociospatial realms of older adults, we explore associations between health and place across multiple contexts. We also distinguish objective and subjective measures of place and disentangle their differential associations with cognition.
We analyzed place effects on cognition from the National Social Life, Health, and Aging Project (N = 2,260) linked to neighborhood characteristics and crime data. We measured place in four ways: (a) objective indicators of neighborhood such as police-reported crime rates and interviewer-reported on presence of disordered conditions on the streets; (b) perceptions of neighborhood by respondents (perceived danger and social cohesion); (c) objective conditions of home (interviewer’s report on presence of clutters, odor, and messiness); (4) perceived social support, strain, and threat by household members. The MoCA-SA was used to assess cognitive functioning.
Subjective interpretations appeared to have more direct effects on cognition than did objective indicators of neighborhood or home. When examining these living environments together, we found the association between neighborhood and cognition is partially explained by characteristics of home environment, especially perceived social support. We found a buffering effect of social support on cognition for women, not for men.
Late life living environments are important contexts for aging. Aging-in-Place interventions should address subjective interpretations of place to reduce future risks of cognitive decline.
Late life living environments are important contexts for aging because they can shape social opportunities, promote health and enhance competency, or create social strains and stress and increase risks of illness for older adults. A large body of prior work has examined whether and how place matters for successful aging of older adults. Communities, neighborhood, and home environment all have been linked to health and well-being from functioning to morbidity to mortality.
Despite prior work linking place to various health outcomes, the effects of place on cognitive functioning have been relatively ignored. Yet, there are theoretical reasons to believe context matters for cognition in later life based on research in younger adults (Lyke & Young, 2006) and animal studies (Kempermann, Kuhn, & Gage, 1997). Specifically, exposure to a socially enriched environment appears to confer cognitive benefits by stimulating learning, diversifying social resources, and increasing opportunities for social activities (Zunzunegui, Alvarado, Del Ser, & Otero, 2003). Exposure to a stressful environment may affect neurogenesis (McEwen, 1998), which plays a key role in memory function, providing a potential mechanism through which place may affect cognition. Given the effects of exercise on brain function in animal studies (Cotman & Berchtold, 2002), dangerous structural conditions of the neighborhood may influence cognition if people living in these environments are less likely to use outdoor space for physical activities.
The literature on the effects of place on cognition in later life has focused almost exclusively on characteristics of objective neighborhood context such as crime, access to amenities, and built environment (Clarke, Weuve, Barnes, Evans, & Mendes de Leon, 2015; Lee, Glass, James, Bandeen-Roche, & Schwartz, 2011; Wight et al., 2006). Virtually no attention has been paid to the household, although most of the time of older adults is spent in their home (Iwarsson et al., 2007). Despite the contribution of earlier work linking place to cognition, very little research has explicitly examined the association between subjective interpretations of place and cognitive functioning. Because objective neighborhood context and neighborhood perceptions are linked yet distinct constructs, it is important to distinguish their differential impacts on cognition.
In this study, we begin to fill the gap in our knowledge of the role of characteristics of the neighborhood and the home environment as late life living environments. We seek to investigate the mechanisms through which place—neighborhood and home both separate and together—acts on cognition and assess the extent to which objective and subjective measures of place reinforce, complement, or conflict with each other.
Background
Aging in Context: Neighborhood and Home Environments
A number of studies have now shown that features of place are important predictors of health among the elderly adults. The Disability model by Lawton (1983) outlines the ways that individuals interact with their environments and stresses the importance of the environment in determining the well-being of older adults. Research on the built environment illustrates the effect of decay, such as vandalism and poorly maintained streets, on older adults’ physical activity; living in these kinds of neighborhoods has been associated with greater functional limitations that impair mobility, which may, in turn, lead to limited social interaction (Glass & Balfour, 2003; Rosso, Auchincloss, & Michael, 2011). Evidence based on Sampson and colleagues’ concept of concentrated disadvantage (Sampson, Raudenbush, & Earls, 1997), as well as social disorganization theory (McKay & Shaw, 1969), suggests that concentrated disadvantage (e.g., a combination of high poverty rates, high crime, high minority composition, low socioeconomic status in residential areas) affects the health and well-being of older adults through daily worries about danger in that neighborhood. This prior work emphasizes that living in disordered neighborhoods may affect health through its impact on increased feelings of vulnerability and discomfort that may in turn influence social resources and opportunities.
In addition to neighborhood, others have argued physical conditions of the home environment (e.g., presence of clutter, mess, and disrepair) as another key context that influences health. Although overlooked in the literature of aging in place, a few studies argued that the home environment should be addressed because it may have more direct effects on health due to its proximity to daily lives (Iwarsson et al., 2007). The typical empirical approach to the home environment and health relationship has focused on the impact of the social environment at home, as indexed by absent social support or household composition (Seeman, Lusignolo, Albert, & Berkman, 2001; van Gelder et al., 2006). However, a recent paper by Brenner & Clarke (2016) showed that those living in cluttered homes faced higher risks of disability, highlighting the importance of considering the physical environment at home as a potential contributor to health. Similarly, Pynoos, Rose, Rubenstein, Choi, & Sabata (2006) indicated that living in homes with hazards such as poor lighting, clutter, and uneven floors may influence the risk of falling injuries. Although there has been strong evidence on the beneficial effects of social integration on cognition (for a review, see Fratiglioni, Paillard-Borg, & Winblad, 2004), we understand little about the effect of the physical characteristics of the home on cognition. This paper begins to fill this gap.
Collective Measurements of Place: Integrating Objective and Subjective Measures in Neighborhood Together with the Home Environment
Although a large volume of research examines the role of the structural conditions of place on health, less attention has been paid to the mechanisms through which perceptions of place affect health. Most existing research fails to distinguish objective environmental indicators, such as police-reported crime rates from respondents’ subjective interpretations of those crime statistics through their fear of crime. In fact, these measures have been used interchangeably as proxies for environmental disorder. Evidence suggests, however, that perceptions of one’s neighborhood matter for health. For example, Wen, Hawkley, & Cacioppo (2006) found that perceptions of neighborhoods have more direct effects on health than objective indicators themselves. Latkin & Curry (2003) showed that neighborhood violent crime is associated with depressive symptoms through perceptions of neighborhood disorder and previous experiences of violence. Despite ready evidence of the link between health and place (especially neighborhood environment), little research has evaluated the relative implications for cognition of the objective environment and subjective perceptions of place. Simultaneous examination of both objective and subjective measures is needed to advance our knowledge about how place affects cognition.
In addition, previous studies promoting “aging in place” have largely examined place at one level and overlooked the intersection of neighborhood and home and their separate and interdependent influences on health. Changes common during aging, such as retirement, mobility challenges, and loss of confidants, often leave older adults more spatially confined to and reliant on their neighborhood and especially home than younger people (Glass & Balfour, 2003). There are, however, relatively a few studies considering both neighborhood and residence as nested contexts that encompass older adults’ daily life activities and experiences. Instead, prior work tended to account for household characteristics merely as covariates when neighborhood was considered as the key proximal environment. Only a few recent studies have examined the independent effects of both contexts (neighborhood and home) on later life health outcomes including functional decline (Schafer & Upenieks, 2015) and psychological distress (Upenieks, Schafer, & Iveniuk, 2016). Because disordered conditions on the street may be a mechanism that results in disorder in the home (Cornwell, 2014), the authors argued that both home and neighborhood should be considered as a “layered context.” Despite their findings about neighborhood effects of health through confines of the home, no study to date has examined the links between characteristics of place and cognition.
Conceptual Framework
Figure 1 presents our conceptual framework of the links between place and cognition. As seen in Figure 1, we consider both neighborhoods and homes as the sociospatial realms that act as environmental stimuli that affect cognition through their influences on social resources and opportunities. Incorporating insights from research that illustrates the role of perceived social isolation (i.e., loneliness) on one’s cognitive capacity (Cacioppo & Hawkley, 2009), we argue that social disintegration or isolation generated by pronounced levels of disordered conditions in living environments may be a key mechanism consequential for cognitive functioning. Cacioppo & Hawkley (2009) explain that social isolation might lead to elevations in inflammatory responses in the brain, reductions in social stimulation, and decreases in cognitive resources, the result of which may lead to cognitive impairment. In each neighborhood and home environment, we distinguish objective indicators of these characteristics from those perceived by each older person. Following prior work (Cornwell & Cagney, 2014), we consider the disordered conditions of place as rated by trained observers as objective indicators. Social context of place characterized by social relations in it was considered as subjective measures of place (detailed in Figure 2). We hypothesize that the neighborhood and home environments are independently associated with cognition (hypothesis 1). We also hypothesize that, within each context, objective measures may affect cognition through subjective perceptions (hypothesis 2) and that cognitive functioning may be more strongly affected by the home environment, the more proximal environment, than by neighborhood as the more distal environment (hypothesis 3).
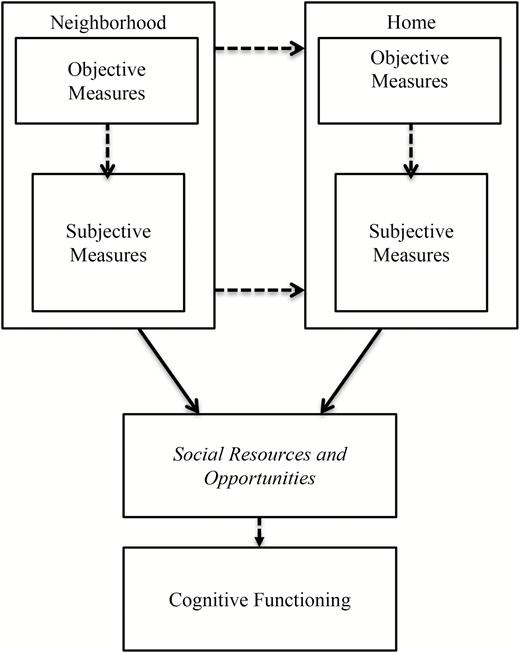
Conceptual framework. Solid-lined arrows represent the mechanisms previously examined in the literature. Dotted arrows indicate the potential mediating pathways that have been largely overlooked in prior work but we propose to examine in the current study. While not explicitly tested due to multicollinearity issues, italicized font is included here to illustrate the relationships between disordered conditions of place and cognitive functioning in the theoretical model.
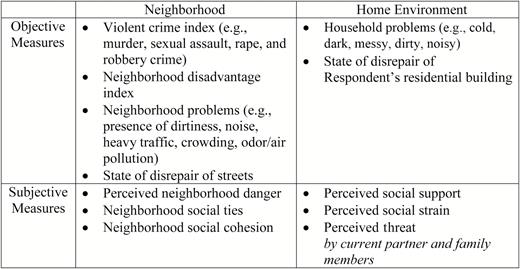
Objective versus subjective measures of place.
This study overcomes the limitations of previous research in three ways: (a) the use of the integrated approach of aging in place—measured by both neighborhood and homes; (b) the assessment of cognition in context using a nationally representative sample; and (c) the investigation of the layered pathway of perceived characteristics as potential mechanisms for the effect of objective measures of place on cognition (both in neighborhood and home).
Methods
Study Sample
We used the second wave of the National Social Life, Health, and Aging Project (NSHAP) collected in 2010 and 2011. NSHAP is a nationally representative survey of community-dwelling older adults in the United States born between 1920 and 1947 (aged 57–85 at the time of the Wave 1 interview collected in 2005 and 2006). The NSHAP data include individual demographic factors as well as a wide variety of health outcomes. One useful feature of these data is that they also include an array of social dimensions of aging in various environments, measured both by respondents and field interviewers. This allows for a more developed analysis of how context shapes social life and affects health outcomes in later life. Detailed information on the study objectives and design have been published elsewhere (O’Muircheartaigh, English, Pedlow, & Kwok, 2014).
We merged NSHAP Wave 2 with the FBI Uniform Crime Report (UCR) and the 2006–2009 American Community Survey (ACS) to obtain census-tract level geocoded information on crime and neighborhood socioeconomic characteristics. The full sample of respondents available in NSHAP W2 was 2,260.
Measures
Dependent Variable—Cognitive Function (MoCA-SA)
Cognitive function was measured using the MoCA-SA (Shega et al., 2014). This measure is based on the Montreal Cognitive Assessment, a screening tool developed for clinical settings to distinguish mild cognitive impairment and early dementia from normal cognitive function (Nasreddine et al., 2005). This measure was adapted after extensive testing for administration by nonmedically trained personnel (e.g., field interviewers) during an in-home, face-to-face interview. The 18 items of MoCA-SA are: (a) Orientation: date and month (2 points total); (b) Executive function: abstraction—similarity of watch and ruler (1 point), modified Trails-b (1 point); (c) Visuospatial skills: clock—contour, numbers, and hands (3 points total); (d) Memory: 5-word delayed recall (5 points); (e) Attention: forward digits (1 point), backward digits (1 point), subtract 7 s (3 points); and (f) Language: naming rhinoceros (1 point), phonemic fluency—words with the letter “F” (1 point for > 10 words in 60 s), and sentence repetition (1 point) (e.g., see Shega et al., 2014 and Kotwal et al., 2015 for more detailed information on this measure). MoCA-SA scores range from 0 to 30, with higher scores indicating better cognition.
Independent Variables—Objective Versus Subjective Measures of Place
As presented in Figure 2, two domains of disordered environments were investigated: neighborhood and home. In each domain, we constructed objective and subjective measures that identify unique features of structure and social–dynamic aspects of the living space.
Objective measures of neighborhood included four indexes: (a) violent crime from FBI UCR; (b) neighborhood disadvantage index from ACS; (c) neighborhood physical disorder index; and (d) built environment (street disrepair). Both crime and the disadvantage index were measured at census-tract level. We constructed a composite variable of violent crime that includes murder, sexual assault, rape, and robbery crime indexes. We constructed the neighborhood disadvantage measure by standardizing and summing the following items: (a) percent poverty; (b) percent educational attainment (less than high school); (c) percent unemployed; (d) percent female-headed household; and (e) percent of households receiving public assistance. To construct a scale of neighborhood physical disorder, we used five items assessed by NSHAP interviewers that capture the extent of problems or disorder on the street (one block, both sides) on which respondents lives, including presence of dirtiness, noise, heavy traffic, density, and odor/pollution. Following previous work (Cornwell & Cagney, 2014), we combined these five items as a marker of neighborhood problems. Interviewers also described the extent of disrepair of the buildings on the respondent’s block face.
Subjective measures of neighborhood consisted of three indexes: (a) neighborhood danger; (b) neighborhood social ties; and (c) neighborhood social cohesion. Each index was based on whether respondent perceived their local areas as dangerous, socially tight knit, and/or cohesive. Local areas in NSHAP Wave 2 were defined as “everywhere within a 20-minute walk or within about a mile of your home.”
To construct objective measures of the home, we used the field interviewers’ evaluations of the physical conditions and ambiences of the respondent’s living space. To measure subjective measures of the home, we summed and averaged the respondent-reported items that captured the degree of perceived social support, strain, and threat by household members. Full text of all items used to construct the scales and summary statistics can be found in Table 1.
Summary Statistics of Key Variables (n = 2,260)
| Variable name | Cronbach’s α | Proportion/meana | SD |
|---|---|---|---|
| Dependent variable | |||
| MoCA-SA | 22.55 | 4.37 | |
| Neighborhood environment | |||
| Objective measures | |||
| Violent Crime Index (tract-level assault, murder, rape, robbery) | 0.69 | 98.02 | 5.03 |
| Neighborhood Disadvantage Index | |||
| Percent poverty; percent < high school; percent unemployed; percent female-headed household; percent public assistance | 0.75 | ||
| Neighborhood problemsb | 0.71 | 1.90 | 0.82 |
| Clean → Full of litter or rubble; Quite → Noisy; No traffic on the street → Heavy traffic; Buildings/house are close together → buildings/houses are far apart; no smell or air pollution → strong smell or air pollution | |||
| Street disrepairc | |||
| How well-kept are most of the buildings on the street (one block, both sides) where the respondent lives? | 1.60 | 0.70 | |
| Subjective measures | |||
| Perceived neighborhood dangerd | 0.81 | 2.38 | 0.89 |
| How much do you agree the following statement about your local areae… | |||
| Many people in this are afraid to go out at night. | |||
| There are places in this area where everyone knows “trouble” is expected. | |||
| You’re taking a big chance if you walk in this are alone after dark. | |||
| Perceived neighborhood social cohesiond | 0.68 | 2.70 | 0.57 |
| How much do you agree the following statement... | |||
| This is a close-knit area. | |||
| People around here are willing to help their neighbors. | |||
| People in this area generally don’t get along with each other. | |||
| People in this area don’t share the same values. | |||
| People in this area can be trusted. | |||
| Perceived neighborhood social tiesf | 0.76 | 1.47 | 0.72 |
| How often do you and people in this area... | |||
| Visit in each other’s homes or when you meet on the street? | |||
| Do favors for each other? | |||
| Ask each other for advice about personal things? | |||
| Home environment | |||
| Objective measures | |||
| Home environment problemsb | 0.85 | 1.92 | 0.81 |
| Clean → Dirty; Neat/Tidy → Messy; Quite → Noisy; Cramped →Spacious; Very clutered → Not cluttered at all; Pleasant smell → Strong smell | |||
| Residential building disrepairc | |||
| How well-kept is the building in which the respondent lives? | 1.51 | 0.74 | |
| Subjective measures | |||
| Perceived social supportg | 3.19 | 0.74 | |
| How often can you … | |||
| Open up to current partnerh and family members? | |||
| Rely on current partner and family members? | |||
| Perceived social straing | 1.85 | 0.61 | |
| How often do your current partner and family members… | |||
| Make too many depends on you? | |||
| Criticize you? | |||
| Perceived threatg | 1.12 | 0.31 | |
| How often have you felt threatened or frightened by current partner and family members? | |||
| Covariates | |||
| Age | 71.42 | 8.15 | |
| Female | 52.05 | ||
| Race/ethnicity | |||
| White, non-Hispanic | 80.79 | ||
| Black, non-Hispanic | 9.92 | ||
| Hispanic | 6.79 | ||
| Others | 2.50 | ||
| Attended College | 58.2 | ||
| NSHAP Comorbidity Indexi (number of chronic conditions ever diagnosed, range = 0, 16) | 2.60 | 1.87 | |
| Depression at Wave 2 (CES-D-ml) | 14.77 | 2.76 | |
| Physical Health at Wave 2 (1= poor or fair; 0 = good to excellent) | 25.12 | ||
| Cognitive Function at Wave 1 | 0.58 | 0.77 | |
| Residential tenure (1 = 6 years or more; 0 = less than 6 years) | 84.46 | ||
Note: CES-D-ml = Center for Epidemiological Studies of Depression scale, minus the loneliness item; MoCA-SA = Montreal Cognitive Assessment Survey Adaptation; NSHAP = National Social Life, Health, and Aging Project.
aSurvey-adjusted and weighted for the probability of selection, with poststratification adjustments for nonresponses. bScale of interviewer’s responses range from 1 to 5. The direction of arrow indicates the higher scores of each item. cScale of responses range from 1 = “very poorly kept (needs major repairs),” 2 = poorly kept (needs minor repairs),” 3 = “fairly well kept,” 4 = “very well kept. dScale of responses range from 1 = “strongly agree,” 2 = “agree,” 3 = “neither agree nor disagree,” 4 = “disagree,” 5 = “strongly disagree. eLocal area was defined as everywhere within a 20-min walk or within about a mile of your home. fScale of responses range from 1 = “often,” 2 = “sometimes,” 3 = “rarely,” 4 = “never.” gScale of responses range from 1= “never,” 2 = “hardly ever or rarely,” 3 = “some of the time,” 4 = “often.” hCurrent partner includes either spouse or romantic partner. iConditions included: (a) arthritis; (b) stomach or peptic ulcers; (c) emphysema, bronchitis, or lung disease; (d) asthma; (e) stroke, blood clot, or bleeding in the brain; (f) high blood pressure or hypertension; (g) diabetes or high blood sugar; (h) Alzheimer’s disease or other form of dementia; (i) cirrhosis, or serious liver damage; (j) HIV/AIDS; (k) leukemia or polycythemia vera; (l) lymphoma; (m) skin cancer (including melanoma, basal cell carcinoma, and squamous cell carcinoma; (n) cancer, other than skin cancer, leukemia, or lymphoma; (o) poor kidney function; and (p) thyroid problems.
Covariates
Baseline demographic characteristics included age, gender, race/ethnicity, educational attainment, and residential tenure. Age was included as a quadratic term as it shared a nonlinear relationship with cognitive function. Gender was coded as female (=1) with male as the reference group. Race/ethnicity was self-reported and categorized as Non-Hispanic White (=reference group), Non-Hispanic African American, Hispanic, and Others. Educational attainment was measured with attended college or more (=1; otherwise=0). Because we believe that neighborhood effects may operate differently by length of residence, we controlled for residential tenure (“living in the same local areas” for 6 years or more=1; otherwise=0).
In addition, several health conditions were controlled as covariates, including prior cognitive function, depressive symptoms, chronic disease burden, and self-reported physical health. Prior cognitive function was measured at Wave 1, while other measures were from Wave 2. Evidence suggests that cognitive impairment and depression may affect how individuals perceive things around them (Reichman & Negron, 2001). We assessed cognition at Wave 1 using a 10-item Short Portable Mental Status Questionnaire (SPMSQ) (Pfeiffer, 1975) because MoCA-SA was only introduced in Wave 2. Depressive symptoms were assessed in Wave 2, using an adaptation of the Center for Epidemiological Studies-Depression (CES-D) scale minus loneliness (Payne, Hedberg, Kozloski, Dale, & McClintock, 2014). For chronic disease burden, we controlled for the NSHAP comorbidity index that included 15 prevalent health conditions in older adults, detailed elsewhere (Vasilopoulos et al., 2014). Self-reported physical health was dichotomized into “Fair/Poor” (coded = 1) versus “Excellent/Very Good/Good.”
Analytic Analysis
We employed both additive and mediation analyses to assess the impact of contextual factors on cognition. Specifically, the additive model predicts that neighborhood and home environments each are associated with cognition. The mediation analysis assesses the extent to which perceptions (subjective measures) of each context explain the association between structural conditions (objective measures) and cognition.
In Model 1, we included objective measures of neighborhood together with individual demographic characteristics and health conditions. In Model 2, we added subjective measures of neighborhood to test if perceptions explain the effect of objective measures on cognition. In Model 3, we switched gears and examined the independent effects of the home environment by fitting its objective measures such as messiness and ambience of respondent’s residence. In Model 4, we added subjective measures of the home environment as we did in Model 2. In Model 5, we added both objective and subjective measures of each context to test whether neighborhood characteristics retained an independent effect on cognition above and beyond the effects of the home environment and individual characteristics.
We fit OLS linear regression models for MoCA-SA. NSHAP uses a multistage area probability design based on a nationally representative, population-based sample of older adults. In the current study, all analytical models were adjusted for design effects with survey weights employed (STATA 14).
Results
Descriptive statistics for variables used in this study, shown in Table 1, are weighted and adjusted for survey design. The mean of the MoCA-SA was 22.6, in the normal range but just slightly above the cutoff for mild cognitive impairment, which was 22 (Kotwal, Kim, Waite, & Dale, 2016). Respondents on average lived in neighborhoods with violent crime rates (98.02) slightly lower than the national level (100). They were on average likely to live in socioeconomically moderate neighborhood disadvantage level (the mean of each percentage fell around the median value, data not shown). They perceived their proximal environments as more cohesive and supportive than dangerous or threatening. Almost 60% of respondents attended college. Older adults appeared to choose to age in place. Only 15% of respondents moved over the 5-year period (between Wave 1 and Wave 2).
Table 2 shows results for multivariate models estimating the effects of place on cognition. We began by examining the models for neighborhood characteristics. Model 1 shows that individuals living in neighborhoods with poor built environment (street disrepair) have lower scores on the MoCA-SA than others (b = −0.42; p < .05). We see an inverse association between violent crime and cognition but there was a threshold effect such that only high levels of violent crime were associated with worse cognitive function (b = −0.39; p < .05). Neither neighborhood disadvantage nor presence of disorder on the street was associated with cognition. The addition of perceptions of neighborhood in Model 2 decreased the effect of street disrepair to −0.37 (p < .05) and also reduced the effect of violent crime to insignificance. For instance, we found that higher levels of perceived neighborhood danger were associated with lower cognitive function (b = −0.71; p < .05). Conversely, respondents living in neighborhoods that they perceive as cohesive (b = 0.33; p < .05) and socially tight knit have higher cognitive performance, although the latter effect is not statistically significant.
Multivariate Regressions Results of Objective and Subjective Measures of Place on Cognition
| Variables/Model | Model 1 | Model 2 | Model 3 | Model 4 | Model 5 | Model 6 | ||||||
|---|---|---|---|---|---|---|---|---|---|---|---|---|
| NEIGHBORHOOD CHARACTERISTICS | ||||||||||||
| Objective measures | ||||||||||||
| Violent crime (low = ref.) | ||||||||||||
| Medium | −0.24 | −0.26 | −0.32 | −0.34 | ||||||||
| High | −0.39 | * | −0.31 | −0.14 | −0.14 | |||||||
| Neighborhood disadvantage | −1.97 | −0.42 | −2.14 | −2.46 | ||||||||
| Neighborhood problems | −0.01 | 0.09 | 0.23 | 0.22 | ||||||||
| Street disrepair | −0.42 | ** | −0.37 | * | −0.29 | −0.28 | ||||||
| Subjective measures | ||||||||||||
| Perceived danger | −0.71 | *** | −0.65 | *** | −0.65 | *** | ||||||
| Social cohesion | 0.33 | * | 0.35 | 0.34 | ||||||||
| Social ties | 0.09 | 0.05 | 0.04 | |||||||||
| HOME ENVIRONMENT CHARACTERISTICS | ||||||||||||
| Objective measures | ||||||||||||
| Home problems | −0.49 | * | −0.30 | −0.25 | −0.24 | |||||||
| Residential building disrepair | −0.02 | −0.21 | −0.02 | −0.07 | ||||||||
| Subjective measures | ||||||||||||
| Social support | −0.33 | * | −0.31 | * | −0.69 | ** | ||||||
| Social strain | 0.31 | 0.27 | 0.25 | |||||||||
| Threat | −0.63 | −0.46 | −0.50 | |||||||||
| Social support × Female | 0.65 | * | ||||||||||
| Covariatesa | X | X | X | X | X | X | ||||||
| Constant | 16.83 | * | 15.38 | * | 18.69 | * | 29.64 | * | 26.19 | * | 28.50 | * |
Note: aCovariates include age, female, race/ethnicity, educational attainment, comorbidity at Wave 2, cognitive functioning at Wave 1, depressive symptoms at Wave 2, physical health at Wave 2, and residential tenure.
*p < .05. **p < .01. ***p < .001.
Next, we tested the extent to which the home environment is independently associated with cognition. In Model 3, we found living in a cluttered home, was negatively associated with cognition (b = −0.49; p < .05) but a state of disrepair in residential buildings was not. In Model 4, the effect of ambient hazards in the home on cognition was eliminated when perceptions of social support, strain, and threat in the home environment were added. In Model 5, when examining both the neighborhood and home as living environments, we observed the unique importance of the home as the proximal context of late life living environments. For example, the addition of characteristics of the home environment eliminated the effect of street disrepair and reduced the effect of perceived danger on cognition. Although perceived social support appeared to worsen cognitive performance in Model 4 and 5, the addition of an interaction term between social support and gender in Model 6 confirmed that the effect of social support on cognition appears only for women (b = 0.65; p < .05), not for men (illustrated in Supplementary Appendix 1).
Among covariates, non-White minorities, educational attainment less than college, higher levels of depressive symptoms, self-reported poor health, and lower levels of cognitive function at Wave 1 were associated with lower cognitive functioning at Wave 2. These associations were statistically consistent throughout the models (Supplementary Appendix 2). We performed sensitivity analyses to test for the significance of the reduction in the coefficients in the mediation analyses (Hicks & Tingley, 2011). We confirmed that the effects of objective indicators (street disrepair in Model 2 and home problems in Model 4) on cognition operate through subjective interpretations of place (perceived danger in Model 2 and social support in Model 4). We also confirmed that the effect of perceived danger on cognition operated through social support in Model 5.
Discussion
Healthy cognition is critical for “successful aging” (Rowe & Kahn, 1997). Cognitive function is closely related to maintenance of everyday competence and social dimensions of aging. Despite prior work linking place to health, cognition in context has been relatively ignored. Previous work on “aging in place” has largely focused one type of place and has overlooked the separate contexts of neighborhood and home and their distinct yet interdependent influences on cognition. Very little research has separated the effects of objective indicators from subjective interpretations of place, although some evidence suggests that features of structure on cognition may operate through their impacts on social–dynamic aspects of the living space. This study built on previous research by exploring the processes through which place affects cognition. We posit that an association between measures of place (objective and subjective) and cognitive functioning may be attributable to fewer opportunities for social contact and quality relationships that may arise because of limited mobility in disordered neighborhoods and households.
Five main results have been obtained in our study. First, we found place matters for cognition as it does for other health outcomes examined in prior work. Second, the effect of objective indicators of place on cognition appeared to operate primarily through the effect of subjective interpretations of place. This corroborates prior work that argues that assessments of the effect of place, primarily measured by objective indicators, on health may paint an incomplete and misleading picture if perceptions of place are not taken into account (Ellen, Mijanovich, & Dillman, 2001; Golant, 2011). Third, we observed the unique importance of the home as the proximal context of late life living environments. Conditions of neighborhood and home independently influenced cognition. Fourth, accounting for conditions of the home environment partially explained the adverse effect of neighborhood disorder (perceived danger) on cognition. This suggests that characteristics of the home environment may be a mechanism through which conditions of neighborhood affect cognition. Fifth, the influence of perceived social support on cognitive functioning is to some extent different between men and women. Social support was protective in women but not in men.
What mechanisms might link characteristics of place to cognition? First, place could act on cognition through psychosocial pathways. Living in a place that residents perceive as stressful or dangerous may increase feelings of fear and vulnerability that lead older people to withdraw from public space. Social isolation accompanied by withdrawal from public space may lead to increased feelings of loneliness, which has a negative impact on cognitive stimulation (Cacioppo & Hawkley, 2009). Decrease in use of public space may also lead people to engage in sedentary activities. Less engagement in physical activities may increase risk of obesity and hypertension, both of which have been linked to cognitive impairment (Duron & Hanon, 2008). Second, physiological mechanisms through which stress affects the brain may be a pathway through which stress-inducing place matters for cognition. For example, McEwen (1998) emphasized that stress may favor neurodegenerative processes, which crucially influences memory function. Third, Attention Restoration Theory (ART) (Berman, Jonides, & Kaplan, 2008; Kaplan, 1995) may provide a potential explanation for why exposure to disordered environments has a detrimental effect on cognitive functioning. According to this theory, processing of visual disorder (i.e., clutters, decay, traffic) in the brain may overload cognitive capacity by thinking how to protect from the disorder (i.e., to avoid being hit by a car), which may in turn fatigue cognitive resources and subsequently affect attention function. Fourth, cognitive reserve models could also account for how socially supportive places affect cognition. The cognitive reserve model is often used to explain how aspects of life such as education may protect against dementia and Alzheimer’s disease by increasing skills or repertoires of coping strategies that conserve cognition (Tucker & Stern, 2011). Building on this model, one may expect that active participation in social activities may benefit cognition in large part through high levels of social contacts and integration that demand more attention and produce continued mental stimulation, thereby delaying onset of cognitive impairment. Our findings suggest that living environments perceived as socially competent with a sense of “livable” community may serve as cognitively stimulating environment.
One key finding in this study is gender differences in conditioning the role of social support on cognition. The possible explanation is that women and men experience different amount of social relations and perceive social life differently. In lieu of reciprocity in social relationships, married women may give more whereas men receive more social support (Waite & Gallagher, 2002). Accordingly, the amount of support that married men receive may reduce their need to manage their social relationships and support when women give so much support. Inclination to unequal social relations may lead to “disuse” of social activities, which may result in “atrophy” of cognitive skills and processes. According to the concept of “use it or lose it” (Salthouse, 2016), once the atrophy point has been reached, the brain experiences less stimulation, which may lead to increased risk of poor cognitive performance and neurodegenerative disease.
One of the strengths of this study is that we extend the concept of sociospatial realms of older adults. This decision was informed by insights from the study of “activity space,” where activity space is defined as the collection of “those places and spaces in which one engages in routine activities” (Cagney, Browning, Jackson, & Soller, 2013). Building on disablement models that identify physical conditions of the home environment as an important context for later life functioning (Iwarsson et al., 2007), we elected to assess neighborhood together with home environment as later life immediate environments. Our finding—the independent effects of neighborhood and home on cognition—clarifies possible sources of contextual risks in cognition. Another strength is that we observed that conditions of place—objective versus subjective—in which health takes shape are interdependent or confluent. Although our findings are in agreement with previous reports that results might be biased without distinguishing objective from perceived factors of neighborhood (Lin & Moudon, 2010; Weden, Carpiano, & Robert, 2008), no study examines the association in the context of home. To our knowledge, the current study is one of the first large, population-based studies assessing both objective and subjective measures of place and disentangling their differential impacts on cognition.
Our study has several limitations. First, though environmental disorder is often presumed to elicit stress and to trigger its various manifestations, aspects of place may also respond to an individual’s health. Longitudinal study design will allow testing reverse causality or bidirectionality. Second, cognitive function was measured differently in each wave. Because we believe that poor cognition affects the ways in which people perceive and respond to surroundings, we elected to control for prior cognition measured in Wave 1. Third, the study was cross-sectional; causal pathways cannot be determined. Fourth, given that the primary sampling unit of NSHAP is the metropolitan/county level, multilevel modeling was not feasible due to insufficient clustering at the tract level.
We conclude that place indeed matters for cognition. We provide evidence that regular upkeep of the immediate living environments has beneficial effects of maintaining cognitive function in later life. Our findings suggest that context-specific assessments may foster the early identification and facilitate treatment of cognitive health problems. Further, targeting older people living in poorly built environments with presence of residential hazards may be a key component of promoting aging autonomously in context. Promoting leisure activities such as volunteering and civic engagement may be beneficial for those in such vulnerable context because it may dampen the effects of environmental stress on social behaviors and subsequently cognition.
Supplementary Material
Supplementary data are available at The Gerontologist online.
Funding
This research was supported by funding from the National Institutes of Health including the National Institute on Aging (R37AG030481, R01AG033903, R01AG048511, T32AG000243, P30AG012857). The funders had no role in the design and conduct of the study; collection, management, analysis, and interpretation of the data; or preparation, review, and approval of the manuscript.
Conflict of Interest
The authors do not have any conflicts of interest to disclose.
References

