


Abstract
A major challenge in genetic studies of complex diseases is to determine how the action of risk genes is restricted to a tissue or cell type. Here, we investigate tissue specificity of gene action using CRISPR screens from 786 cancer cell lines originating from 24 tissues. We find that the expression pattern of the gene across tissues explains only a minority of cases of tissue-specificity (9%), while gene amplification and the expression levels of paralogs account for 39.5% and 15.5%, respectively. In addition, the transfer of small molecules to mutant cells explains tissue-specific gene action in blood. The tissue-specific genes we found are not specific just for human cancer cell lines: we found that the tissue-specific genes are intolerant to functional mutations in the human population and are associated with human diseases more than genes that are essential across all cell types. Our findings offer important insights into genetic mechanisms for tissue specificity of human diseases.
Introduction
This article examines why mutations present in every cell of the body cause disease that appears to be specific to a tissue or cell type. A major challenge facing the genetic analysis of complex diseases is that the function of risk genes often appears to be nonspecific, making it difficult to see how genetic variants could give rise to the disorder. For example, many genes associated with autism spectrum disorder (ASD) are transcription and chromatin regulators (Ben-David and Shifman 2013; De Rubeis et al. 2014) that have functions in every cell (such as cellular differentiation), yet the social and cognitive deficits of ASD are attributed to the dysfunction of neurons (Parikshak et al. 2013; Willsey et al. 2013), cells that are only found in the brain.
It is frequently assumed that the specificity of effect is due to differences in the pattern of transcript abundance: disease genes are either expressed only or at relatively higher levels in a subset of cells so that a mutation’s consequences are limited to this subset. However, while this may be true in some cases, there are many disease genes expressed widely throughout the body, at high levels, which do not show tissue-specific expression (Hekselman and Yeger-Lotem 2020). In a comprehensive analysis of the expression of rare disease genes, 64.5% of disease genes were ubiquitously expressed (in 20 or more tissues), and only 52% of the genes were upregulated in the affected tissues (Feiglin et al. 2017). In such cases, what might explain the apparent specificity of genetic action?
Here, we report analyses to identify mechanisms responsible for specificity. Our study takes advantage of genome-wide screens for the effect of loss-of-function mutations across hundreds of cancer cell lines. While we do not study cells in healthy tissues, many of the basic functions and genetic interactions are preserved in cell lines. The cancer cell lines are derived from tumors that originated from different tissues (or cell lineages), thus representing in our experiments a “tissue.” We define “specificity” with a measure of how essential a gene is to a tissue. In brief, an essential gene is one that the cell line cannot survive without, so a mutation in a gene with specific effects will affect cells from only a single or a few tissues.
By dividing the cell lines into different tissues of origin, we identify 1,274 genes that are significantly more essential in specific tissues and term them tissue-specific genes. As predicted from our hypothesis that our findings are relevant to healthy tissues and human diseases, we found that tissue-specific genes are intolerant to functional mutations in the human population and are associated with human diseases more than genes that are essential across all cell types (i.e. nonspecific). Our analysis shows that in only a minority of cases, tissue specificity is accompanied by preferential expression (PE) in the vulnerable cells. Instead, genetic interactions with paralog genes and other mechanisms were more common.
Materials and methods
Inferring tissue-specific genes
Differential dependency analysis was performed using the Limma package in R (Smyth 2005). The dependency scores were obtained from the DepMap portal (https://depmap.org/portal/; DepMap Public 20Q3, dataset doi:10.6084/m9.figshare.12931238.v1). The dataset contains scores for 18,119 genes in 789 cancer cell lines originating from 27 different tissues (Supplementary Table 1).
We excluded 3 tissues with 1 cell line. Each gene from the dataset was fitted to 24 linear models corresponding to the 24 different tissues. Each model was tested for the tendency of a gene to have higher or lower dependency scores in a specific type of tissue. Moderated t-statistics, moderated F-statistic, log-odds of the differential dependency, and P-values were computed using the eBayes function from this package. The P-values were adjusted for multiple tests by a false discovery rate (FDR) Benjamini–Hochberg procedure.
Tissue-specific genes were defined as genes with significantly lower levels of dependency scores in a specific tissue compared to all other tissues (t < 0, FDR < 0.05) and with an average dependency score < −0.5. Using this threshold allowed us to exclude genes that are nonessential and, at the same time, to include genes that are not necessarily highly essential in all cell lines. Pearson correlation test was used to test the association between the number of cell lines and the number of tissue-specific genes per tissue. The percentage of overlap between tissues was quantified by the Jaccard Index (metric of intersection over union).
Nonessential genes (NEGs) were obtained from Hart et al. (2014). Common essential genes (CEGs) were obtained from 2 previously reported studies, Blomen et al. (2015) and Hart et al. (2015), which identified essential genes for human cell lines.
Differential expression of genes in vulnerable and nonvulnerable tissues
Differential expression analysis was performed using edgeR package in R to test whether tissue-specific genes or their paralogs are upregulated or downregulated in vulnerable tissues relative to the nonvulnerable tissues. Raw counts of RNA sequencing for 783 out of the 786 cell lines with dependency scores were obtained from the Broad Institute Cancer Cell Line Encyclopedia (CCLE). The P-values were adjusted for multiple tests by an FDR Benjamini–Hochberg procedure and genes with FDR < 0.05 were considered differentially expressed.
The number of human paralogs that are differentially expressed between vulnerable and nonvulnerable tissues was also tested similarly. Human paralogs were defined using the TreeFam database (http://www.treefam.org/), classifying genes from different organisms to families based on homology. Paralogs were defined as any 2 human genes that belong to the same family and therefore are homologous. In total, 1,443 out of 1,485 human paralogs were included in the differential expression analysis after the filtration of low expressed genes.
Average expression estimation in vulnerable and nonvulnerable tissues
We performed a randomized permutation test to evaluate whether the expression of tissue-specific genes in the vulnerable tissues tended to have more extreme values both in the positive and negative directions. Transcript per million expression data for protein-coding genes in 783 out of the 786 cell lines with dependency scores was obtained from the Broad Institute CCLE.
We calculated for all tissue-specific genes the mean of the absolute values of t-statistics between the expression in cell lines that belongs to the vulnerable tissues and other cell lines. This value served as the test statistic and was compared to 10,000 simulations (n) in which the tissue identity of the tissue-specific genes was randomized. We calculated the empirical P-value as (r + 1)/(n + 1), where r is the number of times the statistic in the simulations exceeded the true statistic (North et al. 2002). Similarly, to check whether the expression of the paralogs tends to have more extreme values (both in the positive and negative directions), we calculated for all the paralogs the mean of the absolute values of the t-statistics for the difference in expression between cell lines that belongs to the vulnerable tissues and other cell lines. This value served as a test statistic and was compared to 10,000 simulations in which the tissue identity of tissue-specific genes was randomized. The empirical P-value was calculated as above.
Correlation tests between dependency scores, gene expression, and copy number
Spearman’s rank correlation tests were used to study the relationship between the dependency scores of the tissue-specific genes and the expression of 19,144 genes. The FDR procedure was used to adjust the P-values for each tissue-specific gene and across the 19,144 tests. The relationship between the copy number (obtained from the DepMap portal) and the dependency scores was tested using Spearman’s rank correlation test with FDR adjustment. Fisher’s exact test was used to test for the association between the number of tissue-specific genes significantly associated with copy number and the direction (positive or negative) of the correlation between the expression of the tissue-specific gene and the dependency scores. Functional redundancy (FR) and functional codependency (FC) with paralogs were identified based on a significant (FDR < 0.05) positive or negative Spearman’s rank correlation between the dependency scores of the tissue-specific genes and the expression of existing paralogs. Fisher’s exact test was used to test whether tissue-specific genes implicated in FC tend to have a PE compared to tissue-specific genes implicated in FR.
To examine if the change in copy number solely affects the change in dependency scores or if the variation in expression also has an effect, we ran ANOVA tests with 4 different rank regression models where the variation of dependency scores is explained by either copy number alone, copy number when the expression is controlled for, expression alone and expression when the copy number is controlled.
Stepwise rank regression models
To find alternative explanations for tissue-specific genes, we calculated the Spearman correlation between the dependency scores of the unexplained tissue-specific genes and gene expression of all other genes. Then, for each of the tissue-specific genes, we created a model which included only genes with a positive spearman coefficient. We choose to focus on positive correlations to identify general compensation mechanisms. Tissue-specific genes that did not have any significant positive correlation were removed from the analysis.
To identify multiple independent explanatory variables, we used a forward stepwise rank regression procedure. The rank regression model is a linear model between the ranks of the tissue-specific genes dependency scores and the ranks of genes’ expression in the cell lines. The positively correlated genes were sequentially entered into the model, starting from the gene with the most significant positive Spearman correlation and ending with the gene with the smallest correlation. The genes were considered as independent correlations only if their addition to the model improved it significantly (P < 0.05). The procedure stopped when there were no longer genes that could improve the model significantly. To identify a general mechanism that can explain a large portion of the tissue-specific genes, we searched for genes that have independent correlations with multiple tissue-specific genes.
Intolerance to mutations and disease involvement of tissue-specific genes
The overlap of tissue-specific genes with genes intolerant to different types of mutations (loss-of-function, missense, and synonymous) was calculated using data obtained from the Genome Aggregation Database (gnomAD; https://gnomad.broadinstitute.org). For this purpose, Wilcoxon signed-rank tests were performed to compare the observed and expected (O/E) rates in tissue-specific genes and other genes.
To explore the tendency of tissue-specific genes to be associated with human disease, we checked the association between genes and human diseases from the Human Protein Atlas (www.proteinatlas.org). Data were available for 1,271 tissue-specific genes, 753 NEGs, and 1,246 CEGs. The number of genes involved in at least one disease was compared between different groups using Fisher’s exact tests. In addition, the number of genes with at least 1 paralog was also compared between tissue-specific genes, CEGs, and NEGs using Fisher’s exact test.
Estimation of expression specificity in noncancerous cell types
Genes were considered to have cell type-specific expression if they were defined in the protein atlas dataset to be either cell type enriched (mRNA levels in 1 cell type at least 5 times the maximum levels of all other analyzed cell types) or cell type enhanced (mRNA levels in a particular cell type at least 5 times average levels in all cell types; Uhlén et al. 2015). To compare tissue-specific genes implicated in PE, FR, and FC to NEGs, we isolated genes with at least 1 paralog. In the case of genes with more than 1 paralog, the paralog with the most significantly correlated expression to the gene dependency scores was used.
Genes were excluded when either they or their paralogs did not contain data on cell type-specificity, when there was no dependency data for the gene or when there was no expression data for the paralog. The analysis of cell type-specific expression among the gene pairs (a gene and its paralog) was done using Fisher’s exact tests.
Gene set enrichment analyses
The 4 functional enrichment analyses in the study were performed using ToppGene Suite (Chen et al. 2009). Using this tool, we tested tissue-specific genes enrichment in human phenotype and tissue-specific genes implicated in FR, tissue-specific genes implicated in FC, and tissue-specific genes correlated with the GJA1 gene in gene ontology (GO) terms for GO biological processes, molecular functions, and cellular components. Fisher’s exact tests were used to test tissue-specific genes correlated with GJA1 association to blood-related tissues.
Results
Inferring tissue-specific genes from large-scale CRISPR screens
To study the extent of tissue specificity in the genome, we began by dividing 786 cancer cell lines, subject to a loss-of-function CRISPR screen, into 24 different groups based on their tissue of origin. These groups correspond to tissues of origin, such as blood, skin, and the eye. A previous study indicated that many pathways, but not all, are preserved between cell lines and their tissues of origin (Lopes-Ramos et al. 2017). In each tissue, there were different numbers of cell lines (Supplementary Table 2), which could affect the statistical power to identify tissue specificity in different tissues. Some of the tissues are expected to be more similar to each other, such as blood and lymphocytes or tissues from the central and peripheral nervous systems.
We then used a measure called a dependency score of how essential each gene is to a specific cell line. The dependency scores are based on the changes in the abundance of guide RNAs during the screen. A large reduction in the representation of guide RNAs targeting a specific gene indicates that the gene is essential for cell viability. The scores are adjusted such that a score of 0 means that the gene is not essential, and −1 is the median score of highly essential, nonspecific genes. Thus, the more negative the score, the more essential the gene is. We compared the levels of gene essentiality between cell lines that belong to different tissues. Essential genes (average dependency score < −0.5) that were significantly more essential to a specific lineage of cells (FDR < 0.05) were considered as “tissue-specific genes.”
Based on the dependency score criterion, we identified 1,274 tissue-specific genes (Supplementary Table 3). The number of genes per tissue varied, with the highest numbers in plasma and blood (Fig. 1a). For one tissue with a small sample size (Thyroid, n = 6), there were no significant genes. However, in general, the number of cell lines in each tissue was not a good predictor of the number of tissue-specific genes (r = −0.048, P = 0.83; Fig. 1b). For example, in lungs with 107 cell lines, only 9 tissue-specific genes were identified, while in the plasma with 20 cell lines, 367 tissue-specific genes were discovered. We calculated the average dependency score across cell lines that belong to each tissue. For some tissue-specific genes, the average dependency scores varied quantitatively between tissues (Fig. 1c), while in other cases, there was a clear distinction between tissues with low and high average dependency scores (Fig. 1d). Our dependency score definition of tissue specificity does not require that a gene is more essential in a single tissue. Indeed, we identified tissue-specific genes shared between 2 or more tissues. We quantified the percentage overlap between tissues (Fig. 1e) and found that the highest was between related tissues: blood/plasma, plasma/lymphocytes, blood/lymphocytes, ovary/uterus, and pancreas/bile duct (Jaccard Index = 0.186, 0.095, 0.093, 0.091, 0.066, respectively).

Identification and characterization of tissue-specific genes. a) The number of significant genes per tissue. b) Number of tissue-specific genes as a function of sample size (number of cell lines in each tissue). c, d) Examples of distribution of dependency scores across tissues for 2 tissue-specific genes. c) VRK1 is more essential in the central and peripheral nervous system, and (d) IRF4 is more essential in the plasma and lymphocytes. e) The overlap of tissue-specific genes between tissues. The overlap was quantified by a metric of intersection over union, also known as the Jaccard index. CNS, central nervous system; PNS, peripheral nervous system; UA, upper aerodigestive.
PE in specific tissues can explain only a minority of tissue-specific genes
The simplest explanation for tissue specificity is that some genes have increased or exclusive expression in defined tissues. The PE of genes in specific tissues may indicate that those genes have tissue-specific functions. We explored this hypothesis using the expression data available for the same cell lines. We first tested whether there is a general tendency for higher expression of the tissue-specific genes in the tissues with low dependency scores (hereafter the vulnerable tissues) relative to all other tissues (hereafter the nonvulnerable tissues). We found that in 25% of cases, the average expression of tissue-specific genes in the vulnerable tissues was higher than in the nonvulnerable tissues, as expected (Fig. 2a, Supplementary Table 4). However, we also found that in 23% of cases, expression was lower (Fig. 2a, Supplementary Table 4). The tendency for more extreme expression values (lower or higher) in the vulnerable tissues was significantly different than expected by chance based on a randomization test (P = 9.9 × 10⁻⁵; Fig. 2b).
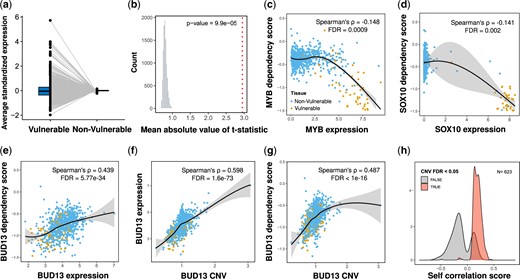
The expression of the tissue-specific genes in vulnerable tissues is consistent with a PE mechanism and the effect of copy number variations (CNVs). a) The average standardized expression of tissue-specific genes in vulnerable and nonvulnerable tissues. b) The observed mean absolute t-statistic (dashed red line) was calculated for differences in the expression of tissue-specific genes between the vulnerable and nonvulnerable tissues. The histogram shows the distribution of the expected values under the null based on 10,000 permutations. c, d) Demonstration of PE. c) MYB, a tissue-specific gene in blood and lymphocytes, is more essential (lower dependency) in cells with higher expression of MYB. d) SOX10, a tissue-specific gene in the skin, is more essential in cells with higher expression of SOX10. e–g) Demonstration of a tissue-specific gene that is explained by the gene copy number. e) BUD13, a tissue-specific gene in the skin and the upper aerodigestive tissue, is less essential in cells with higher expression of BUD13. f) BUD13 expression is associated with the copy number of BUD13. g) BUD13 dependency scores are associated with the copy number of BUD13. h) Density plots of Spearman’s correlation coefficients between the dependency scores and expression of tissue-specific genes. The plots are shown for 623 tissue-specific genes with CNV information, divided into genes with significant correlation with the gene copy number (FDR < 0.05) (light red) or nonsignificant (grey). All P-values presented in the figures are adjusted for multiple tests by the Benjamini and Hochberg FDR procedure. The yellow dots (C-G plots) represent cell lines that belong to the vulnerable tissues, and the blue dots are for cell lines in the nonvulnerable tissues. In C-G, locally estimated scatterplot smoothing (LOESS) curves and 95% confidence intervals are shown alongside Spearman’s ρ and the FDR value.
Next, we tested the association between gene expression and dependency scores. In those tissue-specific genes that expression is responsible for tissue-specific genes, we expect to see a higher expression in cells where the gene is more essential (i.e. negative correlation between gene expression and the dependency scores). We found only 115 tissue-specific genes (out of 1,274) with a significant correlation that is consistent with this potential mechanism (Spearman’s ρ < 0, FDR < 0.05; see examples in Fig. 2, c and d). These analyses suggest that PE may account for only a minority of tissue-specific genes (9%).
Gene amplification is important for determining the tissue specificity
Our analysis showed that in some cases, the expression of the tissue-specific genes was lower in the vulnerable tissues, contrary to the assumption that high levels of expression are an indication of tissue specificity. We identified 509 tissue-specific genes that were less essential in cells with higher transcript abundance (Spearman’s ρ > 0, FDR < 0.05; see example in Fig. 2e). A possible explanation for this unexpected finding is an increase in the copy number of those genes in specific tissues.
Gene amplification may alter the likelihood of complete gene knockout. Indeed, we found that for 469 genes out of the 509 genes (92.1%) with increased expression in the nonvulnerable tissues, the copy number was a significant predictor of essentiality (FDR < 0.05; see examples in Fig. 2, e–g). In contrast, out of the 115 tissue-specific genes with PE in the vulnerable tissues (identified above), only 5 showed significant association with copy number (4.3%).
We divided the genes by the direction of the correlation between the dependency scores and the gene expression (positive vs negative) and asked if they were significantly associated with copy number. We found a highly significant association between the 2 groups [odds ratio (OR) = 250.7, P = 2.7 × 10−80] (Fig. 2h). Thus, the copy number can significantly predict gene essentiality, specifically in tissue-specific genes that are expressed at lower levels in the vulnerable tissues.
We propose that differences in gene amplification lead to the tissue-specific genes but not the increased expression accompanying them. Since the levels of gene amplification are positively correlated with gene expression, we used multiple regression models to explore the causal relationship between copy number, expression, and dependency scores for the 509 genes indicated above. When testing only one of the parameters (expression or copy number), we obtain correlated P-values between the effect of expression and copy number (Supplementary Fig. 1a). However, in the conditional models (Supplementary Fig. 1b), the association with gene expression was dramatically reduced when controlling for the copy number. In contrast, the copy number effect remained highly significant for most genes when controlling for expression levels.
Taken together, our analysis suggests that gene amplification, independently of gene expression, is responsible for 36.8% of the tissue-specific genes.
The expression of paralogs may explain a large proportion of tissue-specific genes
Since PE explains a minority of cases of tissue specificity, the question is what explains the other cases. One option is that the expressions of other genes are important. A loss of a gene that is expressed in all tissues can still result in a tissue-specific effect if there are other genes that can compensate for the loss of that gene in a tissue-specific manner. This type of FR between proteins with similar biochemical activities has been commonly observed for paralogs (Barshir et al. 2018): a lower expression of a paralog in a specific tissue can result in the vulnerability of that tissue to the loss of other paralogs.
To study the expression of paralogs as a potential mechanism, we first identified tissue-specific genes with paralogs (Supplementary Table 5). We found 407 tissue-specific genes with paralogs. Most had a small number of paralogs (mode = 1, median = 2; Fig. 3a), leaving 867 tissue-specific genes without any paralog. We next examined the overall expression patterns of the paralogs in the vulnerable vs nonvulnerable tissues for 404 tissue-specific genes with available data. We found that the average expression of the paralogs tends to be either higher or lower in the vulnerable tissues relative to the nonvulnerable tissues (Fig. 3b, Supplementary Table 4). We found a highly significant difference in the expression of paralogs between the vulnerable and nonvulnerable tissues (randomization test, P = 9.9 × 10⁻⁵; Fig. 3c).
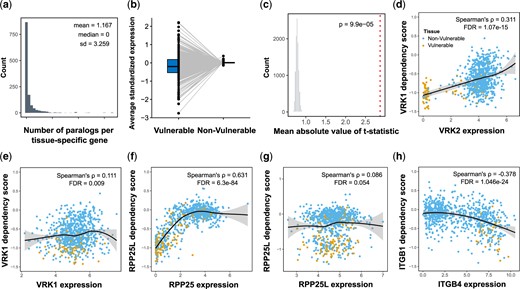
Analysis of paralogs expression suggests FR and codependency mechanisms for tissue-specific genes. a) Histogram showing the number of paralogs per each tissue-specific gene. b) The average standardized expression of tissue-specific genes paralogs in vulnerable and nonvulnerable tissues. c) The observed mean absolute t-statistic (dashed red line) was calculated for differences in paralog expression between the vulnerable and nonvulnerable tissues. The histogram shows the distribution of the expected values under the null based on 10,000 permutations. d–g) Demonstration of FR. d, e) The dependency of VRK1, a tissue-specific gene in the central and peripheral nervous systems, is correlated mainly with (E) the expression of its paralog, VRK2, (d) relative to the expression of VRK1 itself. f, g) The dependency of RPP25L, an tissue-specific gene in the central nervous systems, soft tissues, and lymphocytes, is significantly correlated (g) with the expression of its paralog, RPP26, but not (F) with the expression of RPP25L itself. h) Demonstration of FC. ITGB1 is a tissue-specific gene in the upper aerodigestive that is more essential in cells with high expression of its paralog, ITGB4. All P-values presented in the figures are adjusted for multiple tests by the Benjamini and Hochberg FDR procedure. The yellow dots (d–h plots) represent cell lines that belong to the vulnerable tissues, and the blue dots are for cell lines in the nonvulnerable tissues. In d–h, LOESS curves and 95% confidence intervals are shown alongside Spearman’s ρ and the FDR value.
If the paralogs are responsible for the tissue specificity because of their ability to compensate for the mutated gene only in specific tissues, we expect to see that tissue-specific genes are less essential in cells with higher expression of their paralog. We tested the correlation between the expression of the paralogs and the dependency scores across the cell lines. Of the 404 genes, 153 tissue-specific genes had a significant positive correlation in the predicted direction of reduced FR (Spearman’s ρ > 0, FDR < 0.05; see example in Fig. 3, d–g). This result suggests that for these 153 tissue-specific genes, the decreased expression of the paralog in the vulnerable tissues is the likely explanation. We then tested the possibility that both paralogs in the pair could compensate for the loss of each other (symmetric compensation) and found that only 25 out of 147 paralogs with available data showed symmetric compensation (FDR < 0.05; Supplementary Table 5).
Although we expected paralogs to compensate for gene loss, surprisingly, 45 tissue-specific genes had a significant negative correlation between the dependency scores and the expression of their paralogs (Spearman’s ρ < 0, FDR < 0.05; see example in Fig. 3h. Contrary to the 153 tissue-specific genes implicated in FR, the 45 tissue-specific genes tend to be expressed at higher levels in the vulnerable tissues (OR = 3.2, P = 0.001). This observation suggests that the 2 paralogs function together, and both are needed in some cells (termed codependency). We also checked whether dependency between the paralogs is symmetric (the phenotypic effect of the loss of the paralog is dependent on the expression of the tissue-specific gene) and found that out of the 44 paralogs with available dependency scores, only 8 showed such symmetric dependency (FDR < 0.05; Supplementary Table 5).
Next, we explored how the presence of multiple paralogs might account for tissue specificity. We found that in 92% of cases (141/153), when the most significant paralog was expressed in a way that is consistent with an FR between the paralogs (a significant tendency for higher essentiality in cells with lower expression of the paralog), the direction of correlation with all other paralogs was in the same direction. Similarly, when the most significant correlation indicated that the function of paralogs depended on each other, most other significant correlations were in the same direction (37/45). These results suggest that the distinction between redundancy and codependency in most cases is a property of the tissue-specific genes. In agreement, the 2 groups of tissue-specific genes include genes with different biological functions (Supplementary Table 6). GO enrichment analysis showed that tissue-specific genes implicated in FC were enriched for transcription regulation (e.g. DNA-binding transcription activator activity, FDR = 3 × 10⁻⁷). In contrast, tissue-specific genes involved in FR were enriched for essential processes like cell division (FDR = 2 × 10⁻¹⁰).
Collectively, our analyses suggest that the variable expression of paralogs in different tissues may explain 15.5% of tissue-specific genes, the majority through lineage-specific FR (12%). We also find that some paralogs do something other than compensating for one another: in those cases where the paralog is more expressed, its pair is more essential, a phenomenon we call FC (as also seen by Diss et al. 2017).
Intercellular communication may explain tissue-specific genes in blood cells
The expression analysis of tissue-specific genes and their paralogs revealed that the tissue specificity of 54.8% of the tissue-specific genes (n = 698) could be attributed to multiple mechanisms, some of which are overlapping (Fig. 4a). We next examined what could be responsible for the remaining tissue-specific genes (n = 576).
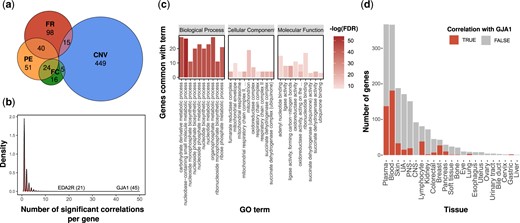
Cell-to-cell communication is a possible mechanism for tissue-specific genes. a) Euler diagram presenting the number of tissue-specific genes that could be explained by PE (orange), CNV (blue), FR (red), and FC (green). b) Distribution of the number of unexplained tissue-specific genes that were significantly positively correlated with the expression of a specific gene. The names of 2 highly ranked genes are shown. c) The 10 most significant biological functions, cellular components, and molecular functions associated with unexplained tissue-specific genes positively correlated with GJA1. The Y-axis represents the number of genes that overlap a specific term. The red color intensity signifies the -log (10) of the FDR q-value. d) Comparison between the number of tissue-specific genes in each tissue that are positively correlated with GJA1 (red) or not (grey). CNS, central nervous system; PNS, peripheral nervous system; UA, upper aerodigestive.
To identify additional potential compensation mechanisms that could account for the tissue specificity, we calculated the correlation between the dependency scores of the 576 tissue-specific genes and the gene expression of all other genes and identified ones with positive correlations (Spearman’s ρ > 0, FDR < 0.05). We identified 5,822 genes with a positive independent correlation (not highly correlated with other more significant genes) to at least one of 548 tissue-specific genes.
One particular gene, GJA1 (also known as connexin 43), stood out because it was positively correlated with 45 tissue-specific genes (other genes were correlated with only a few tissue-specific genes; median = 1, mean = 1.68, SD = 1.47; Fig. 4b). GJA1 is a component of gap junctions that allow the exchange of low molecular weight molecules between adjacent cells (Goodenough et al. 1996). Other genes that were positively correlated with multiple tissue-specific genes are also involved in cell communication, such as SYTL3 (independently correlated with 19 genes), which belong to a family of proteins involved in vesicular trafficking (Tsuboi and Fukuda 2006) and LRP1 (independently correlated with 13 genes), which is a receptor involved in endocytosis (Van Gool et al. 2015).
This finding suggested a mechanism: mutant cells that express proteins that allow uptake through gap junctions from surrounding cells will be less dependent on their ability to generate small essential molecules. Consistent with this hypothesis, GO enrichment analysis for the 45 tissue-specific genes correlated with GJA1 showed that these genes are involved in the metabolism of small molecules, including nucleobase-containing small molecule metabolic process (FDR = 4.7 × 10⁻²⁴), organophosphate metabolic process (FDR = 1.4 × 10⁻²⁰), carbohydrate derivative metabolic process (FDR = 1.3 × 10⁻¹⁹), and nucleotide biosynthetic process (FDR = 1.4 × 10⁻¹⁹) (Fig. 4e). It is important to note that the enrichment in these biological processes was highly significant compared to the level of enrichment for cellular components or molecular functions (Fig. 4c).
Since gap junctions are absent in circulating blood cells, we expected the tissue-specific genes correlated with GJA1 to be essential mostly in blood cells. Indeed, we found that 36 out of 45 tissue-specific genes were essential in at least 1 blood-related lineage (blood, lymphocytes, and plasma cells), significantly more than expected by chance (OR = 4.3, P = 3.8 × 10⁻⁵).
We also suspected that such a mechanism might explain why we had more tissue-specific genes in tissues that lack cell–cell junctions, such as blood or plasma cells. We identified 287 tissue-specific genes with a significant positive correlation with GJA1 expression (Spearman’s ρ > 0, FDR < 0.05). The 287 tissue-specific genes were significantly enriched in blood-related tissues (OR = 9.4, P = 1.6 × 10−46; Fig. 4d).
Tissue-specific genes are associated with human diseases
Our findings are derived from analyses of cancer cell lines, raising a question as to the relevance of the mechanism we have identified for noncancerous cells. It is possible that the tissue-specific genes are only specific for human cancers rather than other human diseases. We explored this concern by testing whether the genes we found were relevant to all human diseases or to only a subset of them.
We studied the overlap of tissue-specific genes with genes intolerant to mutations. In such genes, functional variants are kept at very low frequencies because purifying selection removes such variants from the population (Karczewski et al. 2020). We found that tissue-specific genes were significantly more intolerant to loss-of-function (P = 7.2 × 10−95) and missense variants (P = 2.3 × 10−93) compared to other genes in the genome (Fig. 5, a and b). As a control, we also tested synonymous variants, which were not significantly different (P = 0.99; Fig. 5c).
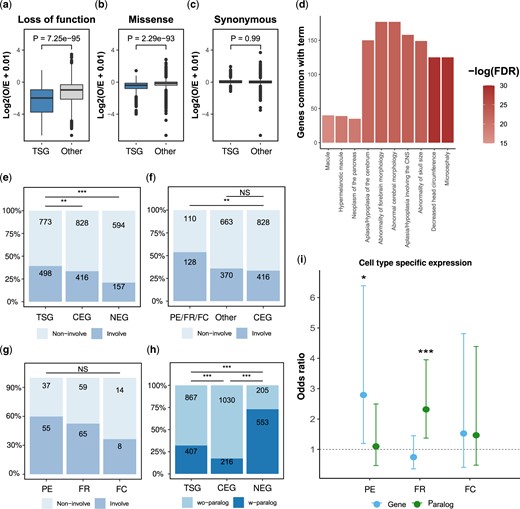
Involvement of tissue-specific genes in human diseases and expression specificity across diverse human cell types. a–c) Degree of intolerance to (a) loss-of-function mutations, (b) missense mutations, and (c) synonymous mutations. Values are the Log2 of the ratio between the observed and expected number of mutations for tissue-specific genes and all other genes. P-values were calculated using Wilcoxon signed-rank tests. (d) Ten most significant human phenotypes that are associated with tissue-specific genes. The X-axis represents the number of genes that overlap a specific term. Color intensity signifies the -log (10) of the FDR q-value. e–g) Percentage of genes associated with human diseases. e) Comparing tissue-specific genes, CEGs, and NEGs. f) Comparing disease involvement between tissue-specific genes implicated in 3 universal mechanisms with other tissue-specific genes and CEG. The 3 universal mechanisms, PE, FR, and FC, were treated as 1 group. g) Comparing disease involvement between PE, FR, and FC. h) Proportions of genes with paralogs for tissue-specific genes, CEG, and NEG. i) Association between cell type-specific expression of the tissue-specific gene itself (Gene) or the paralog (Paralog) with genes implicated in PE, FR, FC relative to NEG. Values are ORs ± 95% confidence interval. NS, P > 0.05; *, P < 0.05; **, P < 0.005; ***, P < 0.001.
Given that tissue-specific genes are intolerant to functional mutations, we next studied the association of tissue-specific genes with human phenotypes. Gene set enrichment analysis of tissue-specific genes revealed that these genes are enriched for developmental phenotypes, mainly of the central nervous system (Fig. 5d), such as “Microcephaly” (FDR = 2.2 × 10⁻¹³) and “Decreased head circumference” (FDR = 2.2 × 10⁻¹³).
To further explore the association between tissue-specific genes and human diseases, we compared the percentage of genes associated with at least one known human disease for 3 categories of genes: tissue-specific genes, CEGs that are not specific to a tissue, and NEGs. We found that tissue-specific genes are significantly more associated with human diseases compared to both common essential (OR = 1.2, P = 0.003; Fig. 5e), and NEGs (OR = 2.4, P = 7.6 × 10⁻¹⁸; Fig. 5e).
As we have shown above, a number of different mechanisms operate to confer tissue specificity on genes. While CNVs and intercellular communication are mechanisms expected to be specific to cancer cell lines or similar systems, PE, FR, and FC should be important in many different cell types and states. Consistent with these expectations, tissue-specific genes, best explained by PE, FR, and FC, were significantly more associated with human diseases than CEGs (OR = 2.3, P = 5.03 × 10⁻⁹; Fig. 5f; with no significant difference between the 3 groups; P = 0.13; Fig. 5g). However, other tissue-specific genes not belonging to the 3 groups were similar to CEGs in their association with human diseases (OR = 1.1, P = 0.25; Fig. 5f). These results suggest that tissue-specific genes are more important for human diseases than CEGs.
Cell type-specific expression supports the generality of the genetic mechanisms of tissue-specific genes
Although our analysis focused on mechanisms explaining lineage-specificity in cancer cell lines, the involvement of tissue-specific genes with human diseases suggests that the 3 general mechanisms we identified may be conserved in other cellular contexts. Two of the mechanisms are dependent on the expression of paralogs. When comparing the number of genes with at least 1 paralog, we found that 73.0% of NEGs have paralogs, significantly more than CEGs (17.3%; OR = 12.8, P = 1.0 × 10−139; Fig. 5h). The percentage of tissue-specific genes with paralogs (31.7%) was smaller than NEGs (OR = 0.17, P = 1.6 × 10−73; Fig. 5h) but significantly more than CEGs (OR = 2.2, P = 1.3 × 10⁻¹⁷; Fig. 5h).
The interpretation of these findings is that genes with paralogs are nonessential because of FR, whereas genes without paralogs tend to be common essentials. But our analysis suggests that the genes that are essential in specific cell types are preferentially expressed in those cells or have paralogs with cell type-specific expression.
To test the generality of these predictions, we examined how many of the tissue-specific genes and their paralogs are expressed in specific cell types. We studied genes with at least 1 paralog whose tissue specificity is best explained by PE (n = 65), FR (n = 124), or FC (n = 22). We compared these to NEGs with at least 1 paralog (n = 522).
The gene pairs (a gene and its paralog) can be classified into 4 different groups: (1) none have a cell type-specific expression, (2) both the gene and the paralog have a specific expression, (3) only the paralog has a specific expression, and (4) only the gene has a specific expression. The distribution of genes in these 4 groups was significantly different between NEGs and 2 out of the 3 types of tissue-specific genes (PE P = 1.5 × 10⁻⁶, redundancy P = 3.8 × 10⁻⁴, and codependency P = 0.5).
We directly tested the differences in frequency of cell type-specific expression for the genes or their paralogs between the groups (Fig. 5i) and found that for tissue-specific genes with PE, there was a significant increase in cell type-specific expression for the gene itself compared with NEGs (OR = 2.8, FDR = 0.03). For tissue-specific genes with FR, there was a significant increase in the frequency of cell type-specific expression for the paralog (OR = 2.3, FDR = 0.005). All other tests were not significant (FDR > 0.05).
Taken together, these results indicate that the expression patterns across tissues of the gene or its paralogs depend on the mechanisms found in the cancer tissues and suggest that those mechanisms are relevant to other tissues.
Discussion
The analyses described in this article identify mechanisms underlying tissue-specificity of gene action, using loss-of-function mutations across hundreds of cancer cell lines as a tool to determine which genes are essential for a tissue. Surprisingly, we found that the most obvious mechanism that a gene is more essential in cells where it is more highly expressed (PE) applies in only 9% of the tissue-specific genes we examined.
We identified 3 compensation mechanisms that explain how the consequences of gene loss may be tissue-specific. (1) Compensation originates from increased gene copies, which may lower the probability that mutations disrupt gene function. Gene amplification explained 37% of tissue-specific genes. CNVs are relevant to different human phenotypes (Zhang et al. 2009), including neurodevelopmental disorders (Gilman et al. 2011) and many cancer types (Beroukhim et al. 2010). In cancer, gene amplification may reinforce beneficial gene expression changes (Ben-David et al. 2014). Moreover, somatic mosaicisms for CNVs are widespread in specific human tissues (Piotrowski et al. 2008; Abyzov et al. 2012). (2) Compensation by paralogs, resulting in reduced FR in specific tissues. This compensation was detected in 12% of the tissue-specific genes. It is likely to be more widespread since redundancy exists through other mechanisms. Our findings are consistent with a study of 112 heritable diseases that found that in 20% there was a lower expression of paralogs in the disease-related tissue (Barshir et al. 2018). Notably, symmetric compensation between paralogs (when both genes in the pair compensate for each other) was found only in a minority of cases (17%). One possible explanation for why many paralog pairs were not both identified as tissue-specific genes is that the primary genes we identified are ubiquitously expressed (as shown in Fig. 5i). (3) Compensation between cells. Tissue specificity may arise because intercellular communication allows the transfer of small molecules to mutant cells, rescuing the phenotype of the mutation in those tissues where such transfer is possible. Metabolic cooperation through intercellular communications (such as gap junctions) was previously shown to explain the lack of phenotypes in females with X-linked diseases (Biesecker and Spinner 2013; Forsberg et al. 2017; Migeon 2020). For example, women with a heterozygous mutation in the gene coding for hypoxanthine phosphoribosyl transferase (HPRT) are not affected because inosinic acid, the product of HPRT, is transferred from normal to mutant cells through gap junctions. However, in blood cells, compensation by this mechanism is not possible, and mutant cells are under negative selection (Migeon 2020).
In contrast to the compensation mechanisms, we found that 3.5% of tissue-specific genes are more essential in cells where the paralog has elevated expression, suggesting functional dependency between the paralogs. Previous work proposed that FC stems from a direct interaction between proteins that work together as heterodimers (Diss et al. 2017). The assumption is that cells with higher expression of the 2 paralogs are more dependent on the complex and, therefore, more vulnerable to the mutation. We found that the tissue-specific genes implicated in FC are mainly involved in transcription regulation. The codependency of those transcription factors may stem from being in the same complex or having common target genes. There is already evidence of codependency for some of the genes we identified. For example, MDM2 and MDM4 form a heterodimer required for the polyubiquitination of p53 (Wang and Jiang 2012). Other examples of pairs of paralogs known to work together are CDC42/RHOJ (Sundararaman and Mellor 2021) and EGFR/ERBB3 (Frolov et al. 2007).
An obvious limitation of our study is that cancer cell lines and their tissues of origin do not represent healthy tissues. The tissues are a way to assemble related cell lines into a group that resembles a tissue. Thus, genes we find to be specific to a tissue are not necessarily specific to the original tissue, as some processes are cancer-specific. This is also evident in the large proportion of tissue-specific genes that are associated with changes in copy number alterations, a process that is prevalent in cancers (Beroukhim et al. 2010). Another limitation of our study is that it relies on associations between essentiality and gene expression without directly testing for causality.
We address the concern that our results based on cancer cell lines are relevant to healthy tissues and human diseases by showing that tissue-specific genes are intolerant to functional mutations in the human population and are associated with human diseases more than genes that are essential across all cell types. It is possible that CEGs are less associated with human diseases because they are lethal. In addition, we found that these genes are enriched for developmental phenotypes, possibly because those are stages with high-cell proliferation (Shohat and Shifman 2019). The analysis of cell type-specific expression suggests that the mechanisms observed in the cancer cell lines are general and relevant to other cells and could explain their high involvement in human disease.
Tissue specificity so far has been studied mainly in the context of heritable diseases, work that has shown that a large proportion of disease genes affect specific tissues. Multiple mechanisms were suggested to account for the tissue specificity of diseases, including PE, compensation by paralogs in specific tissues, and other tissue-specific processes or regulatory networks. Studies of tissue-specificity of disease genes are obviously restricted to those genes that are known to cause diseases. The affected tissues are based on the symptoms presented by patients, and thus, the connection between the disease gene and the tissue is not always clear. Despite the limitations, our study is unique in the ability to identify in an unbiased way tissue-specific genes and systematically study the mechanisms responsible.
Our findings have important implications for studies of genotype–phenotype relationships. Studies of human diseases and potential genetic therapies for cancer are frequently based on the assumption that the cell types most affected by a mutation are those with higher gene expression. Among others, this assumption is used to connect newly identified variants to diseases or as a way to determine which tissues and developmental stages are associated with a disease. However, our findings indicate the need for ways to integrate the expression of the causal genes and other interacting genes to determine which tissues or cell types are likely to be involved in the disease. Thus, our results could be used to predict and explain why specific cell types are affected by a loss of a particular gene. Our work also may have specific implications for understanding the origin of lineage specificity in response to oncogenic driver mutations.
An additional and more general output of our study is that genes essential in a specific type of cells, like other forms of biological variation, can offer important insights into genetic mechanisms of genetic interactions. The mechanisms that explain the variance between cell lineages can also be relevant for the differences between human individuals with the same genetic condition and can be the basis for incomplete penetrance and variable expressivity.
Data Availability
The authors affirm that all data necessary for confirming the conclusions of the article are present within the article, figures, and tables.
Supplemental material is available at GENETICS online.
Funding
This work was supported by the Israel Science Foundation (grant no. 466/21) and by the Israel Science Foundation Broad Institute Joint Program (grant no. 2612/18).
Conflicts of interest
None declared.
