


Abstract
Gene drives could allow for control of vector-borne diseases by directly suppressing vector populations or spreading genetic payloads designed to reduce pathogen transmission. Clustered regularly interspaced short palindromic repeat (CRISPR) homing gene drives work by cleaving wild-type alleles, which are then converted to drive alleles by homology-directed repair, increasing the frequency of the drive in a population over time. However, resistance alleles can form when end-joining repair takes place in lieu of homology-directed repair. Such alleles cannot be converted to drive alleles, which would eventually halt the spread of a drive through a population. To investigate the effects of natural genetic variation on resistance formation, we developed a CRISPR homing gene drive in Drosophila melanogaster and crossed it into the genetically diverse Drosophila Genetic Reference Panel (DGRP) lines, measuring several performance parameters. Most strikingly, resistance allele formation postfertilization in the early embryo ranged from 7 to 79% among lines and averaged 42 ± 18%. We performed a genome-wide association study using our results in the DGRP lines, and found that the resistance and conversion rates were not explained by common alleles of large effect, but instead there were several genetic polymorphisms showing weak association. RNA interference knockdown of several genes containing these polymorphisms confirmed their effect, but the small effect sizes imply that their manipulation would likely yield only modest improvements to the efficacy of gene drives.
SUPER-MENDELIAN gene drive inheritance enables the rapid spread of drive alleles in a population, even if these alleles cause harm to the organisms carrying them (Burt 2014; Champer et al. 2016). In homing drives, the drive allele contains an endonuclease that cleaves a target site in the genome, and the drive allele is then copied into the target site during homology-directed repair, thereby increasing the drive frequency in a population over time. A homing drive could thus facilitate the quick spread of a genetic payload, allowing a range of diverse applications. For example, a successful gene drive blocking disease transmission could provide a powerful method to eliminate vector-borne diseases such as malaria, which kills nearly 500,000 people, mostly children, each year (World Health Organization 2015). Gene drive constructs could also directly suppress a vector population by targeting an essential gene (Burt 2014; Champer et al. 2016). Other applications include the suppression of agricultural pest populations such as Drosophila suzukii (Scott et al. 2018) or the removal of invasive species causing ecosystem damage.
All these applications depend on functioning and highly efficient gene drives. However, there are practical barriers that reduce gene drive efficiency. One crucial barrier is the formation of resistance alleles against the drive allele (Champer et al. 2017; Noble et al. 2017; Unckless et al. 2017). Recent homing drives have used clustered regularly interspaced short palindromic repeat (CRISPR)-Cas9 for their endonuclease component, which finds the target site with a guide RNA (gRNA). Such Cas9-based homing drives are highly susceptible to resistance because when Cas9 cleavage is repaired by end-joining instead of homology-directed repair, the target sequence is often changed, preventing recognition by the gRNA. Indeed, resistance has been found in all previous studies involving Drosophila (Gantz and Bier 2015; Champer et al. 2017, 2018, 2019; KaramiNejadRanjbar et al. 2018; Oberhofer et al. 2018), Anopheles (Gantz et al. 2015; Hammond et al. 2015, 2017; Kyrou et al. 2018), and mice (Grunwald et al. 2019), usually halting the spread of a drive. Recent studies have made substantial progress in reducing resistance through the use of multiplexed gRNAs (Champer et al. 2018) and improved promoters (Champer et al. 2018; Kyrou et al. 2018), and careful choice of the target site to reduce formation of viable resistance sequences (Kyrou et al. 2018). Even so, it remains unclear if these improvements are sufficient for success in large cage populations or highly diverse natural populations.
Resistance alleles against CRISPR gene drives can form both in the germline as an alternative to successful drive conversion, and in the early embryo after cleavage by maternally deposited Cas9 and gRNA (Gantz et al. 2015; Hammond et al. 2015; Champer et al. 2017, 2018, 2019). A previous study indicated that genetically diverse lines experience high levels of variation in the rate at which these embryo resistance alleles form, possibly due to variation in Cas9 expression levels (Champer et al. 2017). To further understand how genetic diversity may contribute to this process, we tested a drive construct in the Drosophila Genetic Reference Panel (DGRP), which is a collection of > 200 genetically diverse inbred lines derived from North Carolina (Mackay et al. 2012; Huang et al. 2014). Several gene drive performance parameters were assessed, particularly the rate at which resistance alleles formed in the early embryo due to its wide range among lines. We were able to identify putative genetic factors affecting drive performance by conducting a genome-wide association study (GWAS), and further verified the results by knocking down candidate genes with lines expressing short hairpin RNAs (shRNAs) and assessing the effect on drive performance.
Materials and Methods
Genotypes and phenotypes
A CRISPR homing gene drive utilizing the nanos promoter for germline Cas9 expression was constructed and assessed previously (Champer et al. 2017). It carries a dsRed fluorescent protein gene driven by the 3xP3 promoter for expression in the eyes, ocelli, and the abdomen. The drive disrupts yellow, an X-linked gene, causing a recessive yellow body and wing phenotype. If Cas9 cleavage is repaired by end-joining, rather than homology-directed, repair, this will mutate the target site, forming a resistance allele. These are termed “r2” if they render yellow nonfunctional due to a frameshift or a sufficient change in the amino acid sequence. Resistance alleles that preserve the wild-type function of yellow are termed “r1.” The different possible phenotypes and genotypes are summarized in Supplemental Material, Table S1, as are calculations based on phenotypes to determine drive performance parameters. A similar drive targeting white (Champer et al. 2018) was also assessed in three DGRP lines.
Fly rearing and phenotyping
All flies were reared on Bloomington Standard medium at 25° with a 14/10 hr day/night cycle. During phenotyping, flies were anesthetized with CO2 and examined with a stereo dissecting microscope. Flies were considered “mosaic” if any discernible expression of yellow phenotype could be observed in the body or wings. dsRed fluorescent phenotype in the eyes was scored using the NIGHTSEA system (SFA-GR). All experiments involving live gene drive flies were carried out using Arthropod Containment Level 2 protocols at the Sarkaria Arthropod Research Laboratory at Cornell University, a quarantine facility constructed to comply with containment standards developed by USDA APHIS. Additional safety protocols regarding insect handling approved by the Institutional Biosafety Committee at Cornell University were strictly obeyed throughout the study, further minimizing the risk of accidental release of transgenic flies.
Fly experiments
To assess drive performance in the DGRP lines (Mackay et al. 2012; Huang et al. 2014), males with the drive derived from a w1118 laboratory stock (Bloomington Stock Number 3605) were crossed to virgin females from the DGRP lines. The progeny, which consisted of w1118/w1118 females heterozygous for the drive at the yellow locus and w1118 males that were wild-type at the yellow locus, were allowed to mate and then placed into four to six vials. These flies were removed after 5 days. Progeny of these crosses were collected after 11, 14, and 17 days. They were frozen and later scored for dsRed and yellow body phenotypes, as well as the white eye phenotype, which occurred in approximately one-half of males inheriting the original drive allele, and in a very small number of flies that experienced crossovers between the drive allele and the white locus.
To generate drive heterozygotes with active shRNA genes to assess the effect of shRNAs on drive performance, females homozygous for the homing drive were crossed separately to w1118;P{GMR-GAL4,w[-]}2/CyO males (Bloomington Stock Number 9146) and y1w*;P{w+mC = Act5C-GAL4}25FO1/CyO,y+ males (Bloomington Stock Number 4414). Females from the former cross with CyO (curly-O wing phenotype produced from the dominant CyO allele) were then crossed to males of the latter cross without CyO. Male progeny with dsRed, yellow body, wild-type eyes, and CyO from this cross were then crossed with shRNA or control lines with the same genetic background as the shRNA lines, and from which these lines were derived. These included lines 34,578 (P2 grn), 34,943 (P2 CG42674), 36,303 (P2 background control), 36,304 (P40 background control), 38,263 (P40 Dlish), 40,849 (P40 camta), 40,927 (P40 vg), 41,875 (P40 Pum), 51,417 (P2 Arf51F), 51,435 (P40 CG6225), 51,933 (P40 Lig4), 52,882 (P40 CG5009), 61,942 (P40 Irbp/Ku70), 62,975 (P40 CG4984), and 67,932 (P40 Arp1) from the Bloomington Drosophila Stock Center and lines 60,100 [Vienna Drosophila Resource Center (VDRC) background control] and 104,478 (VDRC CG7220) from the VDRC. Female progeny from these crosses with wild-type eyes, wild-type bodies, and without CyO were then collected. These flies were drive/wild-type heterozygotes at the yellow locus, and also had a single copy of the shRNA under the control of the UAS (upstream activating sequence) promoter (or shRNA insertion site for control lines) and a single copy of the Gal4 gene under control of the constitutively active Act promoter. The UAS promoter is active in the presence of Gal4, resulting in expression of the shRNA gene in these drive heterozygote females. They were crossed to w1118 males and the progeny were scored for dsRed, white eye phenotype, and yellow body phenotype to assess the effect of the shRNA.
GWAS
DGRP genotype files were downloaded from the DGRP2 website (http://dgrp2.gnets.ncsu.edu/data.html). From these files, 128 lines were phenotyped and drive performance parameters were calculated (Data S1 and S2) for GWAS analyses. To compensate for the cryptic relatedness among DGRP lines, PLINK 1.9 (Purcell et al. 2007) and filters of minor allele frequency (maf 0.05) and genetic information missingness (geno 0) were used to modify the genotype file, and to generate a genetic relatedness matrix using GEMMA (Zhou and Stephens 2012). Then, filters (maf 0.05 and geno 0.05) were applied to the genotype of the 128 lines. Phenotype data were added to the genotype file as new columns. The Wolbachia infection status was obtained from the DGRP2 website and evaluated as a covariate in the analysis.
A Wald test was performed, and resulting test statistics were generated and loaded into R Studio to build Manhattan plots. P-values were adjusted using the Benjamini–Hochberg procedure to correct for multiple testing (Benjamini and Hochberg 1995; Dalmasso et al. 2005). To verify that the cryptic relatedness among DGRP lines was properly compensated for, we used the R package “qqman” (Turner 2014) to draw Q-Q (quantile–quantile) plots. The genomic inflation factor λ was calculated by converting the observed and expected P-values to χ2 statistics and taking the ratio of the median of the observed to the median of the expected. Top hits were manually annotated using FlyBase (Gramates et al. 2017).
For the rates of wild-type male progeny, several significant hits were obtained. However, despite a λ of 1.016, the Q-Q plot illustrates that the P-values were severely inflated because the phenotypic distribution showed low variance and right-skewness (see Figure 2B and Figure S4B). The seemingly normal genomic inflation factor is due to the fact that the median of the test statistic was not affected much by the hits with the lowest 1% of P-values. However, these hits were the most inflated, as shown by a high λ of 1.110 for the top 10,000 hits. Since a GWAS generally requires normally distributed data, we hypothesized that the inflation was due to the data structure and we performed rank normalization on the data. After normalization, the Q-Q plot showed less inflation (Figure S4B) (λ = 1.033 for the entire data and λ = 1.014 for the top 10,000 SNPs), and no SNP hits were obtained using a false discovery rate of 50%.
Data availability
Strains and plasmids are available upon request. The authors affirm that all raw data necessary for confirming the conclusions of the article are present within Data S1–S3 and S6. Supplemental material available at Figshare: https://doi.org/10.25386/genetics.7897544.
Results
Drive characteristics vary widely among the DGRP lines
Males with a CRISPR homing drive targeting the X-linked yellow gene were crossed to females from 128 DGRP lines (Mackay et al. 2012; Huang et al. 2014), each of which has an identical target site sequence. The resulting offspring (drive heterozygote females and wild-type males) were allowed to mate, and their progeny (averaging 438 males and 402 females for each line) were phenotyped for dsRed, and yellow body and wings, to assess several drive performance parameters (Figure 1, Table S1, and Data S1 and S2).
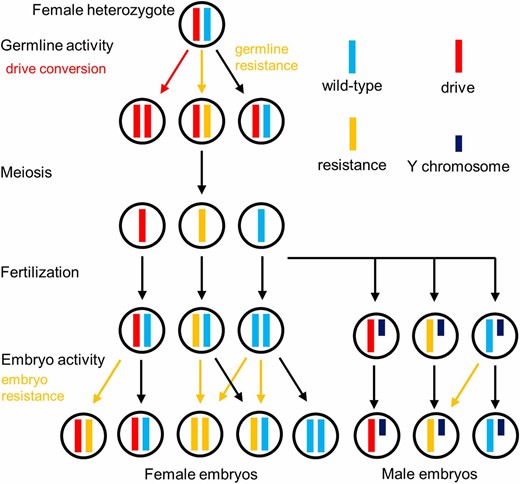
Mechanisms of the homing drive. In heterozygous females, the “drive conversion rate” is the rate at which wild-type alleles are converted into drive alleles by homology-directed repair in the germline. Resistance alleles can also form at this stage. The “male wild-type rate” is the rate at which wild-type alleles either remain wild-type or are converted to r1 alleles, which have a wild-type phenotype, as calculated from male progeny. Meiosis and fertilization occur, and then, additional resistance alleles can form in the early embryo. The “embryo r2 rate” represents the rate at which this occurs in flies that inherit a drive allele. The “embryo mosaic r2 rate” represents the analogous rate at which resistance alleles form in later developmental stages, creating a mosaic yellow phenotype in adult daughters.
The germline drive conversion rate is the rate at which wild-type alleles are converted to drive alleles in drive/wild-type heterozygotes, with 0% representing Mendelian inheritance and 100% representing perfect drive conversion (Champer et al. 2017, 2018). This rate varied among the DGRP lines from 28.2 to 71.7%, averaging 52 ± 9% (Figure 2A and Figure S1). This among-line variation was found to be significant (P < 2 × 10⁻¹⁶, F = 3.422, ANOVA). Germline resistance allele formation was also measured, representing the rate at which wild-type alleles are converted to resistance alleles in the germline of heterozygotes. These can take the form of r2 alleles, which disrupt yellow, and r1 alleles, which preserve yellow function. Based on male progeny, the average rate at which r2 resistance alleles were formed was 38 ± 8% (Figure S1), and 7 ± 4% either had r1 resistance alleles formed or remained wild-type (Figure 2B).
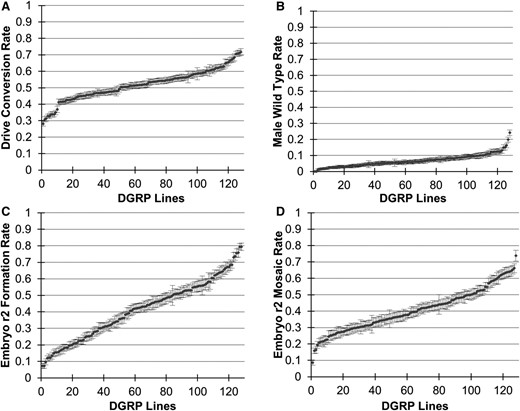
Variation in drive performance among the DGRP lines. Each point represents the rate ± SE in a single line for (A) drive conversion efficiency in heterozygote females, (B) the rate of wild-type phenotype in male progeny, (C) the rate of full embryo r2 resistance allele formation, and (D) the rate of embryo mosaicism. DGRP, Drosophila Genetic Reference Panel.
Resistance alleles can also form at a later stage in the progeny of females with the drive due to maternally deposited Cas9 and gRNA (Champer et al. 2017, 2018). This embryo resistance allele formation rate can range from 0% (no paternally inherited wild-type alleles converted to resistance alleles in the embryo) to 100% (all paternally inherited wild-type alleles converted to resistance alleles). From female progeny data, the rate at which r2 resistance alleles formed in the early embryo in flies that inherited the drive varied from 7.2 to 79.4%, averaging 42 ± 18% (Figure 2C and Figure S1). Such variation was highly significant (P < 2×10⁻¹⁶, F = 22.26, ANOVA). In addition to r2 resistance alleles that form in the early embryo and give a full yellow phenotype, Cas9 activity that persists beyond the early embryo and forms resistance alleles at later developmental stages (which are thus not inherited by all cells in the individual) can result in a mosaic phenotype (Figure 2D). The rate of mosaic phenotype formation is related to the rate of full embryo resistance allele formation (Figure S2A). To factor out the effect of the embryo r2 rate and focus on differences between lines in the embryo mosaicism rate, we examined the difference between the observed rate of mosaicism and the expected level, and found moderate variation among the DGRP lines (Figure S2B).
Examining three DGRP lines with low, medium, and high embryo resistance using a separate gene drive targeting the white gene with otherwise identical components produced a similar pattern of embryo resistance (Data S3 and Figure S3), indicating that the level of variation observed is not peculiar to our target site.
GWAS identifies genes affecting drive performance
Our DGRP phenotype data allowed us to identify genetic variants that affect drive performance and assess their effect sizes. A total of 903,282 SNPs were included in the cryptic relatedness-compensated GWAS using the phenotype data from our 128 DGRP lines. A univariate linear mixed model was applied and the Wald test was performed to estimate a P-value for each variant. Q-Q plots were generated to verify that the relatedness among DGRP lines was compensated and to demonstrate the expected amount of SNP hits (Figure 3). P-values were calculated with multiple testing correction using the Benjamini–Hochberg procedure (Benjamini and Hochberg 1995; Dalmasso et al. 2005). One compelling result from this study is that, despite the large and highly significant genetic variance among lines with the scored drive phenotypes, no marker SNP attained genome-wide significance. Even with a 50% false discovery rate, analysis of the drive conversion rate and the rate of wild-type male progeny (which may have been wild-type or possessing an r1 allele) produced no SNP hits (Figures S4 and S5). This implies that rather than having large effect variants in the genetic background, the variation probably includes multiple loci of relatively small effect. Rare alleles of large effect or epistatic interactions between alleles could also account for this result.
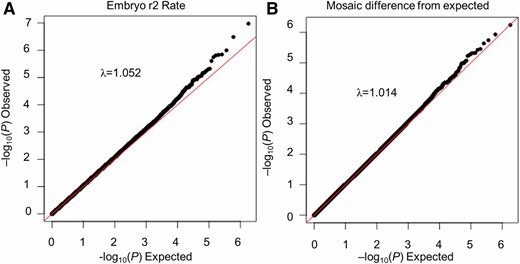
Quantile–quantile analysis of genome-wide association study for drive performance among the Drosophila Genetic Reference Panel lines. A plot of expected vs. observed −log10(P-value) for each hit for (A) the rate of full embryo r2 resistance allele formation, and (B) the difference between expected and observed embryo mosaic rates.
For early embryo r2 resistance allele formation rate, 63 polymorphisms were found using a very relaxed 50% false discovery rate threshold (Figure 3A, Figure 4A, and Data S1). Q-Q analysis showed a genomic inflation factor of λ = 1.052, indicating that P-values were not substantially inflated due to relatedness or other factors. The top hits were annotated for location relative to known genes and the functions of such genes were also manually annotated. Functions most likely to be considered related to the embryo r2 rate were transcription and translation factors, mRNA and protein degradation factors, genes related to DNA repair, and genes of unknown function. Such functions could affect the amount of Cas9 deposited in embryos and, thus, the rate of cleavage and embryo r2 formation. Preferred location was within a gene or a potential promoter region, but not deep within an intron (over 1 kb away from a coding sequence). Based on these locations and functions, a selection of the most promising genes was obtained, including CG5009, Dlish, CG7220, Camta, and pum (Table 1). The top two hits in the analysis were in the pyd gene, but since they were deep within an intron of this gene it was not included in the list of the most promising genes.
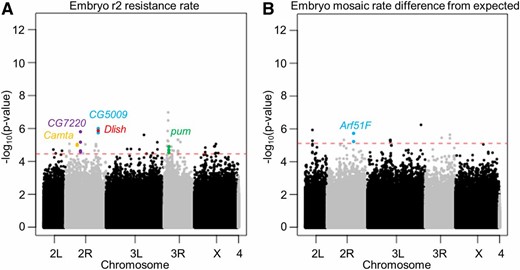
Manhattan plot shows top hits from the genome-wide association study analysis. Each dot shows the location and P-value of a single polymorphism of the (A) early embryo r2 resistance allele formation rate, and (B) embryo mosaic rate difference from the expected value. The red dashed line shows the P-value cutoff corresponding to a 50% false discovery rate. Hits from Table 1 are colored.
Candidate genes for embryo resistance rates
| SNP location | P-value | Hits | Gene | Location | Molecular function |
|---|---|---|---|---|---|
| Full early embryo r2 resistance allele formation rate | |||||
| chr2R:17762194 | 1.01E−06 | 2 | CG5009 | Coding sequence | Dehydrogenase/oxidase |
| chr2R:17723899 | 1.48E−06 | 1 | Dlish | Intron | Cadherin binding |
| chr2R:10738229 | 1.54E−06 | 4 | CG7220 | 3′-UTR | Ubiquitin-conjugating |
| chr2R:9457770 | 9.58E−06 | 2 | Camta | Promoter/intron | Transcription activator |
| chr3R:9081589 | 1.27E−05 | 3 | pum | Intron | Post-transcriptional repressor |
| chr3R:12693319 | N/A | N/A | Arp1 | Coding sequence | Cytoskeleton/microtubule |
| chr3R:12657943 | N/A | N/A | CG6225 | Coding sequence | Aminopeptidase |
| Embryo mosaic rate difference from the expected value | |||||
| chr2R:15324753 | 1.81E−06 | 2 | Arf51F | 3′-UTR | GTP hydrolase |
Note: only the hit with the lowest P-value for each gene is shown. N/A indicates top hits from an earlier analysis with fewer Drosophila Genetic Reference Panel lines, but not providing any significant hits in the full analysis. chr, chromosome.
| SNP location | P-value | Hits | Gene | Location | Molecular function |
|---|---|---|---|---|---|
| Full early embryo r2 resistance allele formation rate | |||||
| chr2R:17762194 | 1.01E−06 | 2 | CG5009 | Coding sequence | Dehydrogenase/oxidase |
| chr2R:17723899 | 1.48E−06 | 1 | Dlish | Intron | Cadherin binding |
| chr2R:10738229 | 1.54E−06 | 4 | CG7220 | 3′-UTR | Ubiquitin-conjugating |
| chr2R:9457770 | 9.58E−06 | 2 | Camta | Promoter/intron | Transcription activator |
| chr3R:9081589 | 1.27E−05 | 3 | pum | Intron | Post-transcriptional repressor |
| chr3R:12693319 | N/A | N/A | Arp1 | Coding sequence | Cytoskeleton/microtubule |
| chr3R:12657943 | N/A | N/A | CG6225 | Coding sequence | Aminopeptidase |
| Embryo mosaic rate difference from the expected value | |||||
| chr2R:15324753 | 1.81E−06 | 2 | Arf51F | 3′-UTR | GTP hydrolase |
Note: only the hit with the lowest P-value for each gene is shown. N/A indicates top hits from an earlier analysis with fewer Drosophila Genetic Reference Panel lines, but not providing any significant hits in the full analysis. chr, chromosome.
In addition to the full embryo r2 resistance allele formation rate, we also analyzed the difference between the mosaicism rate compared to the expected mosaicism rate based on the embryo r2 rate (Figure 3B and Figure 4B). This adjustment allowed us to factor out the polymorphisms associated with the embryo r2 rate, and focus on those that allowed Cas9 activity to persist for particularly long or short periods of time beyond the early embryo. Twelve hits were obtained with a 50% false discovery rate (Data S5), of which a single gene, Arf51F, was considered a top hit based on location and function (Table 1).
shRNA knockdown of candidate genes from the GWAS hits affects resistance allele formation
D. melanogaster lines expressing shRNA under control of the UAS promoter against the genes from Table 1 were obtained, together with control lines from which the shRNA lines were derived, to verify our top GWAS hits. These were introgressed (see Materials and Methods) into drive heterozygote females together with a GAL4 gene under control of the β-actin promoter. These flies were crossed to w1118 males and the resulting progeny (averaging 592 per line) were phenotyped to assess drive performance (Data S6). After multiple testing correction, shRNA against Camta was found to significantly reduce the rate of embryo r2 resistance formation from 42 to 26%, while shRNA against pum increased the embryo resistance rate to 60% (Figure 5). Note that no SNPs at these genes showed significant P-values in the GWAS despite the statistical significance of the shRNA results. This is likely because these SNPs had low effect sizes due to their modest effects on the expression or activity of these genes, whereas shRNA has the potential to substantially reduce expression of the target genes and cause a more dramatic phenotype.
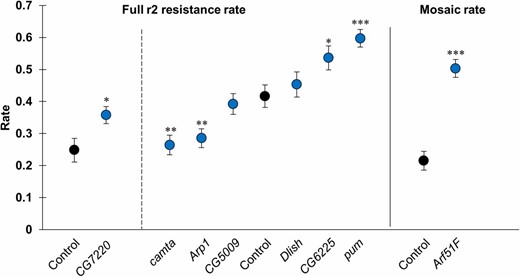
Short hairpin RNAs (shRNAs) against hits from the genome-wide association study affect the embryo resistance rate. Each blue point represents the embryo resistance rate ± SE in a single shRNA line, and black points represent control lines. The dashed line separates two sets of shRNA lines that each correspond to a different control line. The solid line separates lines analyzed for full embryo r2 resistance and mosaic resistance. * P < 0.05, ** P < 0.01, *** P < 0.001, Fisher’s exact test, comparing with the corresponding control line. After multiple testing correction, only the points marked ** or *** were considered significant.
Two more genes, Arp1 and CG6225 (Table 1), were also included in the shRNA analysis (Figure 5). These were top hits from a preliminary analysis, but not our full analysis including all DGRP lines tested. Of these, Arp1 had a statistically significant effect, reducing the embryo resistance rate from 42 to 29%. Additional shRNAs were tested against Lig4 and Irbp (Ku70), genes known to be involved in end-joining pathways and therefore possibly involved in resistance allele formation. Four additional genes with similar functions to our GWAS hits (grn, transcription factor; CG42674, signaling and morphogenesis; vg, developmental transcription factor; and CG4984, unknown function) were also targeted with shRNA. However, no significant effects of these six shRNAs were observed after multiple testing correction on any performance parameters (Data S6).
An shRNA against Arf51F was found to increase the embryo r2 mosaicism rate from 22% in the control line to 50% (Figure 5 and Data S6), which was statistically significant (P < 0.001, Fisher’s exact test). The difference in the full embryo resistance rates between these lines was < 1%. No statistically significant results were observed when assessing the differences in the mosaicism rates for all other shRNA lines.
Discussion
Here, we examined natural variation in the performance of CRISPR homing gene drives. We found that the rate of resistance allele formation in the embryo varies widely among lines, indicating that there is naturally occurring genetic variation affecting the efficacy of gene drives. This is particularly noteworthy because embryo resistance is a key obstacle that gene drives must overcome to attain performance sufficient for success in the wild (Gantz et al. 2015; Hammond et al. 2015, 2017; Champer et al. 2017, 2018). A GWAS analysis covering 128 DGRP lines did not reveal any genetic loci of large effect size for embryo resistance rate and, as is often the case with these DGRP studies with a limited number of lines, no marker attained a genome-wide false discovery rate < 5%. This implies that D. melanogaster may have extensive polygenic variation (i.e., many loci of small effect) that can potentially respond to selection to increase resistance to gene drives. The presence of such variation could therefore profoundly affect the performance of gene drives in natural populations. Another explanation for our results would be rare alleles with large effect sizes, which could be even more problematic for successful gene drive applications if some populations possess multiple copies of such alleles at higher abundances. A GWAS with greatly relaxed stringency (false discovery rate of 50%) did identify several putative gene target hits after extensive curation, which were tested for effect by shRNA-based knockdown. This revealed several genes affecting embryo resistance and may provide some insight into relevant pathways that may be the cause of evolved resistance. However, the effect sizes of the variants in the DGRP lines were uniformly small, implying that these genes would not likely be highly useful targets for manipulation to improve drive performance.
Embryo resistance is caused by cleavage of a (usually paternally inherited) wild-type allele in the early embryo by gRNA and Cas9 protein, which can be maternally deposited or newly expressed from maternal mRNA. Thus, factors that could directly affect this include those that may affect the transcription and translation levels of Cas9, while others could affect the degradation rates of the RNAs and Cas9 protein. Some of these factors may affect all homing drives, while others could be specific to the nanos promoter and untranslated regions in the particular construct that we used. Our GWAS and shRNA verification revealed several genes with functions that could potentially affect these, including camta, a transcription factor, and pum, a post-transcriptional repressor. The potential effect of Apr1, which is involved in the cytoskeleton or microtubules, on embryo resistance allele formation is less clear. Arf51F, a GTP hydrolase, also appeared to affect the rate at which Cas9 protein, or mRNA, can persist into later stages of the embryo and form mosaic resistance alleles, though it apparently did not affect the rate in the early embryo. Since mosaic individuals could still perform successful drive conversion according to a previous study (Champer et al. 2019), it is less clear how mosaic Cas9 activity may directly affect drive performance. However, population suppression drives or population replacement drives targeting haplolethal genes would likely be negatively affected by such mosaic Cas9 activity.
The results presented here beg the question of how gene drives might be better engineered for improved efficiency or to be unresponsive to the background genetic variation that we detected. Since some of the shRNAs, namely camta and Arp1, reduced the rate of early embryo resistance allele formation, it may be possible in future studies to reduce resistance rates by lowering expression of these genes. These shRNAs could potentially be used together, multiplexed with several gRNAs using the tRNA (Xie et al. 2015; Port and Bullock 2016; Schwartz et al. 2016) and/or ribozyme (Gao and Zhao 2014; Nissim et al. 2014; Yoshioka et al. 2015; Zhang et al. 2017) systems, which also have more flexibility in their promoter. Indeed, the U6 promoters most often used for gRNAs may not be appropriate for shRNA use, since these shRNAs may impose a moderate or even severe fitness cost. This is likely, since natural variants in the DGRP lines did not affect the phenotype to the same degree as the shRNA knockdown, implying that a similar level of knockdown is selected against. However, even if an improved drive construct incorporating such an RNA interference gene functioned successfully, our data indicate that embryo resistance would only be modestly reduced. The polygenic basis of the variation in resistance that was quantified here poses one of the most serious challenges to perfection of an effective gene drive for deployment in a natural population. Although we only tested this in D. melanogaster, there is no reason to expect that other gene drive systems would be much different.
Our results underscore the need to test gene drives in a set of genetically diverse lines in the specific target species to gain a more realistic understanding of how they may perform in natural populations. Among the DGRP lines, we found that individuals could vary > 10-fold in embryo resistance, an effect that would likely be further exaggerated in natural populations compared to our experiments, in which the drive heterozygotes all shared 50% of their genome, with variation only occurring in the 50% from the DGRP lines. Modeling studies that aim to simulate and predict the population dynamics of gene drives should also take such variation into account, since certain individuals or regions with particular polymorphisms may experience much higher or lower rates of resistance.
Acknowledgments
We thank Yassi Hafezi for helpful advice on the experimental work, Ana Marija Jakšić for helpful comments on the manuscript, Robert Unckless for useful discussions and comments on the study, and Anthony Long and two anonymous reviewers for their thoughtful suggestions that improved the manuscript. This study was supported by start-up funds from the College of Agriculture and Life Sciences at Cornell University to P.W.M. and the National Institutes of Health (awards R21 AI-130635 to J.C., A.G.C., and P.W.M. and F32 AI-138476 to J.C).
Footnotes
Supplemental material available at Figshare: https://doi.org/10.25386/genetics.7897544.
Communicating editor: A. Long
Literature Cited
Burt, A., 2014 Heritable strategies for controlling insect vectors of disease. Philos. Trans. R. Soc. Lond. B Biol. Sci. 369: 20130432 (erratum: Philos. Trans. R. Soc. Lond. B Biol. Sci. 369: 20140217). https://doi.org/10.1098/rstb.2013.0432
Author notes
These authors contributed equally to this work.
