


Abstract
Interactions among divergent elements of transcriptional networks from different species can lead to misexpression in hybrids through regulatory incompatibilities, some with the potential to generate sterility. While the possible contribution of faster-male evolution to this misexpression has been explored, the role of the hemizygous X chromosome (i.e., the dominance theory for transcriptomes) remains yet to be determined. Here, we study genome-wide patterns of gene expression in females and males of Drosophila yakuba, Drosophila santomea and their hybrids. We used attached-X stocks to specifically test the dominance theory, and we uncovered a significant contribution of recessive alleles on the X chromosome to hybrid misexpression. Our analyses also suggest a contribution of weakly deleterious regulatory mutations to gene expression divergence in genes with sex-biased expression, but only in the sex toward which the expression is biased (e.g., genes with female-biased expression when analyzed in females). In the opposite sex, we found stronger selective constraints on gene expression divergence. Although genes with a high degree of male-biased expression show a clear signal of faster-X evolution of gene expression, we also detected slower-X evolution in other gene classes (e.g., female-biased genes). This slower-X effect is mediated by significant decreases in cis- and trans-regulatory divergence. The distinct behavior of X-linked genes with a high degree of male-biased expression is consistent with these genes experiencing a higher incidence of positively selected regulatory mutations than their autosomal counterparts.
POPULATION genetics models predict that, under certain conditions, X-linked loci will show accelerated divergence relative to autosomal loci (i.e., faster-X evolution) (Charlesworth et al. 1987; Orr and Betancourt 2001; Betancourt et al. 2002; Vicoso and Charlesworth 2006, 2009a; Mank et al. 2010b). Faster-X evolution can, in principle, result from the contributions of either beneficial or weakly deleterious mutations to the rates of evolution. On the one hand, the fitness effects of new X-linked recessive beneficial mutations are fully exposed in hemizygous males, which significantly increases their chances of spreading and contributing to the rate of evolution. On the other, weakly deleterious mutations that are partially dominant can also produce faster-X because the efficacy of purifying selection can be slightly reduced on the X chromosome. This is because the effective population size of the X chromosome (NeX) is often reduced relative to that of autosomes (NeA) due to its hemizygosity in males. Theoretical models also show that the chances of observing faster-X evolution are very sensitive to the ratio NeX/NeA (Vicoso and Charlesworth 2009a; Mank et al. 2010b) and any parameter that impacts this ratio, including demographic changes and differences in recombination rates between the X chromosome and autosomes (Langley et al. 1988; Connallon 2007; Pool and Nielsen 2007; Vicoso and Charlesworth 2009b; Charlesworth 2012; Comeron et al. 2012; Ávila et al. 2015). For certain NeX/NeA values, faster-X evolution can even occur independently of the coefficient of dominance. For instance, beneficial mutations will generate faster-X evolution for any coefficient of dominance when NeX/NeA ≥ 1; equivalently, weakly deleterious mutations will produce faster-X when NeX/NeA ≤ 0.65 (Vicoso and Charlesworth 2009a; Mank et al. 2010b).
Today, there is ample evidence supporting faster-X evolution of protein-coding sequences in a variety of organisms, including XY and ZW systems (Thornton and Long 2002, 2005; Torgerson and Singh 2003, 2006; Counterman et al. 2004; Khaitovich et al. 2005; Lu and Wu 2005; Nielsen et al. 2005; Musters et al. 2006; Baines and Harr 2007; Begun et al. 2007; Mank et al. 2007, 2010a; Baines et al. 2008; Singh et al. 2008; Ellegren 2009; Grath and Parsch 2012; Meisel and Connallon 2013; Vicoso et al. 2013; Ávila et al. 2014, 2015; Garrigan et al. 2014; Kousathanas et al. 2014; Sackton et al. 2014; Veeramah et al. 2014; Coolon et al. 2015; Llopart 2015; Larson et al. 2016). Faster-X evolution has also been reported for gene expression divergence (Khaitovich et al. 2005; Brawand et al. 2011; Kayserili et al. 2012; Llopart 2012; Meisel et al. 2012; Coolon et al. 2015; Dean et al. 2015) and intergenic DNA sequences (Hu et al. 2013; Coolon et al. 2015; Llopart 2018), likely reflecting the effects of natural selection on the evolution of regulatory elements. In species where males are the heterogametic sex, faster-X is expected to be strongest in genes with male-specific fitness effects because these genes are always hemizygous when they are X-linked. A similar rationale applies to genes with female-specific fitness effects in ZW systems (Betancourt et al. 2002; Vicoso and Charlesworth 2009a; Mank et al. 2010b).
Regardless of the evolutionary forces driving faster-X (Z) evolution (positive selection or relaxed negative selection), its implications for the genetic basis of hybrid dysfunction are clear: the X chromosome will disproportionally contribute to between-species Dobzhansky-Muller incompatibilities (Dobzhansky 1937; Muller 1942; Coyne and Orr 1989). Even a slightly elevated substitution rate on the X chromosome will be amplified in hybrids, as the number of incompatibilities increases exponentially with divergence time (Orr 1995; Turelli and Orr 2000; Matute et al. 2010; Moyle and Nakazato 2010; Guerrero et al. 2017). Mapping studies in a variety of species including mice, Lepidoptera, and Drosophila have shown that the factors having the largest effects on hybrid dysfunction, particularly hybrid male sterility, are X-linked (Coyne and Orr 1989, 2004; Coyne et al. 1991; Coyne 1992). Orr’s (1987) seminal study of the genetic basis of sterility in Drosophila pseudoobscura–Drosophila persimilis hybrids constitutes a classic example of this pattern known as the large X-effect. The large X-effect, together with Haldane’s rule (i.e., the preferential inviability or sterility of the heterogametic over the homogametic sex; Haldane 1922), underline the importance of sex chromosomes in speciation (Coyne and Orr 1989; Masly and Presgraves 2007, 2008; Moyle et al. 2010; Johnson and Lachance 2012).
The large X-effect can also be explained by the dominance theory (Turelli and Orr 1995, 2000; Orr and Turelli 1996), which posits that alleles causing hybrid dysfunction tend to act recessively in hybrids (Muller 1940, 1942). As a result, hemizygous X chromosomes will express all incompatibilities (dominant and recessive) while heterozygous autosomes will express only the fairly dominant ones. In the context of gene regulation, the dominance theory, if confirmed, opens the possibility that a large fraction of the abundant misexpression observed in hybrid males, but not in hybrid females, may be due to regulatory incompatibilities involving X-linked recessive mutations. Disruption of gene expression in hybrids has been extensively documented in Drosophila, and it is often the case that rapidly evolving genes tend to be over-represented among misexpressed genes (Reiland and Noor 2002; Michalak and Noor 2003, 2004; Ranz et al. 2004; Landry et al. 2005; Noor 2005; Haerty and Singh 2006; Artieri et al. 2007; Barbash and Lorigan 2007; Moehring et al. 2007; Catron and Noor 2008; Sundararajan and Civetta 2011; Llopart 2012; Maheshwari and Barbash 2012; Satyaki et al. 2014; Wei et al. 2014; Gomes and Civetta 2015). While the potential link between faster-male evolution (Wu and Davis 1993; Wu et al. 1996) and hybrid misexpression has been explored (Noor 2005; Haerty and Singh 2006; Ortíz-Barrientos et al. 2007; Civetta 2016; Mack and Nachman 2017), the dominance theory for hybrid transcriptomes remains untested.
Here, we examine genome-wide patterns of transcript abundance for 11,949 genes with variable degrees of sex-biased expression in females and males of Drosophila yakuba, Drosophila santomea and their interspecific hybrids using RNAseq technology. Our experimental design includes females with standard karyotypes and females carrying attached-X chromosomes, which allowed us to test the dominance theory for transcriptomes. The comparative analysis of female and male transcriptomes reveals consistent differences in gene expression divergence between the two sexes for genes with sex-biased expression, in agreement with different selective regimes. Genes with a high degree of male-biased expression show a strong and significant signal of faster-X evolution of gene expression in a slower-X evolution background. We also detect that recessive alleles on the X chromosome play a significant role in hybrid misexpression, hence confirming predictions of the dominance theory.
Materials and Methods
Fly stocks
We used the D. yakuba Taï18E2 and the D. santomea STO.4 stocks to obtain an overall view of gene expression variation between species and in F1 hybrid females and males. The D. yakuba Taï18E2 was part of the 12 Drosophila Genomes project, originated in the Taï rainforest (Taï National Park, Ivory Coast), and was inbred for at least 10 generations of single-pair brother/sister mating before whole-genome sequencing (Drosophila 12 Genomes Consortium et al. 2007). The STO.4 stock of D. santomea was established from a single fertilized female collected in the Obo Natural Reserve on São Tomé (Lachaise et al. 2000), and was inbred for 10 generations. To generate “unbalanced” F1 hybrid females with two D. yakuba X chromosomes, D. yakuba females of the attached-X stock [C(1)RM y, wor females, + males] were crossed to D. santomea males of the attached-X stock [C(1)RM g females, + males] (Coyne et al. 2004); F1 hybrid females with two D. santomea X chromosomes were also generated from the reciprocal cross. Attached-X hybrid females carry two X chromosomes from the same (maternal) species, a haploid set of autosomes from each parental species, and a Y chromosome from the paternal species. Figure 1 shows the specific karyotypes analyzed in this study. All flies were raised on standard cornmeal-yeast-agar medium at 24° with a 12 hr dark-light cycle.
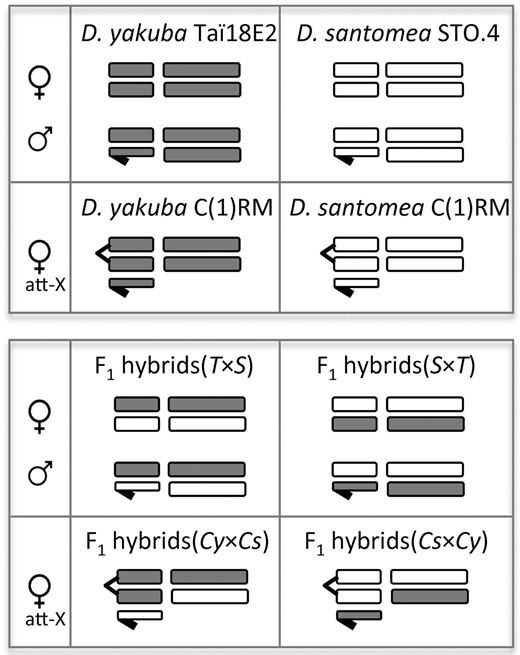
Diagram of the karyotypes analyzed in this study. Horizontal short bars represent sex chromosomes (the Y chromosome is shown with a hook) while long bars represent autosomes. Gray, D. yakuba chromosomes; white, D. santomea chromosomes. Att-X, attached-X females; T × S, hybrids of first generation from the cross between D. yakuba Taï18E2 females and D. santomea STO.4 males; S × T, hybrids of first generation from the cross between D. santomea STO.4 females and D. yakuba Taï18E2 males; Cy × Cs, hybrids of first generation from the cross between D. yakuba C(1)RM females and D. santomea C(1)RM males; Cs × Cy, hybrids of first generation from the cross between D. santomea C(1)RM females and D. yakuba C(1)RM males. RNAseq detailed information for each of the 12 karyotypes/genotypes is shown in Table S1.
RNA isolation, library preparation, and sequencing
Females and males were collected under CO2 anesthesia 0–5 hr post eclosion, aged for 19 hr at 24°, snap-frozen in liquid nitrogen, and stored at −80°. For each genotype analyzed, total RNA was isolated from a pool of 15 females or 30 males using TRIzol reagent (Invitrogen) and following the manufacturer’s recommendations. Up to 15 μg of nucleic acid were treated with RNase-free DNase I (∼7 Kunitz units) in solution (“RNase-free DNase set”; Qiagen) and cleaned-up using the RNeasy Mini Kit (Qiagen). We used ∼1 μg of total RNA to prepare libraries suitable for high throughput sequencing following the Illumina protocol (“mRNA Sample Preparation Guide”; Cat. # RS-930-1001, Part # 1004898 Rev. D; Illumina). Briefly, poly-A containing RNA molecules were purified using poly-T oligo-attached magnetic beads. Following this purification, the mRNA was fragmented into small pieces using divalent cations under elevated temperature. The first-strand cDNA was copied using reverse transcriptase and random hexamers while the second cDNA strand was synthesized using DNA polymerase I and RNAse H. The fragmented cDNA went through the end repair process, addition of a single “A” base, and ligation to custom-designed adapters. These include unique seven-nucleotide tags that allowed multiplexing of several samples prior to sequencing. The sequences and a detailed description of these custom-designed adapters can be found elsewhere (Comeron et al. 2012).
We ran the ligation products on a 2% agarose gel, selected for ∼250 bp size, and recovered cDNA templates using the QIAquick Gel Extraction Kit (Qiagen). These cDNA templates were enriched with PCR to create the final cDNA libraries, which were validated using a 2100 Bioanalyzer (Agilent Technologies). For each genotype analyzed, we obtained two replicates using the same total RNA. Cluster generation and sequencing were carried out on HiSeq 2000/2500 instruments at the Iowa Institute of Human Genetics (IIHG; University of Iowa) or at the Iowa State DNA facility (Iowa State University) using a combination of multiple lanes per sample (single-end 100 cycles/read or 125 cycles/read). Sequence reads were sorted out according to individual tags, 3′ trimmed (-t 12 -l 30) and filtered based on quality (-q 12 and -p 75) using the FASTX-toolkit (0.0.14) (http://hannonlab.cshl.edu/fastx_toolkit/commandline.html). The average number of trimmed reads that passed quality filtering across samples was 51.5 million and 31.3 million for replicates 1 and 2, respectively. Supplemental Material, Table S1 shows the number of sequence reads and the median number of mapped fragments per kilobase of transcript for each of the 12 genotypes analyzed (two replicates per genotype).
Gene expression analyses
To examine genome-wide transcript abundance, we first generated the D. yakuba reference gene set (14,687 genes) based on the genome sequence and annotation of coding sequences (CDS) available in FlyBase (dyak_r1.3_FB2011_08; http://flybase.org/) (Gramates et al. 2017). Genes on Arm U and random sequence scaffolds were not included. To allow reads covering 5′ and 3′ UTRs, we expanded the CDS definitions by 75 bp upstream and downstream of starting and stop codons, respectively. Exon and UTR sequences were extracted using tools available in Galaxy (https://usegalaxy.org/) (Afgan et al. 2016) and assembled with custom scripts.
Trimmed and quality filtered reads were mapped to the D. yakuba reference gene set with Bowtie 2 (version 2.1.0) using default parameters (Langmead and Salzberg 2012). Bam files were sorted and indexed with SAMtools [version 0.1.18 (r982:295)] (Li et al. 2009), and the number of reads aligned to each of the genes was calculated using RSEM (version 1.3.0) (Li and Dewey 2011). We only considered for further analyses genes with at least 10 mapped reads and > 1 FPKM (fragments per kilobase of transcript per million mapped reads) in both species and in at least one sex.
All gene expression analyses were carried out combining sequence reads from both replicates. To classify genes into different sex-biased expression categories that were consistent across species, we took advantage of a DESeq2 (version 1.16.1) multifactor design with two variables (∼species + sex) and used the absolute effect size estimate [abs(Log2FoldChange)] as a measure of the degree of sex-biased expression (Love et al. 2014). Quantitative estimates of differences in gene expression between species, between parental species and hybrids (degree of misexpression), and between reciprocal interspecific hybrids, were also based on size factors from DESeq2. DESeq2 implements the Benjamini-Hochberg probability adjustment (padj) to correct for multiple testing (Benjamini and Hochberg 1995). Genes were considered to show statistically significant differences in expression if padj < 0.05 [false discovery rate (FDR) = 0.05]. We excluded genes showing switches across species between sex-biased expression categories (e.g., genes with male-biased expression in D. yakuba but female-biased expression in D. santomea). We analyzed gene expression for a total of 11,959 genes.
Analyses of cis- and trans-regulatory variation
The detection of cis- and/or trans-regulatory variation is usually based on comparing the ratio of allelic expression in hybrids (i.e., allelic ratio) with the ratio of expression between species (i.e., species ratio) (Wittkopp et al. 2004; McManus et al. 2010; Coolon et al. 2014). With mRNAseq data, this requires the identification of stock-specific reads based on whole-genome consensus sequences for the D. yakuba Taï18E2, the D. santomea STO.4, the D. yakuba C(1)RM, and the D. santomea C(1)RM stocks. The initial mapping steps for generating these new genome sequences were the same as those used for the analysis of transcript abundance (see above) except that, in this case, we used the D. yakuba reference genome sequence to align D. yakuba reads and a draft of the D. santomea genome sequence (Llopart 2015) to align D. santomea reads. SAMtools was used to (1) sort/index BAM files, (2) filter sites with mapping quality < 40, and (3) generate mpileup files with a maximum depth of 100,000 reads and a minimum base alignment quality of 30 (Li et al. 2009). To filter out sites covered by fewer than five reads and to obtain fastq files of consensus sequences, we used the utility BCFtools (1.3.1) (Li et al. 2009). Fastq files for each of the four consensus sequences were converted into fasta format and heterozygous sites were randomly phased using Heng Li’s seqtk (https://github.com/lh3/seqtk). To minimize mapping biases across comparisons, regions containing ambiguous bases or missing base calls in at least one of the consensus sequences were masked in all the other consensus sequences.
Based on comparisons between allelic and species ratios, we classified genes into six different regulatory evolution classes (cis only, trans only, cis + trans, cis × trans, compensatory, and conserved) following McManus et al. (2010). For each type of hybrid analyzed, we identified stock-specific reads as those mapping with 0 mismatches to only one of the parental consensus sequences. For a given gene, the relative numbers of the two types of stock-specific reads in hybrids provide an estimate of the allelic ratio of gene expression, which was calculated as log2(read count allele 1/ read count allele 2). For example, in hybrid females of the cross between D. yakuba Taï18E2 females and D. santomea STO.4 males, allele 1 and allele 2 refer to the reads obtained from the sample of hybrid females that map specifically to the sequences of the D. yakuba Taï18E2 and the D. santomea STO.4 stocks, respectively. The allelic ratio constitutes a quantitative measure of cis-regulatory divergence for every gene analyzed. To obtain an estimate of the species ratio of expression, we first constructed an in silico parental mixture by combining equal numbers of stock-specific reads from each of the two parental stocks used to generate the different hybrid types, as in Coolon et al. (2014). For a given gene, the species ratio was then calculated as log2(read count genotype 1/ read count genotype 2) where genotype 1 and genotype 2 refer to the stock-specific reads in the in silico parental mixture (Coolon et al. 2014, 2015). The difference between species and allelic ratios [log2(read count genotype 1/read count genotype 2)−log2(read count allele 1/read count allele 2)] provides a quantitative measure of trans-regulatory divergence for each gene analyzed. Binomial exact tests were used to detect differences between read counts of allele 1 and allele 2, and also between read counts of genotype 1 and genotype 2. A χ2 test was applied to detect differences between allelic and species ratios. Sequential Bonferroni correction for multiple testing was used (FDR = 0.05). Only genes with at least 20 stock-specific mapped reads for the two types of alleles and genotypes were included in the analyses.
Estimates of selection on gene expression variation
Selection acting on gene expression variants for genes with female-biased expression was estimated as the scaled selection coefficient γ (2 Ne s, where Ne is the effective population size and s the selection coefficient) for an arbitrary coefficient of dominance (h; 0 ≤ h ≤1). Based on predictions of the infinitely many sites model (Kimura 1964; Crow and Kimura 1970), rates of evolution and levels of divergence depend on Ne, s, h, and the mutation rate. In particular, γ can be estimated solely as a function of h conditional to knowing estimates of divergence at regions with differences in Ne if mutation rates are assumed to be equivalent. We took advantage of the estimated difference in Ne between the dot chromosome and other autosomes based on D. yakuba intron polymorphism data (Llopart 2018), with the Ne of the dot chromosome being 11.1% that of the other autosomes.
Data availability
The authors state that all data necessary for confirming the conclusions presented in the manuscript are represented fully within the manuscript. All sequence reads have been archived at NCBI SRA BioProject PRJNA470895. Supplemental material available at Figshare: https://doi.org/10.25386/genetics.6981560.
Results
To understand the role of the X chromosome in hybrid gene expression, we examined transcript abundance in 1-day old virgin females and males of Drosophila yakuba, D. santomea and their interspecific hybrids. Our experimental design includes not only flies with standard karyotypes but also females bearing attached-X chromosomes (Coyne et al. 2004) (Figure 1). Attached-X hybrid females show the same degree of autosome-sex chromosome mismatch as that of hybrid males, and constitute an ideal genetic tool to study the effects of X-linked recessive factors. We obtained profiles of transcript abundance for 10,128 and 11,663 genes expressed in adult females and males, respectively. To investigate the effects of sexually dimorphic gene expression, we classified all genes into seven distinct categories based on degree of sex-biased expression (Figure 2 and Table S2). Importantly, this gradual classification allows for comparisons across studies regardless of statistical power. Additionally, to capture extreme sex-biased effects, we also identified female- and male-specific genes (FSGs and MSGs). FSGs (or MSGs) are defined as those showing < 1 FPKM in males (or females) and statistically significant differences in expression between the two sexes that are consistent across the two species. They are a subset of the most extreme sex-biased category (fold change between sexes > 3). Genes showing an expression fold change between the two sexes < 1.1 were considered nonsex-biased.
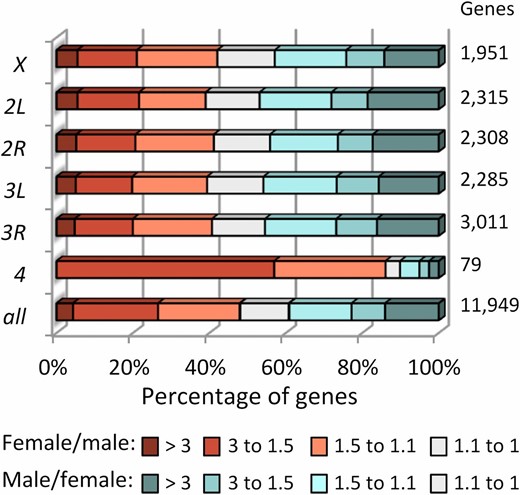
Distribution of genes with different degrees of sex-biased expression across the genome. The number of genes in each class is shown on the right column. See Table S2 for the number of genes in each category.
To investigate the relationship between sexually dimorphic expression and chromosome location in the D. yakuba–D. santomea system, we examined the genome-wide distribution of genes with variable degrees of sex-biased expression (Figure 2). The autosomal dot (fourth) chromosome reveals the most striking pattern, with 86% (68/79) of its genes being female-biased in expression. This represents a significant enrichment relative to the other autosomes [68/79 vs. 3978/9919; Fisher’s exact test (FET), P = 5.08 × 10⁻¹⁷], which we interpret as evidence of ancient feminization of the dot chromosome (Vicoso and Bachtrog 2013, 2015). The X chromosome shows a significant overrepresentation of FSGs relative to autosomes (40/1951 vs. 116/9919; FET P = 0.003) and a trend toward underrepresentation of MSGs (246/1951 vs. 1413/9919; FET P = 0.058).
Gene expression divergence is a sexually dimorphic trait
To understand the molecular causes underlying hybrid misexpression, we first examined gene expression divergence (absolute log2 fold change of transcript abundance between species; see Methods). These analyses uncovered three main patterns. First, gene expression divergence is positively correlated with degree of sex-biased expression {Spearman’s ρ = 0.10 [95% confidence intervals (CI): 0.07–0.13] (P = 1.04 × 10⁻¹¹) for genes with increasingly female-biased expression in females and ρ = 0.30 (95% CI: 0.27–0.32) (P = 3.47 × 10−111) for genes with increasingly male-biased expression in males} (Figure 3). Second, female transcriptomes show smaller gene expression divergence relative to male transcriptomes [0.28 vs. 0.30; Mann-Whitney Test (MWT) P = 6.75 × 10⁻¹² for all genes; 0.26 vs. 0.28; MWT P = 1.89 × 10⁻⁴ for X-linked genes; 0.28 vs. 0.31; MWT P = 1.19 × 10⁻¹⁰ for autosomal genes], which is consistent with faster-male evolution (Wu and Davis 1993; Wu et al. 1996) for gene expression (Meiklejohn et al. 2003; Parisi et al. 2003; Ranz et al. 2003; Haerty et al. 2007). Gene expression also evolves more rapidly in MSGs than in FSGs (0.58 vs. 0.41; MWT P = 0.007). Third, the comparative analysis of the same subset of genes in the female and male transcriptomes reveals that genes with sex-biased expression show high gene expression divergence in the sex toward which the expression is biased while transcript abundance tends to be conserved between species in the opposite sex; the trend is consistently observed across genes with different degrees of either female- or male-biased expression (Figure 3). As a result, some gene categories can show greater gene expression divergence in females than in males. This suggests that, in addition to the pervasive trend of faster-male evolution, there is a signal for rapid evolution in the female transcriptome as well. We suggest that gene expression divergence for genes with sex-biased expression should be studied in the context of a sexually dimorphic trait (see “Discussion”).

Gene expression divergence as a sexually dimorphic trait in the female and male transcriptomes. The horizontal line inside each box indicates the median. The length of the box and the whiskers represent 50% and 90% CI, respectively. The numbers of genes analyzed in each sex-biased category are shown under the female and male symbols. Note that only genes expressed in both sexes were included in the analysis. Probabilities are based on Mann-Whitney tests, where NS indicates not significant, * P < 0.05, ** P < 0.001, *** P < 1 × 10⁻⁴. Gene expression divergence data are based on the comparison of D. yakuba Taï18E2 and D. santomea STO.4 stocks.
Weakly deleterious regulatory mutations contribute to gene expression divergence
To gain insight into the evolutionary forces driving gene expression divergence, we analyzed transcript abundance on the dot chromosome. Because of the highly biased gene composition of this chromosome, we focused on genes with female-biased expression. In Drosophila, the dot chromosome is a unique autosome because it does not experience meiotic recombination. As a consequence, the effective population size and the effectiveness of natural selection on the dot chromosome are severely reduced due to linked selection (Hill and Robertson 1966; Maynard Smith and Haigh 1974; Berry et al. 1991; Charlesworth et al. 1993; Hudson and Kaplan 1995; Charlesworth 1996; Betancourt and Presgraves 2002; Comeron and Kreitman 2002; Jensen et al. 2002; Wang et al. 2002, 2004; Haddrill et al. 2007; Comeron et al. 2008; Betancourt et al. 2009; Arguello et al. 2010).
If weakly deleterious mutations are major contributors to gene expression divergence, we anticipate that gene expression on the dot chromosome will evolve faster than on other autosomes. For female-biased genes this prediction is observed in female transcriptomes (0.62 vs. 0.29; MWT P = 9.65 × 10⁻¹³). Based on this 2.14-fold (0.62/0.29) difference in gene expression divergence, we estimated the scaled selection coefficient γ (2 NeA s) acting on gene expression variation to range between −2.4 (h = 1) and −3.9 (h = 0), in agreement with weak selection.
In male transcriptomes, by contrast, there is no evidence of increased gene expression divergence for female-biased genes on the dot chromosome (0.21 vs. 0.27; MWT P = 0.06), which indicates minimal effects of differences in effective population size and thus suggests selectively strong functional constraints. The presence of only eight genes with male-biased expression on the dot chromosome precludes us from formally testing whether genes with male-biased expression, when expressed in males, show any evidence of weak selection. Overall, the comparison of female and male transcriptomes reveals that variation in gene expression is heavily influenced by weakly deleterious mutations but only in the sex toward which the expression is biased.
Faster-X evolution for gene expression divergence in highly male-biased genes
We also examined gene expression divergence in the context of the comparison between X-linked and autosomal genes. The female transcriptome shows an overall signal in support of slower-X evolution of gene expression (0.25 vs. 0.28; MWT P = 4.81 × 10⁻⁵), although for some gene categories the signal is weak or not significant (Figure 4A). The male transcriptome also shows slower-X evolution for gene expression divergence when all genes are considered as a single class (0.28 vs. 0.31; MWT P = 0.002). Despite this overall trend, we found significant evidence for faster-X evolution of gene expression in genes with a high degree of male-biased expression (Figure 4B). Faster-X is particularly pronounced in MSGs (0.81 vs. 0.54; MWT P = 4.13 × 10⁻¹³). X-linked MSGs show the greatest gene expression divergence of all gene classes, including the fast-evolving female-biased genes on the dot chromosome when expressed in females (0.81 vs. 0.68; MWT P = 0.017).
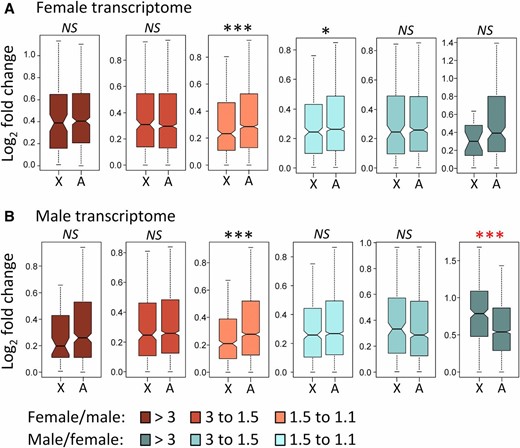
Tests of faster-X evolution for gene expression divergence in the female transcriptome (A) and the male transcriptome (B). Gene expression divergence data are based on the comparison of D. yakuba Taï18E2 and D. santomea STO.4 stocks. X, X chromosome; A, Autosomes. Probabilities are based on Mann-Whitney tests, where NS indicates not significant, * P < 0.05, ** P < 0.001, *** P < 1 × 10⁻⁴. Black and red asterisks indicate slower-X and faster-X, respectively (see Figure 3 legend for boxplot explanation).
To gain insight into the genetic basis (cis- or trans-regulatory) of gene expression divergence, we examined stock-specific expression following Coolon et al. (2015) (Wittkopp et al. 2004; McManus et al. 2010; Coolon et al. 2014) (see also “Materials and Methods”). We found strong positive correlations between gene expression divergence and the magnitude of both cis- and trans-regulatory divergence (Table 1 for hybrids from the cross between D. yakuba Taï18E2 females and D. santomea STO.4 males, and Table S3 for hybrids from the reciprocal cross). These correlations imply that any increase in gene expression divergence is likely to be the result of contributions from both cis- and trans-regulatory variation. For example, the overall trend of slower-X evolution for gene expression divergence in females is accompanied by significantly lower cis- and trans-regulatory divergence for X-linked genes than for autosomal genes (MWT P ≤ 0.005 for all cases; see Table S4). Likewise autosomal genes in the male transcriptome show increased cis- and trans-regulatory divergence relative to the same genes when analyzed in the female transcriptome, as expected from faster-male evolution (MWT P ≤ 0.0012 for all cases; see Table S5). As a result, when we examined the different categories of genes with sex-biased expression, we detected that the fraction of genes with significant cis-regulatory divergence increases with degree of sex-biased expression, and, hence, expression divergence; the same was observed for trans-regulatory divergence (Figure S1 for hybrids from the cross between D. yakuba Taï18E2 females and D. santomea STO.4 males, and Tables S6 and S7 for hybrids from the reciprocal cross).
Spearman’s correlations (ρ) between gene expression divergence and the magnitude of cis- and trans-regulatory divergence
| Transcriptome-Chromosome | Cis- | 95% CI | P | Trans- | 95% CI | P | Number of genes |
|---|---|---|---|---|---|---|---|
| Female-X | 0.48 | 0.43–0.52 | 2.1 × 10−85 | 0.63 | 0.59–0.66 | 2.3 × 10−167 | 1504 |
| Female-auto | 0.50 | 0.48–0.52 | <1 × 10−308 | 0.60 | 0.58–0.61 | <1 × 10−308 | 7087 |
| Male-auto | 0.51 | 0.49–0.53 | <1 × 10−308 | 0.61 | 0.60–0.63 | <1 × 10−308 | 7085 |
Gene expression divergence was estimated using stock-specific reads from the in silico parental mixture; cis- and trans-regulatory divergence was estimated based on F1 hybrids from the cross between D. yakuba Taï18E2 females and D. santomea STO.4 males; CI, Confidence intervals based on bootstrapping (10,000 replicates); X, X chromosome; Auto, autosomes (2 and 3).
| Transcriptome-Chromosome | Cis- | 95% CI | P | Trans- | 95% CI | P | Number of genes |
|---|---|---|---|---|---|---|---|
| Female-X | 0.48 | 0.43–0.52 | 2.1 × 10−85 | 0.63 | 0.59–0.66 | 2.3 × 10−167 | 1504 |
| Female-auto | 0.50 | 0.48–0.52 | <1 × 10−308 | 0.60 | 0.58–0.61 | <1 × 10−308 | 7087 |
| Male-auto | 0.51 | 0.49–0.53 | <1 × 10−308 | 0.61 | 0.60–0.63 | <1 × 10−308 | 7085 |
Gene expression divergence was estimated using stock-specific reads from the in silico parental mixture; cis- and trans-regulatory divergence was estimated based on F1 hybrids from the cross between D. yakuba Taï18E2 females and D. santomea STO.4 males; CI, Confidence intervals based on bootstrapping (10,000 replicates); X, X chromosome; Auto, autosomes (2 and 3).
Recessive regulatory incompatibilities involving the X chromosome contribute to hybrid misexpression
To test the dominance theory for hybrid transcriptomes, we compared gene expression profiles of hybrids and parental species (see Methods). It is important to emphasize that the degree of misexpression of each hybrid genotype was assessed by comparison with the corresponding parental stocks. For example, the degree of misexpression of attached-X hybrid females was determined based on the comparison with females of the D. yakuba and D. santomea attached-X parental stocks combined. To make the female and male transcriptomes comparable, we examined misexpression of autosomal genes only, and limited our analysis to the same subset of genes in females as in males. We found that the hybrid female transcriptome shows a significantly lower degree of misexpression than the hybrid male transcriptome (0.21 vs. 0.32; MWT P = 1.7 × 10−158 for hybrids from the cross between D. yakuba Taï18E2 females and D. santomea STO.4 males; 0.20 vs. 0.34; MWT P < 1×10−308 for hybrids from the reciprocal cross). This observation can potentially be attributed to the hemizygosity of the X chromosome in males, to faster-male evolution, or a combination of both.
To evaluate the contribution of recessive factors on the X chromosome to hybrid misexpression, we examined transcript abundance for autosomal genes in attached-X hybrid females. Reminiscent of males, attached-X hybrid females show a significantly greater degree of misexpression than standard hybrid females [0.29 vs. 0. 21; MWT P = 8.7 × 10−71 for hybrids from the crosses between D. yakuba females [Taï18E2 or C(1)RM] and D. santomea males [STO.4 or C(1)RM]; Table S8 shows equivalent results for hybrids from the reciprocal crosses]. Figure 5 shows the results for the different categories of genes with sex-biased expression. The increased misexpression in attached-X relative to standard hybrid females is also observed in genes with nonsex-biased expression and sex-specific expression, with FSGs showing a particularly extreme pattern (Figure 6). These results suggest that there is a significant fraction of recessive regulatory incompatibilities involving the X chromosome that are masked in standard hybrid females but are fully uncovered in attached-X hybrid females and in hybrid males. The overall degree of misexpression in attached-X hybrid females, however, is not as high as in hybrid males, which suggests that additional factors like faster-male evolution are necessary to fully explain misexpression in hybrid males [0.29 vs. 0. 32; MWT P = 4.0 × 10⁻²³ for hybrids from the crosses between D. yakuba females [C(1)RM or Taï18E2] and D. santomea males [C(1)RM or STO.4]; see Table S8 for hybrids from the reciprocal crosses].
![Misexpression of autosomal genes with different degrees of sex-biased expression in standard hybrid females, attached-X (att-X) hybrid females, and hybrid males. The numbers of genes analyzed in each sex-biased category are shown on top of the panels (chromosomes 2 and 3). Note that only genes expressed in both sexes were included in the analysis. Misexpression data are based on first generation hybrids from the crosses between D. yakuba females [Taï18E2 or C(1)RM] and D. santomea males [STO.4 or C(1)RM]. Probabilities are based on Mann-Whitney tests, where NS indicates not significant, * P < 0.05, ** P < 0.001, *** P < 1 × 10⁻⁴. (See Figure 3 legend for boxplot explanation.).](https://oup.silverchair-cdn.com/oup/backfile/Content_public/Journal/genetics/210/2/10.1534_genetics.118.301229/6/m_703fig5.jpeg?Expires=1750225133&Signature=EaN5ru94S9eiUlGbbctscn6JPhEuQuuv1PvAHpKuvEh~Oq47BD2FondycyUtNCUL7WrG7kqyywK-BGjHpI4wbMMB~FR8o7CmB0hw4L7va7Itj5uNTN5q70w-u31W8dKVLPAydiLLIT0Q90PjURL~mHrgGiq~5hOn-M1In78C~RihcVOqUvUf3J1S~DDcUAVEg3ptRSfz6rZhH7iLORLRi3yN1-3fJ2WeYmQb3h3WrRxYx3OQLu1gegTTtCXT28JEU1zqRraCwcELWmcweHvFVYmiKMY2TJSdO6Wd2iBeojea6Io5kxAG8sa6OBCgqFeX9P4ypztbwiQppqDSZKHzAA__&Key-Pair-Id=APKAIE5G5CRDK6RD3PGA)
Misexpression of autosomal genes with different degrees of sex-biased expression in standard hybrid females, attached-X (att-X) hybrid females, and hybrid males. The numbers of genes analyzed in each sex-biased category are shown on top of the panels (chromosomes 2 and 3). Note that only genes expressed in both sexes were included in the analysis. Misexpression data are based on first generation hybrids from the crosses between D. yakuba females [Taï18E2 or C(1)RM] and D. santomea males [STO.4 or C(1)RM]. Probabilities are based on Mann-Whitney tests, where NS indicates not significant, * P < 0.05, ** P < 0.001, *** P < 1 × 10⁻⁴. (See Figure 3 legend for boxplot explanation.).
![Misexpression of autosomal genes with sex-specific and nonsex-biased expression in standard hybrid females, attached-X (att-X) hybrid females, and hybrid males. The numbers of genes analyzed in each category are shown on top of the panels (chromosomes 2 and 3). FSGs, genes with female-specific expression; MSGs, genes with male-specific expression. Misexpression data based on first generation hybrids from the crosses between D. yakuba females [Taï18E2 or C(1)RM] and D. santomea males [STO.4 or C(1)RM]. Probabilities are based on Mann-Whitney tests, where NS indicates not significant, * P < 0.05, ** P < 0.001, *** P < 1 × 10⁻⁴ (see Figure 3 legend for boxplot explanation).](https://oup.silverchair-cdn.com/oup/backfile/Content_public/Journal/genetics/210/2/10.1534_genetics.118.301229/6/m_703fig6.jpeg?Expires=1750225133&Signature=Yh~QcrNO1CtfgirTCWMm9D5nkJASywL4FMBXh9PnW3amYOvLFodUhC3kZ~oUqb-yObgVsYtNWS3QqkQHd-MvoNYO5TqkoR~tp8xCSfIxUfDif-NDlQHYHJ88qkbwC30Pyv~OmgbwKZ5r-OQNsZdBzZLiuxoNxclCJxQzGgpoQGXVeq7gIbOBsQxj8bb-AJ2piq-BZv66PmGf5rddy9Xza2ft~04zPU6VD29HaUy6WTQ8uX0MaURA1iSqSNTEJ5Q0vTEYRnFFfzu948qU-NuSsW6BodERwr8KqI6zK~FMnxGx3D32aBfy3-ROGaDL1ASNiBMJZwReBpx0AV0t9JtGHg__&Key-Pair-Id=APKAIE5G5CRDK6RD3PGA)
Misexpression of autosomal genes with sex-specific and nonsex-biased expression in standard hybrid females, attached-X (att-X) hybrid females, and hybrid males. The numbers of genes analyzed in each category are shown on top of the panels (chromosomes 2 and 3). FSGs, genes with female-specific expression; MSGs, genes with male-specific expression. Misexpression data based on first generation hybrids from the crosses between D. yakuba females [Taï18E2 or C(1)RM] and D. santomea males [STO.4 or C(1)RM]. Probabilities are based on Mann-Whitney tests, where NS indicates not significant, * P < 0.05, ** P < 0.001, *** P < 1 × 10⁻⁴ (see Figure 3 legend for boxplot explanation).
To investigate the impact that genetic variation linked to sex chromosomes or cytoplasmic factors may have on gene expression patterns of autosomes, we examined differences in expression between interspecific hybrids from reciprocal crosses [e.g., F1 hybrids (T × S) vs. F1 hybrids (S × T) in Figure 1]. Autosomal genes are less differentially expressed between the two reciprocal attached-X hybrid females than between the two reciprocal hybrid males (0.15 vs. 0.20; MWT P = 3.28 × 10−80) but more differentially expressed than between the two reciprocal standard hybrid females (0.15 vs. 0.10; MWT P = 7.7 × 10−166). Remarkably, the median difference in expression between reciprocal hybrid males for autosomal MSGs is increased almost eightfold relative to the median difference observed for FSGs between reciprocal attached-X hybrid females (1.55 vs. 0.20; MWT P = 1.35 × 10−42). Altogether, our results highlight the importance that recessive variation and rapidly evolving factors linked to sex chromosomes or cytoplasm have on autosomal gene expression.
Discussion
Our study provides a comprehensive view of transcriptome evolution in adult females and males of the D. yakuba–D. santomea system, its molecular mechanisms, and its consequences on patterns of gene expression in interspecific hybrids. Our emphasis lies on the effects of the X chromosome. We found that both female and male transcriptomes show some evidence of accelerated gene expression divergence driven by genes with sex-biased expression. Similar trends have been reported in other systems and have been attributed to (1) relaxed selective constraints due to reduced pleiotropic effects associated with increased tissue specificity or low levels of expression, and/or (2) a considerable fraction of positive selection, especially in genes with male-biased expression (Meiklejohn et al. 2003; Parisi et al. 2003; Ranz et al. 2003; Zhang et al. 2004, 2007; Khaitovich et al. 2005; Proschel et al. 2006; Ellegren and Parsch 2007; Haerty et al. 2007; Voolstra et al. 2007; Jiang and Machado 2009; Meisel 2011; Assis et al. 2012; Grath and Parsch 2012, 2016; Parsch and Ellegren 2013; Harrison et al. 2015).
Our results also reveal the dual (or sexually dimorphic) nature of transcriptome evolution and emphasize the importance of studying both sexes. While gene expression divergence for genes with sex-biased expression is consistently high in the sex toward which the expression is biased, in the opposite sex transcript abundance appears to be more conserved (Figure 3). This low divergence, we propose, reflects strong functional constraints on gene expression in tissues and/or pathways shared by both sexes. The higher expression divergence observed in the sex toward which the expression is biased may be the result of additional sex-specific regulatory components evolving by either positive selection or relaxed negative selection. Our expression analysis of the dot chromosome gives support to the latter, at least for genes with female-biased expression. Similar to the proposal that selection on transcript levels for a given gene can vary across developmental stages (Artieri and Singh 2010; Kalinka et al. 2010), our data show that it also varies between sexes for a large fraction of the genome. Our results are also consistent with sexes adopting different expression strategies for their specialized function (Gibilisco et al. 2016). One way to attain this is through sexually dimorphic trans-regulatory environments that often interact with cis-regulatory variation differently in females than in males (Coolon et al. 2013; Meiklejohn et al. 2014).
When we analyzed all the genes expressed in adults as a single class, we found evidence of overall slower-X evolution of gene expression in both female and male transcriptomes (Figure 4). The molecular mechanism underlying this decreased gene expression divergence in X-linked genes involves contributions from both cis- and trans-regulatory variation, as proposed for species of the D. melanogaster subgroup to explain faster-X evolution of gene expression (Coolon et al. 2015). The observations of slower-X evolution can be explained by a significant contribution of weakly deleterious mutations to gene expression divergence, with more effective purifying selection on the X chromosome. This may be because either NeX/NeA > 0.75 (but see below) or because there is a large fraction of recessive deleterious mutations influencing gene expression variation (Vicoso and Charlesworth 2009a; Mank et al. 2010b). Alternatively, our findings of slower-X could be the result of differences in mutation rates between the X chromosome and autosomes. In D. melanogaster, the mutation rate in the male germline is slightly higher than that in the female germline—a difference that can potentially lead to slower-X evolution (Miyata et al. 1987; Bachtrog 2008; Keightley et al. 2009). There is also a third explanation: in very closely related species ancestral polymorphism represents a non-negligible fraction of divergence, and, therefore, slower-X evolution may just reflect the difference in ancestral NeX and NeA, with NeX < NeA. This may indeed be the case in the D. yakuba–D. santomea system, as a genome-wide analysis of putatively neutral sites [bases 8–30 of small introns (<65 bp); Llopart 2018] indicates that the median nucleotide heterozygosity per base pair (Watterson 1975) is significantly smaller on the X chromosome than on autosomes for a D. yakuba population from Nairobi, Kenya, (0.015 vs. 0.019; MWT P = 0.02) (Rogers et al. 2014, 2015). Similarly, a multilocus study of D. yakuba and D. santomea populations from the island of São Tomé reported that the NeX/NeA was close to the theoretical expectation of 0.75 (Llopart et al. 2005). As such, a tendency toward slower-X is expected to be the default observation in many closely related species.
Studies of gene expression divergence in several Drosophila species show that the chances of observing faster-X (or slower-X) evolution in transcriptome data depend on species, sex, developmental stage, and tissue under study (Khaitovich et al. 2005; Brawand et al. 2011; Kayserili et al. 2012; Llopart 2012; Meisel et al. 2012; Meisel and Connallon 2013; Coolon et al. 2015; Dean et al. 2015). We suggest that this variation may be the result of a combination of biological and experimental factors. Among the biological factors, the NeX/NeA has been shown by population genetics models to have a critical impact on whether faster-X evolution is expected (Vicoso and Charlesworth 2009a; Mank et al. 2010b). The number of breeding females and males, differences between the two sexes in the variance in reproductive success (i.e., mating system), demographic events, or differences in recombination rates between the X chromosome and autosomes (Langley et al. 1988; Connallon 2007; Pool and Nielsen 2007; Vicoso and Charlesworth 2009b; Charlesworth 2012; Comeron et al. 2012; Ávila et al. 2015; Comeron 2017) are some of the additional biological factors that can be species specific and also considerably affect NeX/NeA (Vicoso and Charlesworth 2009a). It is also important to recognize that factors associated with experimental design, like the specific stocks used in comparisons of closely related species, the subset of genes under study, or statistical cutoffs may as well play a critical role in our ability to detect faster-X evolution of gene expression.
Of all the genes with sexually dimorphic expression analyzed in this study, X-linked MSGs are the most distinct class. They show transcriptional faster-X and their high gene expression divergence is even greater than that of the rapidly evolving female-biased genes on the dot chromosome. Based on previously reported surveys of neutral polymorphism in several Drosophila species, there is a 3- to 10-fold reduction in effective population size and, therefore, in the scaled-population selection coefficient on the dot chromosome relative to the X and autosomes (Berry et al. 1991; Jensen et al. 2002; Wang et al. 2002, 2004; Betancourt et al. 2009; Arguello et al. 2010)—a result also observed in D. yakuba (Llopart 2018). As a result, we suggest that it is unlikely that the faster-X gene expression evolution of MSGs is due to relaxed selection against deleterious mutations on the X chromosome. The overall finding of slower-X evolution for gene expression divergence in male transcriptomes also militates against this possibility. Instead, we propose that the faster-X observed for these genes in the D. yakuba–D. santomea system is the result of a higher incidence of beneficial regulatory mutations, possibly associated with sexual selection and/or sexual conflict (Parsch and Ellegren 2013).
Our examination of gene expression in attached-X hybrid females shows that autosomal misexpression increases when the two X chromosomes are inherited from the same species (Figure 5 and Figure 6). It is important to emphasize that this is not necessarily an inevitable result because, by carrying two different X chromosomes, standard hybrid females are predicted to suffer twice as many possible hybrid incompatibilities involving the X chromosome as hybrid males (Orr 1993; Turelli and Orr 1995; Orr and Turelli 1996). A potential caveat of our analyses of misexpression in attached-X hybrid females is the presence of the Y chromosome wherein variation has been shown to impact transcriptome profiles (Lemos et al. 2008b; Jiang et al. 2010; Sackton et al. 2011; Yee et al. 2015; Branco et al. 2017; Wang et al. 2018). We argue, however, that we control for the effects of the Y chromosome because the degree of misexpression in attached-X hybrid females was estimated using parental attached-X females who also carry a Y chromosome (see Results). Moreover, we found no evidence that the presence of a Y chromosome in females increases overall gene expression divergence in interspecific comparisons of our parental stocks of D. yakuba and D. santomea (MWT P > 0.05), even though incompatibilities involving the Y chromosome are expected to be expressed in females because they have never been tested by natural selection. As a result, our findings suggest that the Y chromosome does not play a major role in the increased misexpression detected in attached-X hybrid females, although we cannot formally rule out a contribution.
It is also important to point out that none of the misexpression observed in attached-X hybrid females in the D. yakuba–D. santomea system is associated with sterility because these females are fertile. Our results suggest that there is a substantial fraction of recessive mutations that have the potential to generate regulatory incompatibilities involving the X chromosome. They also open the possibility that the hemizygosity of the X chromosome in males may significantly contribute to hybrid misexpression and ultimately lead to male sterility. Our findings align well with previous reports showing that trans-regulatory differences in expression are more likely to deviate from additivity than cis-regulatory variation (Wayne et al. 2004; Hughes et al. 2006; Lemos et al. 2008a; Gruber et al. 2012). Thus, regulatory incompatibilities in hybrid transcriptomes appear to conform to the X:A imbalance hypothesis, or its successor, the dominance theory (Muller 1940, 1942), in the D. yakuba–D. santomea system. The comparison of the two types of interspecific hybrid males also indicates that genetic variation linked to sex chromosomes substantially impacts the expression levels of autosomal genes with a high degree of male-biased expression, in agreement with previous observations (Lu et al. 2010; Llopart 2012). Although we have not formally evaluated regulatory interactions, these findings open the possibility that regulatory incompatibilities between X-linked and autosomal factors may be facilitating the large X-effect.
Both dominance theory and faster-X evolution have been proposed as forces that can explain the disproportionally large contribution of the X chromosome to hybrid dysfunction, particularly hybrid male sterility (i.e., the large X-effect; Coyne and Orr 1989) (Turelli and Orr 1995, 2000; Orr and Turelli 1996; Masly and Presgraves 2007; Presgraves 2008; Moyle et al. 2010). As the rate of evolution of X-linked loci exceeds that of autosomal loci, the large X-effect becomes more likely (Coyne and Orr 1989; Naveira 2003). Similarly, if alleles decreasing fitness in hybrids tend to act recessively (i.e., dominance theory), it is easier to explain the large X-effect, even when the rates of evolution for the X chromosome and autosomes are not different (Turelli and Orr 1995, 2000; Orr and Turelli 1996). While either force alone can generate the large X-effect, in species like D. yakuba and D. santomea, the two forces pull together in the same direction for genes with a high degree of male-biased expression to easily yield the observed large X-effect (Coyne et al. 2004; Moehring et al. 2006). These arguments echo those put forward by Coyne and Orr (2004) to explain the relative contributions of dominance (i.e., recessive X-linked alleles) and faster-male evolution to Haldane’s rule. In the context of gene expression, our results also support the notion that recessive X-linked mutations and faster-X evolution of genes with a high degree of male-biased expression can potentially play a major role in hybrid male misexpression and the large X-effect.
Acknowledgments
We thank Jerry A. Coyne, Daven Presgraves, and two anonymous reviewers for their helpful comments on this manuscript. Our thanks also to Dani Herrig for her contributions during early stages of this study. We are grateful to the Iowa Institute of Human Genetics (University of Iowa), the Roy J. Carver Center for Genomics (University of Iowa), and the Iowa State DNA Facility (Iowa State University) for technical assistance. The computations in this study were run in the High-Performance Computing clusters at the University of Iowa. This work was supported in part by the National Science Foundation (NSF, Division of Environmental Biology) grant DEB1354921 to J.M.C. and A.L., and the National Institutes of Health Predoctoral Training Grant T32 to N.P.
Footnotes
Communicating editor: D. Presgraves
Literature Cited
Author notes
Present address: Department of Ecology and Evolution, Stony Brook University, NY 11794.
