


Abstract
Body mass index (BMI), a proxy measure for obesity, is determined by both environmental (including ethnicity, age, and sex) and genetic factors, with > 400 BMI-associated loci identified to date. However, the impact, interplay, and underlying biological mechanisms among BMI, environment, genetics, and ancestry are not completely understood. To further examine these relationships, we utilized 427,509 calendar year-averaged BMI measurements from 100,418 adults from the single large multiethnic Genetic Epidemiology Research on Adult Health and Aging (GERA) cohort. We observed substantial independent ancestry and nationality differences, including ancestry principal component interactions and nonlinear effects. To increase the list of BMI-associated variants before assessing other differences, we conducted a genome-wide association study (GWAS) in GERA, with replication in the Genetic Investigation of Anthropomorphic Traits (GIANT) consortium combined with the UK Biobank (UKB), followed by GWAS in GERA combined with GIANT, with replication in the UKB. We discovered 30 novel independent BMI loci (P < 5.0 × 10⁻⁸) that replicated. We then assessed the proportion of BMI variance explained by sex in the UKB using previously identified loci compared to previously and newly identified loci and found slight increases: from 3.0 to 3.3% for males and from 2.7 to 3.0% for females. Further, the variance explained by previously and newly identified variants decreased with increasing age in the GERA and UKB cohorts, echoed in the variance explained by the entire genome, which also showed gene–age interaction effects. Finally, we conducted a tissue expression QTL enrichment analysis, which revealed that GWAS BMI-associated variants were enriched in the cerebellum, consistent with prior work in humans and mice.
BODY mass index (BMI) is a proxy measure for obesity, and high BMI (≥ 30 kg/m2) increases the risk of many health problems (Bhaskaran et al. 2014; Ortega et al. 2016; Benjamin et al. 2017). BMI is determined by both genetic and environmental factors, though their individual and combined contributions to risk are not completely understood. Recent BMI heritability estimates are ∼40%, over one-half of which are due to common genetic variation (Hemani et al. 2013; Yang et al. 2015). To date, meta-analyses of genome-wide association studies (GWAS) have identified 426 independent BMI-associated variants (Liu et al. 2008; Thorleifsson et al. 2009; Willer et al. 2009; Speliotes et al. 2010; Kim et al. 2011; Ng et al. 2012, 2017; Okada et al. 2012; Wen et al. 2012, 2014; Yang et al. 2012, 2014; Berndt et al. 2013; Gong et al. 2013; Monda et al. 2013; Scannell Bryan et al. 2014; Hägg et al. 2015; Horikoshi et al. 2015; Locke et al. 2015; Winkler et al. 2015; Ahmad et al. 2016; Bakshi et al. 2016; Minster et al. 2016; Ried et al. 2016; Salinas et al. 2016; Wang et al. 2016; Akiyama et al. 2017; Graff et al. 2017; Justice et al. 2017; Nagy et al. 2017; Tachmazidou et al. 2017; Turcot et al. 2018) and 676 independent variants associated with measures of adiposity phenotypes, including BMI (Scuteri et al. 2007; Chambers et al. 2008; Cotsapas et al. 2009; Heard-Costa et al. 2009; Lindgren et al. 2009; Meyre et al. 2009; Heid et al. 2010; Scherag et al. 2010; Jiao et al. 2011; Kilpeläinen et al. 2011; Kraja et al. 2011; Paternoster et al. 2011; Wang et al. 2011; Bradfield et al. 2012; Comuzzie et al. 2012; Melka et al. 2012; Graff et al. 2013; Liu et al. 2013; Namjou et al. 2013; Wheeler et al. 2013; Pei et al. 2014, 2017; Shungin et al. 2015; Felix et al. 2016; Sung et al. 2016; Wen et al. 2016; Chu et al. 2017; Southam et al. 2017). These variants account for only ∼3% of the variance for this complex trait (Speliotes et al. 2010; Wen et al. 2014; Horikoshi et al. 2015; Locke et al. 2015). The vast majority of these loci were identified in studies of European- or Asian-ancestry (Okada et al. 2012; Wen et al. 2012, 2014; Scannell Bryan et al. 2014; Yang et al. 2014; Akiyama et al. 2017; Graff et al. 2017; Justice et al. 2017; Turcot et al. 2018) populations, as sample sizes have been somewhat smaller in Hispanic/Latino- (Salinas et al. 2016) or African-ancestry populations (Ng et al. 2012, 2017; Gong et al. 2013; Monda et al. 2013; Salinas et al. 2016). Previous work has implicated ancestral differences, with some conflicting results (Hu et al. 2015), but has not yet assessed ancestry variation within nationality subgroups.
Gene–environment interaction may explain an additional portion of the missing heritability. Previous work has discovered several variants that differ between sexes (Locke et al. 2015) and age (Winkler et al. 2015), as well as overall heritability differences in age (Robinson et al. 2017), but found that this was driven only by young (ages 18–40) vs. old (age ≥ 60) in the AHTHEL composite cohort, with no evidence of interaction between ages 46–73 in the UK Biobank (UKB).
To further investigate the relationships among BMI, ancestry, sex, and age, we utilized 427,509 calendar year-averaged BMI measurements from electronic health records (EHRs) of 100,418 members from the Genetic Epidemiology Research in Adult Health and Aging (GERA) cohort. Our goal was to utilize advantages of having a single, large multiethnic cohort to obtain a more comprehensive picture of the genetic landscape of BMI. To this end, we first comprehensively assessed ancestry and nationality effects on BMI in the GERA cohort. Then, to test for ancestry differences in polygenic risk factors and further characterize single-nucleotide polymorphisms (SNPs), including age and sex differences, we first attempted to increase the list of associated variants by searching for additional BMI-associated variants in GERA, and further meta-analyzed the GERA data with the Genetic Investigation of Anthropomorphic Traits (GIANT) consortium for improved discovery. We then used previously reported plus our novel variants to test for age, sex, and ancestry differences, by both testing the individual variants themselves and testing them together in polygenic risk scores, and through gene–age coheritability estimates.
Materials and Methods
All statistical tests were two-sided.
Participants and phenotype
Our primary analysis used data on adult Research Program on Genes, Environment and Health (RPGEH) GERA cohort participants (Banda et al. 2015; Kvale et al. 2015) who were, on average, 62.7 years old (at specimen collection) and members of Kaiser Permanente Northern California (KPNC) for 23 years, and had comprehensive EHRs available for the retrieval of height and weight. Each individual’s height was calculated as the mode (or median if no mode), and outpatient weight measurements from 2005 to 2010 were averaged within each calendar year, excluding outlier weights < 70 or > 500 lb (< 31.7 or > 226.8 kg). Within a calendar year, if the range exceeded 100 lb (45.3 kg) (3759 occurrences), weights ≥ 75 pounds (34.0 kg) from the median were discarded. Across calendar years, if a difference between the average of two consecutive years was > 175 lb (79.4 kg), the one further from the median was excluded. BMI was calculated by definition: weight (kg)/height (m)2. We further excluded BMI measures < 10 or > 100 kg/m2, where age < 18 year, 6 months prior to/after childbirth, or after bariatric surgery. In total, 427,509 calendar-year BMI measurements were available for 100,418 individuals. To define nationality/geography within ethnicity groups, participants endorsed all applicable from 23 groups (Banda et al. 2015). The KPNC Institutional Review Board and the University of California San Francisco Human Research Protection Program Committee on Human Health approved this project. Written informed consent was obtained from all subjects.
Genotyping, quality control, and imputation
Individuals were genotyped at over 650,000 SNPs on four custom Affymetrix arrays optimized for individuals of European, Latino, East Asian, and African American ancestry (Hoffmann et al. 2011a,b), and South Asians were genotyped on the European array. Genotype quality control procedures were performed array-wise, as described previously by Kvale et al. (2015), plus removal of SNPs with call rates < 90%. Individuals were prephased with Shape-it v2.r727 (Delaneau et al. 2011) and imputed from the 1000 Genomes Project (http://1000genomes.org) cosmopolitan reference panel with Impute2 v2.3.0 (Howie et al. 2009, 2011, 2012). After excluding variants with rinfo2 < 0.3 (Marchini and Howie 2010) and minor allele count < 20, we retained 24,149,855, 20,828,585, 15,248,462, 21,485,958, and 8,607,429 SNPs in non-Hispanic whites, Latinos, East Asians, African Americans, and South Asians (28,613,428 unique SNPs), respectively.
Phenotype–ancestry distributions
To visualize the distribution of BMI by the ancestry principal components (PCs; PCs calculated from only the highest-performing call rate > 99.5% SNPs) (Banda et al. 2015), we created a smoothed distribution of each individual i’s age and sex-adjusted first BMIi measurement using a radial kernel density estimate weighted on the distance to each other jth individual, ∑jφ({d(i,j)/maxi*,j*[d(i*,j*)]*15)}), where φ(.) is the standard normal density distribution and d(i,j) is the Euclidean distance of the first two PCs. Ethnicity and/or nationality subgroup labels were derived from the GERA cohort (described above) or the Human Genome Diversity Project (Banda et al. 2015).
GERA GWAS analysis and covariate adjustment
We first analyzed each of the five ethnicity groups (non-Hispanic whites, Latinos, East Asians, African Americans, and South Asians) separately, modeling each SNP using additive dosages (Zheng et al. 2011). For computational reasons, first a mixed model on BMI was fitted, adjusting for age (at corresponding BMI measurement), sex, and ancestry covariates. We then inverse normally transformed the residuals, as has been done in large meta-analyses (Locke et al. 2015), to be comparable. We then averaged these transformed residuals for each individual, and ran a linear regression on each SNP in a mixed model framework using estimated kinship matrices with Bolt-LMM v2.1 (Loh et al. 2015). We then undertook a fixed-effects meta-analysis to combine the five ethnicity groups with Metasoft v2.0 (Han and Eskin 2011).
We considered loci novel if ≥ 0.5 Mb was not present in any previously or newly described loci [with larger distances in regions of strong linkage disequilibrium (LD); specifically, we determined this both via visual inspection of plots of each locus and correlation structure, and conditional analysis with surrounding variants to confirm (Han and Eskin 2011)].
Then, to find additional independent genome-wide significant SNPs at each previously and newly described locus, we ran a stepwise regression analysis using all SNPs with rinfo2 > 0.8 within a 1-Mb window (± 0.5 Mb, or an expanded window size for regions with longer-LD stretches as just described) of the lead SNP. In this analysis, we adjusted only for ancestry PCs [top 10 for non-Hispanic whites, top six for other groups (Banda et al. 2015)] instead of the mixed model approach for simplicity and computational efficiency.
We estimated the amount that the genomic inflation factor was due to causes other than polygenicity via LD score regression with LDSC v1.0.0 (Bulik-Sullivan et al. 2015). We used LD score estimates from the 1000 Genomes Project European data supplied by the authors; as such, we report the ratio in GERA European-ancestry individuals and in the meta-analysis of all of GERA data (which may slightly inflate the estimate of the ratio since GERA is only 81% European ancestry).
SNPs previously identified
To determine if our loci were novel, we identified 528 nonindependent SNPs from previously reported studies to date for adult BMI (Liu et al. 2008; Thorleifsson et al. 2009; Willer et al. 2009; Speliotes et al. 2010; Kim et al. 2011; Ng et al. 2012, 2017; Okada et al. 2012; Wen et al. 2012, 2014; Yang et al. 2012, 2014; Berndt et al. 2013; Gong et al. 2013; Monda et al. 2013; Scannell Bryan et al. 2014; Hägg et al. 2015; Horikoshi et al. 2015; Locke et al. 2015; Winkler et al. 2015; Ahmad et al. 2016; Bakshi et al. 2016; Minster et al. 2016; Ried et al. 2016; Salinas et al. 2016; Wang et al. 2016; Akiyama et al. 2017; Graff et al. 2017; Justice et al. 2017; Nagy et al. 2017; Turcot et al. 2018) (426 variants with all pairwise r2 < 0.3 in European ancestry) and, separately, 1304 nonindependent SNPs more broadly associated with adiposity-related phenotypes (Scuteri et al. 2007; Chambers et al. 2008; Cotsapas et al. 2009; Heard-Costa et al. 2009; Lindgren et al. 2009; Meyre et al. 2009; Heid et al. 2010; Scherag et al. 2010; Jiao et al. 2011; Kilpeläinen et al. 2011; Kraja et al. 2011; Paternoster et al. 2011; Wang et al. 2011; Bradfield et al. 2012; Comuzzie et al. 2012; Melka et al. 2012; Graff et al. 2013; Liu et al. 2013; Namjou et al. 2013; Wheeler et al. 2013; Pei et al. 2014, 2017; Shungin et al. 2015; Felix et al. 2016; Sung et al. 2016; Wen et al. 2016; Chu et al. 2017; Justice et al. 2017; Southam et al. 2017) (including the adult BMI, as well as childhood BMI, obesity, adiposity, weight, waist–hip ratio, waist circumference, fat body mass; 676 variants with all pairwise r2 < 0.3 in European ancestry). We required our novel loci to be > 0.5 Mb from all of the more general previously reported adiposity-related phenotypes (or of greater distance in regions of strong LD, as described above).
Replication of GERA- and GERA+GIANT-identified SNPs
To determine if any novel GERA genome-wide significant results failed to replicate, we evaluated their association in a meta-analysis of the GIANT and UKB data.
We used 234,069 European-ancestry individuals from the GIANT consortium (Locke et al. 2015). We restricted to European ancestry so we could extend GIANT results from the smaller HapMap v22 reference panel to the 1000 Genomes Project reference panel used here for GERA, using ImpG v1.01 (Pasaniuc et al. 2014). After removing SNPs with ≤ 200,000 individuals (Pasaniuc et al. 2014), 2,300,072 autosomal SNPs remained for the imputation backbone. We imputed 21,691,898 SNPs with frequency ≥ 0.01 (the approach performs poorly for low-frequency variants). In particular, note that using ImpG assumes all HapMap SNPs were imputed without error; likely dampening the results. Effect sizes were estimated using allele frequency and Hardy–Weinberg assumptions (Hoffmann et al. 2017).
The multiethnic UKB cohort (Sudlow et al. 2015) was imputed to the Haplotype Reference Consortium (HRC; www.ukbiobank.ac.uk, version 1 of the imputed data, HRC-only sites); non-HRC imputation was done by prephasing with Eagle (Loh et al. 2016) and imputing with Minimac3 (Das et al. 2016) with the 1000 Genomes Project described above. BMI was calculated from measured weight and height (UKB data record #21001). After excluding first-degree relatives, we identified 431,743 individuals who reported their ancestry as any white group and with global ancestry PC1 ≤ 70 and PC2 ≥ −80, where PC1 and PC2 were calculated from the entire cohort, in addition to 7620 mixed/other, 9275 South Asian, 1822 East Asian, and 8261 African British, totaling 458,721 individuals. Ancestry PCs were recalculated within each ethnicity group, and using 50,000 random white individuals with the remaining subjects projected in for whites, as previously shown to work well (Banda et al. 2015). Variants were analyzed as in GERA, except using linear regression (as opposed to a mixed model), since we were only testing for replication on a few dozen variants.
GERA+GIANT meta-analysis and replication
To further our discovery, we meta-analyzed GERA with the 235,069 GIANT cohort individuals as described above, genome-wide. To determine if the genome-wide significant GERA+GIANT meta-analysis SNPs replicated, we tested in the UKB.
Characterizing SNP effects
To better characterize the effects of previously and newly identified SNPs, we ran a series of analyses, as follows.
Testing for dominance and epistasis:
We tested for dominance deviation from additivity in the previously and newly identified independent SNPs by fitting a model similar to above, with an additive term for the genotype, plus an additional term for dominance (tested for significance), coded as 1 for both of the homozygote genotypes and −2 for the heterozygote genotype (here we used the best guess genotype for the imputed data, rather than the dosages, as elsewhere; Bonferroni correction for 457 SNPs, P < 0.00011).
We tested for epistasis at all pairwise sets of previously and newly identified independent SNPs. For each SNP pair, we fitted a model similar to above, with a coefficient for both genotypes (each coded additively), plus an interaction term of the two (tested for significance; Bonferroni correction for all 104,196 interactions of 353 SNPs, P < 4.7 × 10⁻⁷).
Effects of sex and age on BMI-associated loci:
Within GERA, we analyzed for male and female heterogeneity at all SNPs. We also analyzed BMI associations stratified by younger/older individuals using the first BMI measurement [age ≤ 50 year (n = 20,848) or age > 50 (n = 79,111)], as in Winkler et al. (2015), and then tested for heterogeneity.
In silico analyses
We conducted several in silico analyses to prioritize the potentially causal variant at each of the 30 newly identified BMI loci.
Credible sets of variants:
We used the Bayesian approach CAVIARBF (v2017-03-27) to derive the smallest set of variants that includes the causal variant with 95% probability (Chen et al. 2015).
Functional variant analysis using RegulomeDB:
We used RegulomeDB (Xie et al. 2013; Boyle et al. 2014) to identify variants at each loci that likely influence regulation of gene expression, incorporating data from the Roadmap Epigenomics (Roadmap Epigenomics Consortium et al. 2015) and ENCODE (ENCODE Project Consortium 2012) projects. SNPs showing the most functional evidence (RegulomeDB score ≤ 4) were then investigated regarding their protein-binding capacity.
Expression QTL analysis:
Lastly, we examined associations with gene expression using expression QTLs (eQTLs) from 44 Genotype-Tissue Expression (GTEx) v6 tissues, including subcutaneous and visceral adipose tissues (GTEx Consortium 2015). Cis-eQTLs were defined as variants associated with gene expression within a 2-Mb window. If no eQTLs were found, variants in high LD (r2 > 0.8) with the independent SNPs were examined for expression association.
Genetic risk score
To test for aggregate group differences in the genetic burden of variants currently known and for variance-explained calculations described later, we additionally constructed a BMI risk score for sets of independent SNPs at previously and newly described associated loci. For each GERA and UKB individual, we summed up the additive coding of each SNP weighted by effect sizes from the UKB meta-analysis (for GERA) and the GERA meta-analysis (for UKB), so the estimate is independent from the cohort being used to test, respectively, stratified by sex. We removed previously reported nonindependent BMI variants such that no two pairwise SNPs had r2 > 0.3.
Heritability
To test for the aggregate genetic BMI burden, we first estimated familial correlations and heritability by intraclass correlations for spouse-pairs and sib-pairs, and Pearson correlations for parent-offspring relationships.
We additionally estimated the additive array heritability of all genotyped and imputed SNPs using Gear v0.7.7 (Chen 2014). As array heritability estimates can be more sensitive to artifacts than GWAS results (Lee et al. 2011), we restricted our analysis here to the largest set of non-Hispanic whites run on the same reagent kit and microarray. We used only autosomal data (common in array heritability estimation) and LD-filtered our data so no two pairwise SNPs had r2 > 0.8 using plink v1.90 (Chang et al. 2015), resulting in 547,922 genotyped and 3,796,606 imputed SNPs. Since there was population stratification within the non-Hispanic whites, we used PC-Relate (Conomos et al. 2016) to estimate the kinship coefficients rather than GCTA estimates (Yang et al. 2011a), which assume a homogeneous population. We also compared the results to this standard GCTA estimate, adjusting for PCs as described above. We additionally used Gear instead of GCTA for the PC-Relate-based heritability estimate, as the PC-Relate kinship matrix estimate was not positive definite (this can happen as the kinship estimates are based on different allele frequencies, i.e., those from the PC analysis that depend on ancestry). Finally, we removed individuals so that no two individuals had kinship > 0.025, using a greedy algorithm to maximize sample size (Chang et al. 2015), resulting in 62,791 individuals.
We also estimated genotype–age heritability interaction effects using the genotype covariate interaction genome-based restricted maximum likelihood (GCI-GREML) model implemented in GCTA, as previously described for BMI (Robinson et al. 2017).
Tissue eQTL enrichment
We also used the 44 GTEx tissues to test for tissue enrichment of all lead previously and newly identified variants. Similar to previous work (Hoffmann et al. 2018), we constructed 106 sets of frequency-matched (± 0.5%) SNPs with respect to the lead SNP. For each tissue, we calculated the proportion of eQTL SNPS that were lead genome-wide significant SNPs (to avoid bias due to varying numbers of eQTLs in each tissue, owing to different sample sizes of each tissue). A P-value for enrichment was calculated with a z-score using the overall median tissue proportion and the SD of the null distribution of that tissue.
Data availability
Summary statistics will be made publicly available from the National Human Genome Research Institute-European Bioinformatics Institute (NHGRI-EBI) GWAS Catalog, https://www.ebi.ac.uk/gwas/downloads/summary-statistics. The complete GERA data are available upon application to the Kaiser Permanente Research Bank Portal, http://researchbank.kaiserpermanente.org/our-research/for-researchers. The UKB data are available upon application to the UKB, www.ukbiobank.ac.uk. The GIANT summary statistics are available online, http://portals.broadinstitute.org/collaboration/giant/index.php/GIANT_consortium_data_files. Grand Opportunity (GO) Project Institutional Review Board (IRB): CN-09CScha-06-H. Supplemental material available at Figshare: https://doi.org/10.25386/genetics.6957152.
Results
Our main study sample included 100,418 GERA individuals who had at least one recorded BMI measurement during the years of available EHR data. Of those, 81,278 (81.0%) were non-Hispanic white, 8322 (8.3%) Latino, 7290 (7.3%) East Asian, 3069 (3.1%) African American, and 459 (0.5%) South Asian. BMI varied by ethnicity group, with African Americans averaging the highest BMI [although this group also has greater bone mineral density and body protein content, so this is not necessarily an indication of greater adiposity (Wagner and Heyward 2000)], and East Asians and South Asians averaging the lowest (Table 1). Men generally had higher BMI than women, except in African Americans, consistent with previous findings (Robert and Reither 2004; Flegal et al. 2012).
Descriptive factors
| Factors | Non-Hispanic white | Latino | East Asian | African American | South Asian |
|---|---|---|---|---|---|
| N (%) | 81,278 (80.9%) | 8322 (8.3%) | 7290 (7.3%) | 3069 (3.1%) | 459 (0.5%) |
| Female, N (%) | 47,335 (58.2%) | 5045 (60.6%) | 4264 (58.5%) | 1834 (59.8%) | 189 (41.2%) |
| Average number measured (SD) | 4.3 (1.3) | 4.2 (1.4) | 4.0 (1.4) | 4.3 (1.3) | 4.0 (1.4) |
| Age (years) | |||||
| Male mean (SD) | 63.9 (12.1) | 59.1 (13.7) | 59.2 (13.5) | 61.6 (11.7) | 55.3 (13.8) |
| Female mean (SD) | 60.3 (13.6) | 52.9 (14.9) | 53.4 (14.7) | 56.5 (14.2) | 48.0 (13.9) |
| BMI (kg/m2) | |||||
| Male mean (SD) | 28.0 (4.6) | 29.1 (4.9) | 26.1 (4.0) | 29.3 (5.2) | 25.8 (3.7) |
| Female mean (SD) | 27.3 (6.0) | 28.6 (6.3) | 24.5 (4.5) | 30.8 (6.9) | 25.2 (4.2) |
Descriptive factors for the GERA subjects used in the genome-wide association study of BMI by ethnicity group at first BMI measurement (for age and BMI). Abbreviations: N, number; BMI, body mass index.
| Factors | Non-Hispanic white | Latino | East Asian | African American | South Asian |
|---|---|---|---|---|---|
| N (%) | 81,278 (80.9%) | 8322 (8.3%) | 7290 (7.3%) | 3069 (3.1%) | 459 (0.5%) |
| Female, N (%) | 47,335 (58.2%) | 5045 (60.6%) | 4264 (58.5%) | 1834 (59.8%) | 189 (41.2%) |
| Average number measured (SD) | 4.3 (1.3) | 4.2 (1.4) | 4.0 (1.4) | 4.3 (1.3) | 4.0 (1.4) |
| Age (years) | |||||
| Male mean (SD) | 63.9 (12.1) | 59.1 (13.7) | 59.2 (13.5) | 61.6 (11.7) | 55.3 (13.8) |
| Female mean (SD) | 60.3 (13.6) | 52.9 (14.9) | 53.4 (14.7) | 56.5 (14.2) | 48.0 (13.9) |
| BMI (kg/m2) | |||||
| Male mean (SD) | 28.0 (4.6) | 29.1 (4.9) | 26.1 (4.0) | 29.3 (5.2) | 25.8 (3.7) |
| Female mean (SD) | 27.3 (6.0) | 28.6 (6.3) | 24.5 (4.5) | 30.8 (6.9) | 25.2 (4.2) |
Descriptive factors for the GERA subjects used in the genome-wide association study of BMI by ethnicity group at first BMI measurement (for age and BMI). Abbreviations: N, number; BMI, body mass index.
Variation in BMI by ethnicity and ancestry/nationality
We next examined how BMI varied within each ethnicity group. The first two ancestry PCs (Banda et al. 2015), calculated within each group separately, generally represent geographic origin. In non-Hispanic whites, we initially found PC1 (P = 10−72) and PC2 (P = 10−45) associated with BMI, representing Northwest to Southeast European ancestry and Northwestern to Southeastern Europe, respectively. To better visualize this association of BMI with ancestry groups, we smoothed the phenotype distribution over the PCs (each ethnicity group and nationality subgroup in Figure 1, similar pattern seen in age- and sex-adjusted residuals in Supplemental Material, Figure S1). Refitting non-Hispanic whites with Ashkenazi’s removed, and then projected, along with a term for Ashkenazi ancestry (Banda et al. 2015), we found an interaction effect between the first two PCs (P = 0.00031; Table S1), representing Northern vs. Southeastern (P = 7.7 × 10⁻¹¹) and Northern vs. Southwestern (P = 4.5 × 10⁻¹¹), and Ashkenazi ancestry was also associated with lower BMI (P = 10−49; mean values by group in Table S2). In Latinos, Native American ancestry was associated with higher BMI compared to European ancestry (P = 1.4 × 10⁻⁶), but African ancestry was not associated (P = 0.98); in addition, Central South American nationality was associated with lower BMI (P = 7.0 × 10⁻⁸). In East Asians, there was also an interaction effect between the first two PCs (P = 0.00038), representing the amount of European ancestry (P = 10−67) and Northern vs. Southern East Asian ancestry, including dramatic nonlinear effects with linear (P = 5.2 × 10⁻¹¹) and quadratic (P = 10−35) terms. In African Americans, African ancestry was associated with higher BMI compared to European ancestry (P = 2.7 × 10⁻⁹), but PC2, representing East Asian ancestry, was not associated (P = 0.34), although there were not many individuals with significant East Asian ancestry. In South Asians, PC1 was associated (P = 0.0067) but was difficult to geographically interpret.
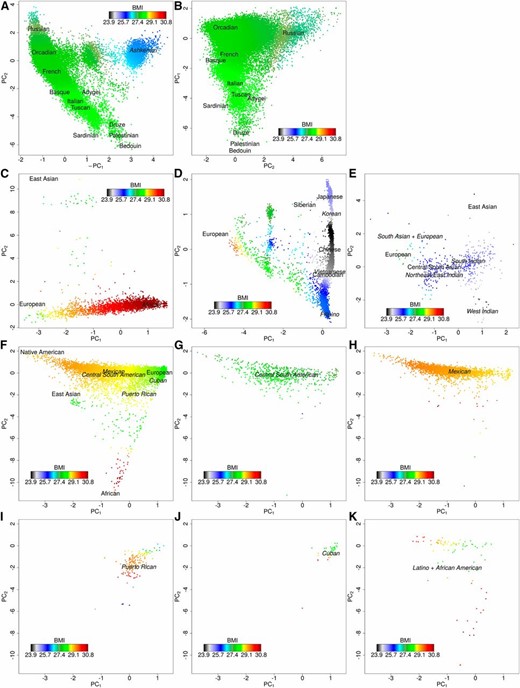
BMI distribution in GERA ethnicity groups using the first calendar year-averaged measurement. The phenotype distribution was smoothed over the PCs (within the individuals in each respective figure), which were divided by their SD for interpretability (see Materials and Methods). Human Genome Diversity Project populations are in a plain font and GERA populations are in an italic font. (A) Non-Hispanic whites including individuals with Ashkenazi ancestry (n = 81,377); (B) Non-Hispanic whites excluding individuals with Ashkenazi ancestry (n = 76,088); (C) African Americans (n = 3069); (D) East Asians excluding Indo Fijians (n = 7235); (E) South Asians (n = 459); (F) Latinos (n = 8322); (G) Latinos: Central and South American (n = 612); (H) Latinos: Mexican (n = 3048); (I) Latinos: Puerto Rican (n = 148); (J) Latinos: Cuban (n = 40); and (K) Latinos: reporting as Latino and African American (n = 112). BMI: body mass index; GERA, Genetic Epidemiology Research on Adult Health and Aging cohort; PC, principle component.
GWAS of BMI in GERA, and replication in GIANT and UKB combined
Before characterizing individual and aggregate SNP effects with age, sex, and ancestry, we next sought to find additional BMI-associated variants. For our discovery GWAS meta-analysis across GERA ethnicity groups, our genomic inflation factor was 1.11, which is reasonable for a polygenic trait with a sample size this large (Yang et al. 2011b) (Figures S2 and S3); indeed, LD-score regression (Bulik-Sullivan et al. 2015) estimates that for the non-Hispanic whites, all but 0.22% was due to polygenicity (using European ancestry LD scores), and for all of GERA all but 3.6% (using European ancestry LD scores; since this reflects only 81% of our data, this may inflate the overall GERA estimate somewhat). Of note, in the individual ethnicity group analyses, we identified genome-wide significant loci in only the non-Hispanic white group (the majority of the cohort). In the multiethnic meta-analysis, we identified a total of 48 genome-wide significant loci, seven of which (Table S3) were not previously reported for BMI or any other adiposity-related phenotype (Table S4). We then tested these seven lead SNPs in a combined meta-analysis of 234,069 European-ancestry individuals from the GIANT consortium (Locke et al. 2015) (HapMap summary statistics extended to the 1000 Genomes Project, Figures S4 and S5 comparing the groups) and 458,721 UKB individuals from five ethnicity groups (European, East Asian, South Asian, African British, and mixed ancestries). Three of the seven variants replicated at Bonferroni significance (P ≤ 0.05/7 = 0.0071, same direction of effect) in the GWAS meta-analysis of GIANT and UKB, and are reported in Table 2. Of note, two of the SNPs that failed to replicate imputed poorly (r2info < 0.8), while all other genome-wide significant variants imputed well (r2info ≥ 0.8).
Novel loci associated with BMI (P ≤ 5 × 10⁻⁸) in the GERA multiethnic meta-analysis that replicate in GIANT+UKB
| GERA | GIANT+UKB | |||||||||
|---|---|---|---|---|---|---|---|---|---|---|
| SNPa | Chr. | Bp | Locus | Allele | Freq. | Info. | β | P | β | P |
| rs200870675i | 3 | 77,646,862 | ROBO2 | TG/T | 0.398 | 0.97 | 0.026 | 4.7 × 10⁻⁹ | 0.012 | 3.6 × 10⁻¹⁰ |
| rs513357i | 6 | 69,558,698 | ADGRB3 | A/G | 0.124 | 0.99 | 0.036 | 4.4 × 10⁻⁸ | 0.011 | 9.8 × 10⁻⁵ |
| rs7938308i | 11 | 13,320,533 | ARNTL | C/T | 0.712 | 0.97 | 0.027 | 2.7 × 10⁻⁸ | 0.012 | 1.0 × 10⁻⁹ |
Genomic contexts within genes, or surrounding genes, are given. Replication test is given by the GIANT+UKB meta-analysis. GERA P-values are based on the multiethnic meta-analysis of GWAS (81,278 non-Hispanic whites, 8322 Hispanic/Latinos, 7290 East Asians, 3069 African Americans, and 459 South Asians) from the GERA sex-combined data set; GIANT+UKB P-values are based on the multiethnic meta-analysis of the European ancestry GIANT cohort members and the UKB (GIANT: 234,069 non-Hispanic whites; UKB: 431,743 non-Hispanic whites, 7620 mixed/other, 9275 South Asians, 1822 East Asians, and 8261 African British). GERA, Genetic Epidemiology Research on Adult Health and Aging cohort; GIANT, Genetic Investigation of Anthropomorphic Traits consortium; UKB, UK Biobank; Chr., chromosome; Bp, base pair (based on University of California Santa Cruz Genome Browser Assembly February 2009: GRCh37/hg19); Freq., frequency; Info., information; β, β coefficient.
Genomic context: i, intron; no label is intergenic.
| GERA | GIANT+UKB | |||||||||
|---|---|---|---|---|---|---|---|---|---|---|
| SNPa | Chr. | Bp | Locus | Allele | Freq. | Info. | β | P | β | P |
| rs200870675i | 3 | 77,646,862 | ROBO2 | TG/T | 0.398 | 0.97 | 0.026 | 4.7 × 10⁻⁹ | 0.012 | 3.6 × 10⁻¹⁰ |
| rs513357i | 6 | 69,558,698 | ADGRB3 | A/G | 0.124 | 0.99 | 0.036 | 4.4 × 10⁻⁸ | 0.011 | 9.8 × 10⁻⁵ |
| rs7938308i | 11 | 13,320,533 | ARNTL | C/T | 0.712 | 0.97 | 0.027 | 2.7 × 10⁻⁸ | 0.012 | 1.0 × 10⁻⁹ |
Genomic contexts within genes, or surrounding genes, are given. Replication test is given by the GIANT+UKB meta-analysis. GERA P-values are based on the multiethnic meta-analysis of GWAS (81,278 non-Hispanic whites, 8322 Hispanic/Latinos, 7290 East Asians, 3069 African Americans, and 459 South Asians) from the GERA sex-combined data set; GIANT+UKB P-values are based on the multiethnic meta-analysis of the European ancestry GIANT cohort members and the UKB (GIANT: 234,069 non-Hispanic whites; UKB: 431,743 non-Hispanic whites, 7620 mixed/other, 9275 South Asians, 1822 East Asians, and 8261 African British). GERA, Genetic Epidemiology Research on Adult Health and Aging cohort; GIANT, Genetic Investigation of Anthropomorphic Traits consortium; UKB, UK Biobank; Chr., chromosome; Bp, base pair (based on University of California Santa Cruz Genome Browser Assembly February 2009: GRCh37/hg19); Freq., frequency; Info., information; β, β coefficient.
Genomic context: i, intron; no label is intergenic.
Meta-analysis of GERA and GIANT, and replication in UKB
For increased discovery, we then meta-analyzed GERA results with GIANT (replication of GERA-identified variants included these individuals plus others, as described above) (Figure 2). Our genomic inflation factor was 1.071, which is slightly lower than the analysis of GERA alone, likely due to the conservative nature of extending summary statistics (Pasaniuc et al. 2014). This analysis revealed an additional 31 genome-wide significant loci not previously reported (Table S5). We then tested these for replication in the UKB. Of the 31 variants, 27 replicated at a Bonferroni level (P ≤ 0.05/31 = 0.0016; Table 3).
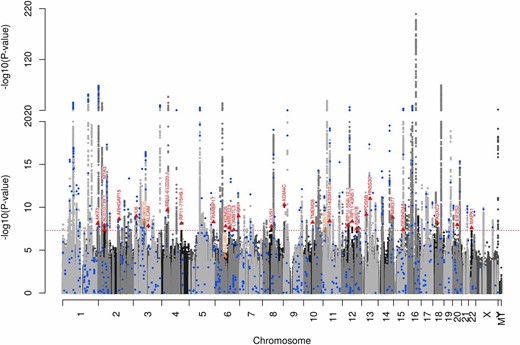
GERA+GIANT multiethnic meta-analysis Manhattan plot. Blue circles indicate previously identified variants, orange triangles indicate GERA-identified variants, and red triangles indicate GERA+GIANT-identified variants. GERA, Genetic Epidemiology Research on Adult Health and Aging cohort; GIANT, Genetic Investigation of Anthropomorphic Traits consortium.
Novel loci associated with BMI (P < 5 × 10⁻⁸) in the GERA+GIANT multiethnic meta-analysis that replicate in UKB
| GERA | GERA+GIANT | UKB | ||||||||
|---|---|---|---|---|---|---|---|---|---|---|
| SNP | Chr. | BP | Locusa | Allele | Freq | Info | β | P | β | P |
| rs1074657 | 1 | 243,746,634 | AKT3i | T/C | 0.346 | 0.96 | 0.017 | 7.7 × 10⁻⁹ | 0.012 | 1.9 × 10⁻⁷ |
| rs1396141 | 2 | 41,673,745 | AC010739.1 | T/C | 0.669 | 0.98 | 0.017 | 1.2 × 10⁻⁸ | 0.010 | 2.1 × 10⁻⁶ |
| rs7580766 | 2 | 42,939,351 | MTA3 | G/A | 0.578 | 1.00 | 0.015 | 4.3 × 10⁻⁸ | 0.008 | 0.00029 |
| rs6710871 | 2 | 143,960,593 | ARHGAP15i | A/G | 0.146 | 1.00 | 0.023 | 2.2 × 10⁻⁹ | 0.020 | 1.9 × 10⁻¹¹ |
| rs4857968 | 3 | 20,714,580 | U6 | G/A | 0.749 | 1.00 | 0.018 | 1.1 × 10⁻⁹ | 0.014 | 1.1 × 10⁻⁸ |
| rs1436351 | 3 | 104,617,973 | ALCAM | T/G | 0.736 | 1.00 | 0.016 | 1.4 × 10⁻⁸ | 0.015 | 2.5 × 10⁻¹⁰ |
| rs4833079 | 4 | 38,654,681 | RP11-617D20.1i | T/C | 0.654 | 0.98 | 0.016 | 2.1 × 10⁻¹⁰ | 0.011 | 2.1 × 10⁻⁷ |
| rs10019997 | 4 | 137,048,599 | RP11-775H9.1 | T/C | 0.451 | 1.00 | 0.015 | 7.5 × 10⁻⁹ | 0.016 | 1.5 × 10⁻¹³ |
| rs7730898 | 5 | 170,459,675 | RANBP17i | A/G | 0.739 | 0.98 | 0.016 | 5.1 × 10⁻⁹ | 0.018 | 2.2 × 10⁻¹⁴ |
| rs947612 | 6 | 73,738,661 | KCNQ5i | G/A | 0.315 | 0.98 | 0.018 | 1.6 × 10⁻⁸ | 0.012 | 7.1 × 10⁻⁷ |
| rs901630 | 6 | 98,539,519 | MIR2113 | C/T | 0.617 | 1.00 | 0.014 | 2.5 × 10⁻⁸ | 0.019 | 2.5 × 10⁻¹⁹ |
| rs6569648 | 6 | 130,349,119 | L3MBTL3i | C/T | 0.205 | 1.00 | 0.016 | 4.3 × 10⁻⁸ | 0.011 | 8.7 × 10⁻⁶ |
| rs9364687 | 6 | 163,817,911 | QKI | G/T | 0.576 | 0.99 | 0.016 | 1.0 × 10⁻⁹ | 0.007 | 0.0015 |
| rs6471932 | 8 | 62,078,904 | CLVS1 | T/A | 0.108 | 0.95 | 0.024 | 1.6 × 10⁻⁸ | 0.017 | 6.5 × 10⁻⁸ |
| rs12352785 | 9 | 6,956,850 | KDM4Ci | A/C | 0.282 | 0.99 | 0.018 | 5 × 10⁻¹¹ | 0.009 | 9.4 × 10⁻⁵ |
| rs118067556 | 10 | 63,136,165 | TMEM26 | C/T | 0.966 | 0.89 | 0.044 | 5.6 × 10⁻⁹ | 0.030 | 1.8 × 10⁻⁶ |
| rs10742752 | 11 | 45,438,374 | RP11-430H10.4 | C/T | 0.628 | 0.99 | 0.015 | 3.9 × 10⁻⁹ | 0.012 | 1.8 × 10⁻⁸ |
| rs11170468 | 12 | 39,430,048 | RP11-554L12.1 | A/C | 0.787 | 0.99 | 0.017 | 1.2 × 10⁻⁸ | 0.011 | 4.6 × 10⁻⁶ |
| rs1819844 | 12 | 68,205,604 | RP11-43N5.1 | A/G | 0.181 | 0.99 | 0.019 | 4.4 × 10⁻⁹ | 0.014 | 4.1 × 10⁻⁷ |
| rs2372716 | 12 | 99,573,426 | ANKS1Bi | C/T | 0.198 | 0.99 | 0.017 | 3.1 × 10⁻⁸ | 0.015 | 1.4 × 10⁻⁸ |
| rs9595908 | 13 | 33,184,288 | PDS5Bi | T/C | 0.650 | 0.98 | 0.016 | 6.5 × 10⁻¹⁰ | 0.017 | 1.1 × 10⁻¹⁴ |
| rs9563576 | 13 | 58,670,147 | RN5S30 | C/T | 0.816 | 1.00 | 0.022 | 9.7 × 10⁻¹² | 0.024 | 7.1 × 10⁻¹⁸ |
| rs7161194 | 14 | 101,529,005 | MIR377 | A/G | 0.341 | 0.90 | 0.019 | 1.5 × 10⁻⁹ | 0.018 | 1.3 × 10⁻¹⁴ |
| rs12899850 | 15 | 66,051,299 | DENND4Ai | C/T | 0.788 | 1.00 | 0.020 | 4.0 × 10⁻⁸ | 0.011 | 0.00012 |
| rs11081818 | 18 | 31,251,088 | ASXL3i | A/G | 0.468 | 0.99 | 0.016 | 6.4 × 10⁻⁹ | 0.012 | 1.5 × 10⁻⁸ |
| rs6142096 | 20 | 32,686,658 | EIF2S2i | A/G | 0.523 | 1.00 | 0.016 | 1.1 × 10⁻⁸ | 0.013 | 2.3 × 10⁻⁹ |
| rs17759796 | 22 | 22,190,163 | MAPK1i | A/C | 0.133 | 1.00 | 0.020 | 2.5 × 10⁻⁸ | 0.010 | 0.00067 |
Genomic context within gene, or surrounding genes, are given. Replication test is given by the UKB meta-analysis. GERA+GIANT P-values are based on the multiethnic meta-analysis of GWAS (GERA: 81,278 non-Hispanic whites, 8322 Hispanic/Latinos, 7290 East Asians, 3069 African Americans, and 459 South Asians; GIANT: 234,069 non-Hispanic whites) from the GERA sex-combined data set; GIANT+UKB P-values are based on the multiethnic meta-analysis of the European ancestry GIANT cohort members and the UKB (431,743 non-Hispanic whites, 7620 mixed/other, 9275 South Asians, 1822 East Asians, and 8261 African British). GERA, Genetic Epidemiology Research on Adult Health and Aging cohort; GIANT, Genetic Investigation of Anthropomorphic Traits consortium; UKB, UK Biobank; Chr., chromosome; Bp, base pair (based on University of California Santa Cruz Genome Browser Assembly February 2009: GRCh37/hg19); Freq., frequency; Info., information; β, β coefficient.
Genomic context: i, intron; no label is intergenic.
| GERA | GERA+GIANT | UKB | ||||||||
|---|---|---|---|---|---|---|---|---|---|---|
| SNP | Chr. | BP | Locusa | Allele | Freq | Info | β | P | β | P |
| rs1074657 | 1 | 243,746,634 | AKT3i | T/C | 0.346 | 0.96 | 0.017 | 7.7 × 10⁻⁹ | 0.012 | 1.9 × 10⁻⁷ |
| rs1396141 | 2 | 41,673,745 | AC010739.1 | T/C | 0.669 | 0.98 | 0.017 | 1.2 × 10⁻⁸ | 0.010 | 2.1 × 10⁻⁶ |
| rs7580766 | 2 | 42,939,351 | MTA3 | G/A | 0.578 | 1.00 | 0.015 | 4.3 × 10⁻⁸ | 0.008 | 0.00029 |
| rs6710871 | 2 | 143,960,593 | ARHGAP15i | A/G | 0.146 | 1.00 | 0.023 | 2.2 × 10⁻⁹ | 0.020 | 1.9 × 10⁻¹¹ |
| rs4857968 | 3 | 20,714,580 | U6 | G/A | 0.749 | 1.00 | 0.018 | 1.1 × 10⁻⁹ | 0.014 | 1.1 × 10⁻⁸ |
| rs1436351 | 3 | 104,617,973 | ALCAM | T/G | 0.736 | 1.00 | 0.016 | 1.4 × 10⁻⁸ | 0.015 | 2.5 × 10⁻¹⁰ |
| rs4833079 | 4 | 38,654,681 | RP11-617D20.1i | T/C | 0.654 | 0.98 | 0.016 | 2.1 × 10⁻¹⁰ | 0.011 | 2.1 × 10⁻⁷ |
| rs10019997 | 4 | 137,048,599 | RP11-775H9.1 | T/C | 0.451 | 1.00 | 0.015 | 7.5 × 10⁻⁹ | 0.016 | 1.5 × 10⁻¹³ |
| rs7730898 | 5 | 170,459,675 | RANBP17i | A/G | 0.739 | 0.98 | 0.016 | 5.1 × 10⁻⁹ | 0.018 | 2.2 × 10⁻¹⁴ |
| rs947612 | 6 | 73,738,661 | KCNQ5i | G/A | 0.315 | 0.98 | 0.018 | 1.6 × 10⁻⁸ | 0.012 | 7.1 × 10⁻⁷ |
| rs901630 | 6 | 98,539,519 | MIR2113 | C/T | 0.617 | 1.00 | 0.014 | 2.5 × 10⁻⁸ | 0.019 | 2.5 × 10⁻¹⁹ |
| rs6569648 | 6 | 130,349,119 | L3MBTL3i | C/T | 0.205 | 1.00 | 0.016 | 4.3 × 10⁻⁸ | 0.011 | 8.7 × 10⁻⁶ |
| rs9364687 | 6 | 163,817,911 | QKI | G/T | 0.576 | 0.99 | 0.016 | 1.0 × 10⁻⁹ | 0.007 | 0.0015 |
| rs6471932 | 8 | 62,078,904 | CLVS1 | T/A | 0.108 | 0.95 | 0.024 | 1.6 × 10⁻⁸ | 0.017 | 6.5 × 10⁻⁸ |
| rs12352785 | 9 | 6,956,850 | KDM4Ci | A/C | 0.282 | 0.99 | 0.018 | 5 × 10⁻¹¹ | 0.009 | 9.4 × 10⁻⁵ |
| rs118067556 | 10 | 63,136,165 | TMEM26 | C/T | 0.966 | 0.89 | 0.044 | 5.6 × 10⁻⁹ | 0.030 | 1.8 × 10⁻⁶ |
| rs10742752 | 11 | 45,438,374 | RP11-430H10.4 | C/T | 0.628 | 0.99 | 0.015 | 3.9 × 10⁻⁹ | 0.012 | 1.8 × 10⁻⁸ |
| rs11170468 | 12 | 39,430,048 | RP11-554L12.1 | A/C | 0.787 | 0.99 | 0.017 | 1.2 × 10⁻⁸ | 0.011 | 4.6 × 10⁻⁶ |
| rs1819844 | 12 | 68,205,604 | RP11-43N5.1 | A/G | 0.181 | 0.99 | 0.019 | 4.4 × 10⁻⁹ | 0.014 | 4.1 × 10⁻⁷ |
| rs2372716 | 12 | 99,573,426 | ANKS1Bi | C/T | 0.198 | 0.99 | 0.017 | 3.1 × 10⁻⁸ | 0.015 | 1.4 × 10⁻⁸ |
| rs9595908 | 13 | 33,184,288 | PDS5Bi | T/C | 0.650 | 0.98 | 0.016 | 6.5 × 10⁻¹⁰ | 0.017 | 1.1 × 10⁻¹⁴ |
| rs9563576 | 13 | 58,670,147 | RN5S30 | C/T | 0.816 | 1.00 | 0.022 | 9.7 × 10⁻¹² | 0.024 | 7.1 × 10⁻¹⁸ |
| rs7161194 | 14 | 101,529,005 | MIR377 | A/G | 0.341 | 0.90 | 0.019 | 1.5 × 10⁻⁹ | 0.018 | 1.3 × 10⁻¹⁴ |
| rs12899850 | 15 | 66,051,299 | DENND4Ai | C/T | 0.788 | 1.00 | 0.020 | 4.0 × 10⁻⁸ | 0.011 | 0.00012 |
| rs11081818 | 18 | 31,251,088 | ASXL3i | A/G | 0.468 | 0.99 | 0.016 | 6.4 × 10⁻⁹ | 0.012 | 1.5 × 10⁻⁸ |
| rs6142096 | 20 | 32,686,658 | EIF2S2i | A/G | 0.523 | 1.00 | 0.016 | 1.1 × 10⁻⁸ | 0.013 | 2.3 × 10⁻⁹ |
| rs17759796 | 22 | 22,190,163 | MAPK1i | A/C | 0.133 | 1.00 | 0.020 | 2.5 × 10⁻⁸ | 0.010 | 0.00067 |
Genomic context within gene, or surrounding genes, are given. Replication test is given by the UKB meta-analysis. GERA+GIANT P-values are based on the multiethnic meta-analysis of GWAS (GERA: 81,278 non-Hispanic whites, 8322 Hispanic/Latinos, 7290 East Asians, 3069 African Americans, and 459 South Asians; GIANT: 234,069 non-Hispanic whites) from the GERA sex-combined data set; GIANT+UKB P-values are based on the multiethnic meta-analysis of the European ancestry GIANT cohort members and the UKB (431,743 non-Hispanic whites, 7620 mixed/other, 9275 South Asians, 1822 East Asians, and 8261 African British). GERA, Genetic Epidemiology Research on Adult Health and Aging cohort; GIANT, Genetic Investigation of Anthropomorphic Traits consortium; UKB, UK Biobank; Chr., chromosome; Bp, base pair (based on University of California Santa Cruz Genome Browser Assembly February 2009: GRCh37/hg19); Freq., frequency; Info., information; β, β coefficient.
Genomic context: i, intron; no label is intergenic.
Conditional results
A strength of a large cohort is more accurate conditional analysis; we next sought to find additional independent signals at each newly and previously identified locus within our large, single GERA cohort. Only two loci (2p25.3 and 18q21.32) contained an additional genome-wide significant conditional variant (Table S6). One was novel at the TMEM18 locus, previously reported to be associated with BMI with lead SNP rs13021737 (Willer et al. 2009); our lead SNP at that locus was rs10188334 (meta-analysis joint P = 3.1 × 10⁻²³), and additional independent rs62106258 (meta-analysis joint P = 5.8 × 10⁻¹⁸), which had r2 < 0.01 with rs10188334 (Table S6). We confirmed this conditional association in the UKB (joint Prs10188334 = 10−84, Prs62106258 = 10−77). We also confirmed a secondary association near MC4R that has been previously reported in multiple studies (Speliotes et al. 2010; Locke et al. 2015).
Characterizing SNP effects
Dominance and epistasis:
We then sought to characterize BMI-associated variants further with two analyses that are typically highly underpowered: dominance and epistasis analyses. However, we still found no evidence of individual SNP dominance (using a P < 0.00011 criterion, Bonferroni for all 457 previously and newly identified independent SNPs), and only a very modest overall distributional departure (Q-Q plot Figure S6, λ = 1.19). We also found no individual SNP epistasis (Bonferroni P < 8.0 × 10⁻⁷ for all pairwise tests of previously and newly identified SNPs), nor any distributional difference (Figure S7, λ = 1.018).
Effects of sex and age on BMI-associated loci:
We next sought to characterize the individual SNP effects by sex. We did not observe any additional genome-wide significant associations for either of the sexes that were not found in the main GERA meta-analysis, as might be expected due to the reduced sample size in each analysis and resulting loss in statistical power, nor did we find any genome-wide significant differences between the sexes. In addition, none of the previously and newly identified SNPs were different between the sexes after Bonferroni correction (P < 0.00014, Figure S8 and Table S7), although there was a moderate overall distributional departure (Q-Q plot, Figure S9; λ = 1.23; proportion with larger female magnitude 50, 95% C.I. = 46–55%, P = 0.50). As previously reported (Locke et al. 2015), we observed suggestive evidence of heterogeneity between men and women for rs543874 near SEC16B (P = 0.0082)
We then tested for age differences, stratifying by age ≤ 50 year (n = 20,848) and age > 50 (n = 79,111), as in Winkler et al. (2015). When testing for differences in the coefficients between the two age groups at all genome-wide SNPs, no SNP had genome-wide significant age differences. Of the 15 BMI-associated SNPs previously identified as affected by age (Winkler et al. 2015), none showed differences between the two age groups after Bonferroni correction (P < 0.05/15 = 0.0033), but three reached nominal significance (0.0033 ≤ P < 0.05): rs1514174 (P = 0.023), rs1459180 (P = 0.0088), and rs12955983 (P = 0.019), more than the one expected by chance. We note that our sample size was smaller than the previous study (Winkler et al. 2015), potentially reducing the power to detect age interactions. Finally, looking at all previously and newly identified independent SNPs for age differences, only rs12955983 (P = 1.3 × 10⁻⁵) was associated after Bonferroni correction (P < 0.00011, Table S8). There was an overall very modest distributional departure (Q-Q plot, Figure S10, λ = 1.17) and evidence of the effect sizes being higher in the younger group (61% of SNPs, 95% C.I. = 56–65%, P = 7.1 × 10⁻⁶).
In silico analysis: prioritizing variants and genes within the 30 novel BMI-associated signals
The SNP with the smallest P-value at a locus is often not the causal SNP. To prioritize variants within the 30 novel GERA and GERA+GIANT genomic regions, we computed each variant’s ability to explain the observed signal and derived the smallest set of variants that included the causal variant with 95% probability (Chen et al. 2015). In each of the 30 autosomal loci, the corresponding 30 credible sets contained from 1 to 4222 variants (6877 total variants, Table S9). Three (of 30) sets were relatively small with < 20 variants. Only one set included a unique variant (intergenic variant SNP rs7161194 with 95.4% probability of being causal), suggesting that this variant may be the true causal variant. Out of the 6877 total variants, 23 variants had > 20% probability of being causal (including 14 lead SNPs). All these 23 variants were either intronic or intergenic.
We also examined whether our 30 replicating novel SNPs identified in GERA or GERA+GIANT were likely to have regulatory consequences using RegulomeDB (Xie et al. 2013; Boyle et al. 2014). Of the 30 SNPs, four SNPs were likely to affect protein binding (score ≤ 2) and an additional two SNPs were less likely to affect protein binding (score = 4). These include, for instance, one SNP identified in the GERA meta-analysis, rs7938308, located in the UTR region of ARNTL on chromosome 11 (Table S4), where five genes encode proteins that bind at the site of rs7938308: CTCF, EP300, GATA2, GATA3, and RAD21.
As identifying expression levels in relation to GWAS-identified variants may help prioritize causal genes, we also examined associations with gene expression for each of the 30 genome-wide significant SNPs identified at novel BMI loci in the current study. We used expression eQTLs from 44 GTEx tissues, including subcutaneous and visceral adipose tissues, from 7051 samples (GTEx Consortium 2015). Out of the 30 SNPs, 10 had a significant GTEx eQTL (Table S10) in a wide range of tissues.
Heritability, family correlations, and variance explained
We then tested for more aggregate overall genetic effects, and interactions with sex and age. We first calculated phenotypic correlations and heritability estimates among family members in the GERA and the UKB non-Hispanic white groups (Table 4). Familial correlation estimates in GERA ranged from 23 to 41%, and were very similar in the UKB (25–34%), corresponding to maximum heritability of ∼50–80%. Sex-specific heritability and a higher sibling vs. parent–child correlation were observed in GERA, but not in UKB. For comparison, in GERA, the spouse correlation was 26.6% (95% CI = 24.2–28.9%, n = 6064).
Heritability estimates
| Group | GERA h2 (95% C.I.) (N) | UKB h2 (95% C.I.) (N) |
|---|---|---|
| Father–offspring | 0.546 (0.436, 0.652) (1134) | 0.636 (0.552, 0.716) (1820) |
| Father–son | 0.622 (0.422, 0.816) (324) | 0.558 (0.424, 0.688) (749) |
| Father–daughter | 0.468 (0.396, 0.654) (810) | 0.678 (0.57, 0.782) (1071) |
| Mother–offspring | 0.618 (0.534, 0.702) (1778) | 0.642 (0.588, 0.696) (4134) |
| Mother–son | 0.564 (0.402, 0.720) (514) | 0.652 (0.564, 0.738) (1616) |
| Mother–daughter | 0.638 (0.538, 0.736) (1264) | 0.65 (0.578, 0.718) (2518) |
| Sibling | 0.704 (0.612, 0.790) (1487) | 0.57 (0.546, 0.594) (21,650) |
| Sibling–male/male | 0.708 (0.484, 0.914) (254) | 0.612 (0.556, 0.666) (4202) |
| Sibling–female/female | 0.820 (0.684, 0.946) (621) | 0.624 (0.582, 0.664) (7659) |
| Sibling–male/female | 0.542 (0.392, 0.684) (612) | 0.486 (0.460, 0.534) (1820) |
| Array–typed PC-Relate | 0.211 (0.195, 0.227) (62,791) | — |
| Array–typed GCTA | 0.278 (0.262, 0.294) (62,791) | — |
| Array–imputed PC-Relate | 0.210 (0.196, 0.224) (62,791) | — |
| Array–imputed GCTA | 0.354 (0.331, 0.377) (62,791) | — |
The estimates for parent–offspring and sibling heritabilities are twice the correlation estimates (see Materials and Methods). GERA, Genetic Epidemiology Research on Adult Health and Aging cohort; PC, principle component; UKB, UK Biobank.
| Group | GERA h2 (95% C.I.) (N) | UKB h2 (95% C.I.) (N) |
|---|---|---|
| Father–offspring | 0.546 (0.436, 0.652) (1134) | 0.636 (0.552, 0.716) (1820) |
| Father–son | 0.622 (0.422, 0.816) (324) | 0.558 (0.424, 0.688) (749) |
| Father–daughter | 0.468 (0.396, 0.654) (810) | 0.678 (0.57, 0.782) (1071) |
| Mother–offspring | 0.618 (0.534, 0.702) (1778) | 0.642 (0.588, 0.696) (4134) |
| Mother–son | 0.564 (0.402, 0.720) (514) | 0.652 (0.564, 0.738) (1616) |
| Mother–daughter | 0.638 (0.538, 0.736) (1264) | 0.65 (0.578, 0.718) (2518) |
| Sibling | 0.704 (0.612, 0.790) (1487) | 0.57 (0.546, 0.594) (21,650) |
| Sibling–male/male | 0.708 (0.484, 0.914) (254) | 0.612 (0.556, 0.666) (4202) |
| Sibling–female/female | 0.820 (0.684, 0.946) (621) | 0.624 (0.582, 0.664) (7659) |
| Sibling–male/female | 0.542 (0.392, 0.684) (612) | 0.486 (0.460, 0.534) (1820) |
| Array–typed PC-Relate | 0.211 (0.195, 0.227) (62,791) | — |
| Array–typed GCTA | 0.278 (0.262, 0.294) (62,791) | — |
| Array–imputed PC-Relate | 0.210 (0.196, 0.224) (62,791) | — |
| Array–imputed GCTA | 0.354 (0.331, 0.377) (62,791) | — |
The estimates for parent–offspring and sibling heritabilities are twice the correlation estimates (see Materials and Methods). GERA, Genetic Epidemiology Research on Adult Health and Aging cohort; PC, principle component; UKB, UK Biobank.
We then estimated the GERA array heritability, which was lower than the familial heritability estimates, at 21.0% (95% CI = 19.6–22.4%) using imputed markers and the PC-Relate method (Conomos et al. 2016). Using the standard GCTA method, which does not account for population stratification in the kinship estimate, yielded a higher estimate at 35.4% (95% C.I. = 33.1–37.7%). We did not evaluate heritability in the other GERA ethnicity groups as the sample sizes were too small.
Next, we tested for age by heritability interaction. We stratified the sample into five roughly equally-sized age groups, using GCTA, as previously done (Robinson et al. 2017). We see a downward trend with increasing age (Figure 3), with a genotype–age interaction that contributes 4.2% (95% C.I. = 0.9–7.7%, P = 0.012) to BMI variation and a coheritability estimate of 26.4% (95% C.I. = 24.6–28.2%). We then tested all pairwise comparisons among the five groups; the comparison between age < 52 year and 66 < age ≤ 73 was the most suggestive (P = 0.0062, Bonferroni P < 0.005; Table S11).
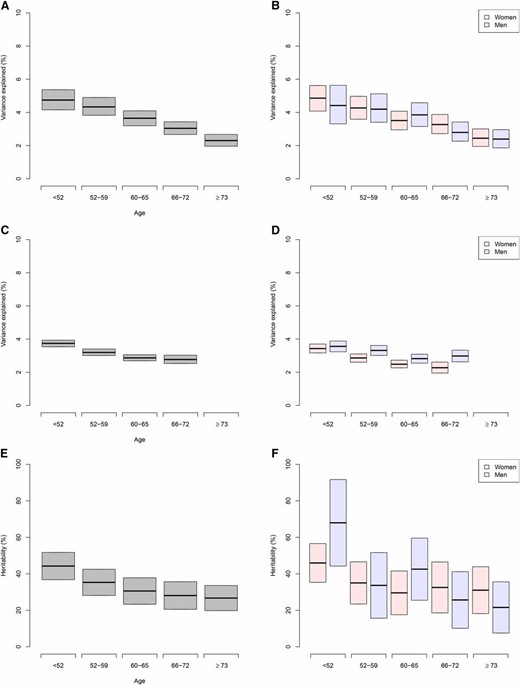
Variance explained. Variance explained by previously and newly identified SNPs stratified by age in GERA non-Hispanic whites overall (A) and by sex (B), and in UKB non-Hispanic whites overall (C) and by sex (D). Heritability in GERA non-Hispanic whites overall (E) and by sex (F). For GERA, one random measurement from each available individual was included in each age bin (each GERA individual was used in multiple age bins whenever possible); for UKB, we used only the one measurement available. GERA, Genetic Epidemiology Research on Adult Health and Aging cohort; UKB, UK Biobank.
Finally, we assessed the proportion of BMI variance explained using a genetic risk score (GRS) of the previously identified BMI SNPs (N = 426). Using independent effect size estimates stratified by sex from the UKB meta-analysis, we found that 3.2 and 3.0% of the variation in BMI was explained by previously reported SNPs in non-Hispanic white women and men, respectively (Table 5). Including GERA- and GERA+GIANT-identified SNPs slightly increased estimates to 3.5 and 3.2%. The variance explained was similar in Latino groups with 4.1 and 2.8% in women and men, respectively , and slightly less in the other groups with 2.6 and 1.7% in East Asians, and 2.0 and 1.3% in African Americans. We also estimated the variance explained in the independent UKB, using GERA/previous effect sizes. In the UKB, the variance explained by previously reported hits in non-Hispanic whites was 2.7% in women and 3.0% in men, increasing to 3.0% in women and 3.3% in men, with similar attenuations in the other groups as in GERA. Stratifying by age groups in GERA, variance explained decreased by age, which is also seen in the UKB, although the effect is more pronounced in women in the UKB (Figure 3).
GRS in GERA and UKB ethnicity groups
| P (426 SNPs) | P+G+GG (457 SNPs) | P+G+GG | P+G+GG | P+G+GG | P+G+GG | ||
|---|---|---|---|---|---|---|---|
| Group | Sex | R2 | R2 | Mean | SD | Eff. | P |
| GERA non-Hispanic whites | F | 0.032 | 0.035 | 7.632 | 0.265 | 0.772 | 10−374 |
| GERA non-Hispanic whites | M | 0.030 | 0.032 | 6.776 | 0.248 | 0.612 | 10−244 |
| GERA Latinos | F | 0.039 | 0.041 | 7.604 | 0.257 | 0.856 | 10−48 |
| GERA Latinos | M | 0.028 | 0.028 | 6.746 | 0.239 | 0.600 | 10−22 |
| GERA East Asians | F | 0.024 | 0.026 | 7.340 | 0.243 | 0.689 | 10−26 |
| GERA East Asians | M | 0.015 | 0.017 | 6.536 | 0.212 | 0.573 | 10−12 |
| GERA African Americans | F | 0.015 | 0.020 | 7.606 | 0.229 | 0.666 | 10−9 |
| GERA African Americans | M | 0.012 | 0.013 | 6.699 | 0.212 | 0.466 | 10−4 |
| UKB non-Hispanic whites | F | 0.027 | 0.030 | 8.315 | 0.287 | 0.639 | 10−1545 |
| UKB non-Hispanic whites | M | 0.030 | 0.033 | 6.017 | 0.217 | 0.760 | 10−1451 |
| UKB mixed/other | F | 0.033 | 0.035 | 8.346 | 0.288 | 0.700 | 10−34 |
| UKB mixed/other | M | 0.029 | 0.032 | 5.956 | 0.217 | 0.748 | 10−26 |
| UKB East Asians | F | 0.017 | 0.020 | 8.184 | 0.251 | 0.571 | 10−6 |
| UKB East Asians | M | 0.016 | 0.014 | 5.864 | 0.190 | 0.599 | 10−3 |
| UKB African British | F | 0.013 | 0.013 | 8.554 | 0.245 | 0.524 | 10−15 |
| UKB African British | M | 0.018 | 0.015 | 5.818 | 0.179 | 0.573 | 10−13 |
| UKB South Asians | F | 0.018 | 0.019 | 8.289 | 0.269 | 0.567 | 10−19 |
| UKB South Asians | M | 0.022 | 0.021 | 5.928 | 0.207 | 0.624 | 10−24 |
Abbreviations: P, previously-identified; G, GERA-identified; GG, GERA+GIANT-identified; R2, variance explained from GRS using GERA meta-analysis effect sizes (stratified by sex); Eff., effect; GERA, Genetic Epidemiology Research on Adult Health and Aging cohort; GIANT, Genetic Investigation of Anthropomorphic Traits consortium; UKB, UK Biobank.
| P (426 SNPs) | P+G+GG (457 SNPs) | P+G+GG | P+G+GG | P+G+GG | P+G+GG | ||
|---|---|---|---|---|---|---|---|
| Group | Sex | R2 | R2 | Mean | SD | Eff. | P |
| GERA non-Hispanic whites | F | 0.032 | 0.035 | 7.632 | 0.265 | 0.772 | 10−374 |
| GERA non-Hispanic whites | M | 0.030 | 0.032 | 6.776 | 0.248 | 0.612 | 10−244 |
| GERA Latinos | F | 0.039 | 0.041 | 7.604 | 0.257 | 0.856 | 10−48 |
| GERA Latinos | M | 0.028 | 0.028 | 6.746 | 0.239 | 0.600 | 10−22 |
| GERA East Asians | F | 0.024 | 0.026 | 7.340 | 0.243 | 0.689 | 10−26 |
| GERA East Asians | M | 0.015 | 0.017 | 6.536 | 0.212 | 0.573 | 10−12 |
| GERA African Americans | F | 0.015 | 0.020 | 7.606 | 0.229 | 0.666 | 10−9 |
| GERA African Americans | M | 0.012 | 0.013 | 6.699 | 0.212 | 0.466 | 10−4 |
| UKB non-Hispanic whites | F | 0.027 | 0.030 | 8.315 | 0.287 | 0.639 | 10−1545 |
| UKB non-Hispanic whites | M | 0.030 | 0.033 | 6.017 | 0.217 | 0.760 | 10−1451 |
| UKB mixed/other | F | 0.033 | 0.035 | 8.346 | 0.288 | 0.700 | 10−34 |
| UKB mixed/other | M | 0.029 | 0.032 | 5.956 | 0.217 | 0.748 | 10−26 |
| UKB East Asians | F | 0.017 | 0.020 | 8.184 | 0.251 | 0.571 | 10−6 |
| UKB East Asians | M | 0.016 | 0.014 | 5.864 | 0.190 | 0.599 | 10−3 |
| UKB African British | F | 0.013 | 0.013 | 8.554 | 0.245 | 0.524 | 10−15 |
| UKB African British | M | 0.018 | 0.015 | 5.818 | 0.179 | 0.573 | 10−13 |
| UKB South Asians | F | 0.018 | 0.019 | 8.289 | 0.269 | 0.567 | 10−19 |
| UKB South Asians | M | 0.022 | 0.021 | 5.928 | 0.207 | 0.624 | 10−24 |
Abbreviations: P, previously-identified; G, GERA-identified; GG, GERA+GIANT-identified; R2, variance explained from GRS using GERA meta-analysis effect sizes (stratified by sex); Eff., effect; GERA, Genetic Epidemiology Research on Adult Health and Aging cohort; GIANT, Genetic Investigation of Anthropomorphic Traits consortium; UKB, UK Biobank.
Tissue eQTL enrichment analysis
For further aggregate biological insight into the role of BMI-associated SNPs, we also utilized the GTEx eQTLs to test for enrichment of all lead previously and newly identified BMI-associated variants. For each tissue, we determined whether the proportion of eQTLs was greater than expected. Expression in the cerebellum was different from the median expression over all tissues (P = 0.0002; Figure 4; Bonferroni significance = 0.0011).

Tissue eQTL enrichment. Enrichment of tissue for proportion of eQTLs that are genome-wide significant by GTeX tissue type (44 tissues, labeled in figure). eQTL, expression QTL; GTeX, Genotype-Tissue Expression consortium.
Discussion
In the large, ethnically diverse GERA cohort with EHR-derived BMI measurements, we noted nonlinear and interaction effects between ancestry PCs, in addition to nationality effects, demonstrating effects of both ancestry and location (environment) on BMI; 30 novel, independent BMI-associated loci (not previously associated with BMI or adiposity-related phenotypes) very slightly increased variance explained; and variance explained decreased with increasing age by both GRS and heritability estimates.
We found notable interactions (non-Hispanic whites and East Asians) and nonlinear effects (East Asians) in the distribution of BMI by ancestry PCs. These ancestry effects may reflect genetic differences or they may reflect environmental/cultural differences. Specifically, the vertical cline in East Asians appears to be determined by intact nationalities, and, e.g., diets may differ among those nationalities. However, for Latinos, the European–Native American ancestry PC does not have the same distinct clusters of nationalities (Banda et al. 2015), and we additionally see a nationality effect, with individuals from Mexico and Central–South America overlapping on ancestry PCs, but differing with respect to average BMI, implicating environmental/cultural effects in this difference. African Americans also did not have distinct subgroups.
Novel BMI-associated loci support the important role of signaling pathways linked to adipose cell impairment, including the adipogenesis and insulin signaling pathways (Pradhan et al. 2017). In this study, we identified L3MBTL3 and AKT3 as novel BMI loci, which replicated at Bonferroni significance; these two loci have been shown to be involved in the insulin signaling pathway. SNPs in L3MBTL3 have been shown to contribute to increased adult height and birth length (Paternoster et al. 2011). Recently, L3MBTL3 was reported to be associated with insulin resistance and affect adipocyte differentiation (Lotta et al. 2017). AKT3 encodes the AKT serine/threonine kinase 3, and mutations in this gene can cause an overgrowth of the brain, called megalencephaly (Alcantara et al. 2017). AKT3 protein is part of the phosphatidylinositol-3-kinase (PI3K)-AKT-MTOR pathway and has been shown to be stimulated by insulin (Brozinick et al. 2003; Medina et al. 2005; Xie et al. 2016). Thus, mutations in those genes could contribute to impaired Akt-dependent insulin signaling in adipocytes, leading to adipose tissue accumulation and insulin resistance. In this study, we also identified KDM4C, which encodes a member of the Jumonji domain 2 (JMJD2) family. KDM4C has been shown to be involved in the PPARγ transcriptional activation and regulation of adipogenesis (Lizcano et al. 2011). Thus, these findings support an important role of KDM4C in the etiology of obesity, and suggest that this gene might be a good therapeutic target to treat obesity. Other genes within the novel loci identified in the current study have a plausible role in biological mechanisms relevant to obesity etiology. For example, ARNTL has been reported to contribute to a morningness-associated pathway related to circadian rhythms (Hu et al. 2016). Our results support previous work showing a relationship between the genetics of morningness, circadian rhythms, and metabolic traits, including BMI (Lane et al. 2017).
In addition, our tissue eQTL enrichment analysis revealed that GWAS BMI-associated SNPs were enriched in the cerebellum. This finding is consistent with previous works showing the importance of brain structure, and especially gray matter volume in the cerebellum, in obesity susceptibility in humans and in rats (Locke et al. 2015). In this study, we also identified ADGRB3 (or BAI3 for brain-specific angiogenesis inhibitor 3) as a novel BMI locus, which is a cell-adhesion G protein-coupled receptor (GPCR). BAI3 is highly expressed in Purkinje cells (neurons located in the cerebellar cortex of the brain), and it is involved in C1ql1 signaling in the mouse cerebellum to mediate normal motor learning (Lanoue et al. 2013; Kakegawa et al. 2015). Other GPCRs have been previously reported to be associated with obesity in humans and mice (Ichimura et al. 2012; Nakajima et al. 2016), and are currently being investigated as promising targets for drug discovery to treat metabolic diseases (Hauser et al. 2017; Riddy et al. 2018; Sloop et al. 2018).
As per the variance explained by genetic risk factors, we showed here a decreasing variance explained with increasing age in both GERA and UKB (albeit stronger in women in the UKB). However, we note that it is possible that the decrease in variance explained by age could also reflect a cohort–year effect. In addition we found that GERA- and GIANT-identified SNPs also slightly increased the variance explained in GERA and the UKB, for a total of 3.5% in GERA non-Hispanic white females and 3.2% in males, and 3.0% in UKB non-Hispanic white females and 3.3% in males. Earlier studies of BMI estimated 1.45% of the variance explained by known SNPs (Speliotes et al. 2010), with more recent GIANT estimates of 2.7% (but the same discovery cohort was used, which can bias estimates upwards) (Locke et al. 2015), and 3.5% from a younger Finnish cohort of a younger mean age of 30 (Horikoshi et al. 2015). In addition, our estimate of the variation explained by all variants was 21% with PC-Relate, which adjusts for population substructure in the kinship estimate directly, which is less than the 35% when adjusting for population substructure as covariates; these are close to recent previous estimates of 27% (Yang et al. 2015). These are still about one-half of the family-based estimates of 40%, as has been noted (Yang et al. 2015); additional variation may be due to rare variants, which were not well assessed here, or unaccounted for shared environmental effects. Finally, our estimate of gene–age interaction effects of 4.2% (95% C.I. = 0.9–7.7%) was estimated as approximately one-half of previous work (8.1%) (Robinson et al. 2017), though our age groups were slightly older. In addition, our results were consistent with previous work (Robinson et al. 2017), showing suggestive evidence of a gene–age interaction effect on BMI, with the largest differences existing between the youngest group compared to older groups.
Because our study was conducted in a single, large, diverse discovery cohort, we were able to evaluate effects across ethnicity groups in the same setting. The variance explained by previously reported loci was estimated highest in non-Hispanic white and Latino women in both GERA and UKB, with GERA and UKB East Asian women and males both lower, and with GERA African American women lower, GERA African American men higher, and overall UKB men and women both lower than GERA.
There were several limitations to our study. In addition to replication data on the sex chromosomes being unavailable in GIANT, we note an additional limitation in using GIANT summary statistics expanded from HapMap 22, rather than full 1000 Genomes Project imputed results, as such results are not available. This use of approximated results, in addition to the assumption that all test statistics from GIANT are perfectly imputed, is likely conservative in terms of the true effect at each SNP. Nevertheless, 87% of the SNPs identified in the GERA+GIANT meta-analysis replicated at a strict Bonferroni correction in the UKB, and we could test SNPs on the sex chromosomes in the UKB.
In summary, our results demonstrate the value of conducting genetic studies in large, diverse cohorts, enabled by linking EHRs with genome-wide genotype data, and expand our knowledge of the genetic basis of BMI.
Acknowledgments
We thank the Kaiser Permanente Northern California members who have generously agreed to participate in the Kaiser Permanente Research Program on Genes, Environment, and Health. This research has been conducted using the UK Biobank Resource. This work was supported by grants R21 AG-046616 and K01 DC-013300 to T.J.H., and R01 EY-027004 to E.J., from the National Institutes of Health (NIH). Support for participant enrollment, survey completion, and biospecimen collection for the RPGEH was provided by the Robert Wood Johnson Foundation, the Wayne and Gladys Valley Foundation, the Ellison Medical Foundation, and Kaiser Permanente national and regional community benefit programs. Genotyping of the GERA cohort was funded by a grant from the National Institute on Aging, the National Institute of Mental Health, and the NIH Common Fund (grant RC2 AG-036607 to C.S. and N.R.). The funders had no role in study design, data collection and analysis, the decision to publish, or preparation of the manuscript. The authors declare that they have no competing interests.
Author contributions: T.J.H., H.C, and E.J. conceived and designed the study. T.J.H. performed the statistical analysis. T.J.H., H.C., and J.Y. performed in silico analyses. T.J.H., H.C., and E.J. interpreted the results of the analysis, and wrote the initial draft. J.Y., Y.B., M.N.K., M.G., C.S., and N.R. contributed to the critical review of the manuscript.
Footnotes
Supplemental material available at Figshare: https://doi.org/10.25386/genetics.6957152.
Communicating editor: N. Wray
