


Abstract
The development of genetic maps multiple species of Drosophila to understand the basis for species formation became problematic because visible mutations were not easily compared among species and species-specific linkage groups lacked a standard nomenclature...
The concept of synteny, or conservation of genes on the same chromosome, traces its origins to the early days of Drosophila genetics. This discovery emerged from comparisons of linkage maps from different species of Drosophila with the goal of understanding the process of speciation. H. J. Muller published a landmark article entitled Bearings of the “Drosophila” work on systematics, where he synthesized genetic and physical map data and proposed a model of speciation and chromosomal gene content conservation. These models have withstood the test of time with the advent of molecular genetic analysis from protein to genome level variation. Muller’s ideas provide a framework to begin to answer questions about the evolutionary forces that shape the structure of the genome.
IT is tempting to think that comparative genomics is a relatively new field, but Drosophila geneticists were comparing the gene content among species as early as the 1920s. H. J. Muller’s (1940) landmark publication, Bearings of the “Drosophila” work on systematics, synthesized the data from Drosophila genetic and physical mapping experiments and established that the gene content of chromosomal arms was conserved among species, i.e., synteny. Muller’s (1940) article provided a road map for how genetic and chromosomal mutations within Drosophila species provided the fuel for the formation of new species. Until that point, the nomenclature for mutations and linkage groups in each Drosophila species was distinct. A new mutant found in a non-melanogaster species received a name from its discoverer that made no attempt to determine homology with previously identified mutations. As equivalence of mutations was established, it became apparent that linkage groups were conserved among species, and Muller proposed a standard nomenclature that labeled Drosophila chromosome arms as A to F, now referred to as Muller elements A to F. The article proposed a genetic model for how gene and chromosomal mutations accumulate between species, leading to reproductive barriers or incompatibilities in species hybrids. The question is, how did Drosophila geneticists figure out how chromosomal arms were conserved in gene contents without the fancy tools of modern genomics?
The story starts at the turn of the 20th century when biologists were trying to understand the nature of genetic traits on which Darwinian selection acts. At the time, geneticists disagreed about whether Darwinian selection acted on continuously or discretely varying traits (Provine 1971). Robert Kohler (1994) provides a plausible road map for why Drosophila melanogaster became the important model system for the study of genetics. Thomas Hunt Morgan was interested in the role genetic variation played in the formation of new species. He performed artificial selection experiments on a trident coloration pattern on the thorax of the fly. His experiments involved selecting for extreme phenotypes followed by inbreeding of strains. It was at this time that a number of discrete traits, including the sex-linked white eye color, emerged in his fly stocks (Morgan 1910). Robert Kohler (1994) suggested that, at this point, the Drosophila research enterprise in T. H. Morgan’s laboratory took off. The Morgan laboratory became a breeder reactor for new mutants because the more flies were inbred, the more discrete mutations were revealed, leading to more inbreeding of stocks. If I could go back in time, I would want to go to the Morgan laboratory between 1910 and 1940 because many genetic puzzles were solved during this time by some of the most brilliant genetic intellects of the 20th century.
The problem with the expanding number of mutations was how to organize and name them. Morgan (1911) suggested that mutants be named according to the traits they affected such as all variants that altered eyes. He suggested that eye color be symbolized by the three mutations red, pink, and orange (RPO), whose combinations of dominant and recessive alleles lead to the observed eye colors. The problem with this organizational system is that with each new mutation one had to potentially reset the nomenclature. An alternative nomenclature and organizational scheme was to name each mutant based on its phenotype as well as its location in the genome. Calvin Bridges suggested that each mutation be assigned a unique name and abbreviation based on what the mutant does to the phenotype (Morgan 1939). An uppercase letter was used if the mutant phenotype was dominant and a lowercase letter was used for recessive mutations. The normal or wild-type allele was indicated with a +. For instance, a fly with the dominant mutation curly wings was given the symbol Cy because curly was dominant to the wild-type Cy+ allele. In addition, Sturtevant (1915) used the idea of genetic linkage discovered by Bateson et al. (1905) to organize the mutations based on their physical location in the genome, in other words, by linkage group. He reasoned that genes that are close together will tend to segregate together more often than genes that are further apart (Sturtevant 1915). As we now know, this system assigns mutations to unique locations in the genome that correspond to the position of the mutated gene on chromosomes based on recombinational distances. The advantage of this method was that one did not need to reorganize the nomenclature with the discovery of each new mutation, but could simply add the new gene to its location on the map. Bridges famously constructed a four-sided “totem pole” to represent the D. melanogaster genome, where each side of the four-sided column represented one linkage group or chromosome, and thumbtacks labeled with gene names indicated the location of each gene on its respective chromosome as well as the quality of the mutation (Morgan 1939).
The link between genes and chromosomes began with Sutton’s (1902, 1903) work on grasshopper chromosomes, which appeared to behave according to Mendel’s law of segregation (reviewed in the GENETICS Perspectives article by Crow and Crow 2002). Extending this work to D. melanogaster, known as D. ampelophila at the time, proved to be challenging because of the difficulty of preparing metaphase chromosomes from the spermatocytes (Stevens 1907, 1908). Despite this, Stevens was able to show that D. melanogaster had one pair of rod-shaped, two pairs of v-shaped, and a pair of small dot chromosomes corresponding to the X, second, third, and fourth chromosomes, respectively. Bridges (1916) used the improper segregation of chromosomes in mutant strains to link genes with chromosomes (reviewed in the GENETICS Perspectives article by Ganetzky and Hawley 2016). The correspondence between the observed number of linkage groups and the number of homologous pairs provided additional support that chromosomes carried the genes (Morgan et al. 1915).
Not only were early Drosophilists interested in the basis for heredity, they also wanted to know how genes could lead to the formation of new species. Was it changes to individual genes or did chromosomes play a role? The genetics of reproductive isolation proved to be elusive initially because crosses between D. melanogaster and its closest relative, D. simulans, failed to yield hybrid males and hybrid females were sterile (Sturtevant 1920), hardly an ideal system to study the genetics of the speciation process. Other species pairs provided better models for understanding the genetics of reproductive isolation. A better model system for speciation genetics was discovered when crosses between race A and race B of D. obscura produced sterile males and fertile females. It turned out that strains of D. obscura collected from the United States had different metaphase karyotypes than their European counterparts, and the species from the United States was renamed D. pseudoobscura (Frolowa and Astaurow 1929). Race A retained the name D. pseudoobscura and race B was renamed D. persimilis (Dobzhansky and Epling 1944). This species pair allowed the genetic dissection of the male sterility trait using backcrosses of hybrid females to either parental species (Dobzhansky 1936). One needed a good genetic map in D. pseudoobscura or D. persimilis to locate sterility genes in the genome.
An early approach to examine genetic differences between species was to examine metaphase chromosomes among Drosophila species (Metz 1914). Species were found to have different numbers of chromosomes, but the chromosomes were always associated in pairs of similar shape (Metz 1916a). Sex chromosomes were easily identified through comparisons of male and female metaphase chromosomes within species. The karyotype, or description of the full complement of chromosomes from a species, found that one could cluster different Drosophila species based on the similarity of chromosome numbers and shapes (Metz and Moses 1923). This suggested that there might a chromosomal basis for species’ differences and isolation. Although metaphase chromosomes provide a window into differences in the genetic basis of species formation, one could not determine the equivalence among the different chromosomal arms at this level of resolution, other than the inferred X and Y chromosomes. Sturtevant (1921d) provided the first account of the systematics of Drosophila species from North America using morphological and chromosomal data to describe and begin to relate different species. In addition, he listed the few known mutations that had been identified in each species. This led to an expansion in the development of genetic maps for more Drosophila species, with the ultimate goal of being able to compare and identify homologous chromosomes between species and to understand how new species formed. This truly was the beginning of comparative genomics.
Conservation of chromosomal arms was first suggested by the linkage maps of X-linked mutations in different species. X-linked mutations are obvious based on their mode of transmission in reciprocal crosses. Linkage maps for the X were developed for D. simulans (Sturtevant 1921b), D. obscura (D. pseudoobscura; Lancefield 1922), D. virilis (Metz 1916b, 1918), and D. willistoni (Lancefield and Metz 1922). For each species, mutations were collected and named independently and often the names did not correspond to those in D. melanogaster. The first surprising result was that genes such as Notch wings, yellow body color, and white eyes were X-linked in all the species. The order of genes, however, was not the same in the different species. Sturtevant’s (1917) discovery of crossover suppressors associated with chromosomal inversions provided the mechanism for rearrangements of genes along chromosomes (Sturtevant 1921a). The second puzzling observation was that the X chromosomes of D. willistoni and D. obscura were larger than the X chromosomes of D. melanogaster, D. simulans, or D. virilis (Lancefield 1922; Lancefield and Metz 1922). The expansion seemed to result from the addition of genes similar to those of the left arm of the third chromosome of D. melanogaster.
Establishing the conservation of the autosomal chromosomal arms was more challenging. The problem was that the nomenclature for the chromosomal arms was unique to each species. There was agreement on what was the X chromosome, but the names of autosomes differed among species. The chromosomes of some species followed the convention of D. melanogaster using numbers, while letters were used in other species. Despite the nomenclature problem, the linkage maps of the autosomes soon followed for additional species: D. simulans (Sturtevant 1921c), D. affinis (Sturtevant 1940), D. algonquin (Miller 1939), D. ananassae (Kikkawa 1938), D. azteca (Dobzhansky and Socolov 1939), D. miranda (Dobzhansky and Tan 1936), D. pseudoobscura (Crew and Lamy 1934, 1935, 1936; Donald 1936; Tan 1936), and D. virilis (Metz et al. 1923; Chino 1936a,b, 1937). To show homology, one had to compare morphology and mode of transmission of traits. The descriptions that established homology among species were remarkable given that there was no sequence comparison or in situ hybridization to validate gene homology. A particularly interesting comparison is of the Jagged mutation in D. pseudoobscura by Sturtevant and Tan (1937):
Jagged (3, 23.3). This probably is a reoccurrence of Lancefield’s Trimmed. We have two allelomorphs; both give irregular nicks in the wing margin, and the more extreme one gives an abnormal scutellum, the posterior scutellar bristles being often abnormal. Both allelomorphs are dominant and lethal when homozygous. This may possibly represent the vestigial locus of D. melanogaster (Sturtevant and Tan 1937).
This comparison illustrates the problem. Each species-specific research group gave their mutations a unique set of names. They were following standard naming conventions established for D. melanogaster, but they introduced new names. Only careful comparisons of the phenotypes between the species could be used to infer homology.
The discovery of chromosomal aberrations provided a powerful tool for developing physical maps and orienting genes to chromosomes. Translocations generated with X rays were particularly useful because they often moved groups of genes from one linkage group to another (Dobzhansky 1929, 1930). Translocations could be seen in metaphase chromosomes by increases in length, but it was the discovery of polytene chromosomes from larval salivary glands that allowed more detailed fusion of genetic and physical maps (Painter 1933, 1934). This technique provided a vast improvement over metaphase chromosome preparations because the chromosomal banding was reproducible and offered many more markers to define variation among cytogenetic maps. Calvin Bridges (1935) drew the first set of cytogenetic maps of the D. melanogaster polytene chromosomes which are still used today (Schaeffer et al. 2008). The polytene maps allowed one to precisely define the locations of aberration breakpoints within species. X ray-induced translocations could readily be observed in the polytene chromosomes and one could orient the linkage maps relative to the ends of chromosomes, i.e., centromeres and telomeres. Genes more closely linked to the centromere were less likely to be translocated than genes near the telomere. Translocations that became associated with the X or Y chromosomes were particularly useful because the altered transmission of traits was easily observed; but with polytene chromosomes, one could identify breakage sites to a particular cytogenetic band. The cytological maps could be compared between closely related species, but the pattern of bands and puffs diverged quite rapidly among distantly related species. In hindsight, no one could have imagined a more useful genetic tool for the humble vinegar fly when they were first used in genetic research.
Donald (1936) made the first attempt to equate the chromosomal arms of different species in his comparison of D. melanogaster with D. pseudoobscura (Figure 1). The figure links inferred homologous genes from the linkage maps of the two species. It is clear that gene order has been rearranged and the organization of the major chromosomal arms has changed. The equivalence of D. melanogaster and D. pseudoobscura chromosomal arms inferred by Donald is shown in Table 1.
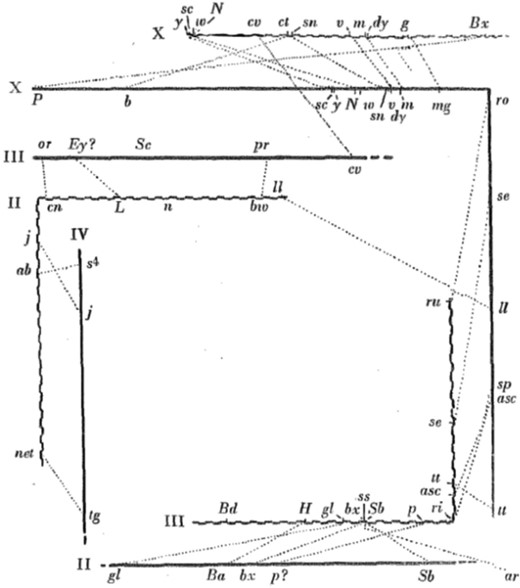
Linkage maps of the major chromosomes of D. pseudoobscura (straight lines) and D. melanogaster (wavy lines) with corresponding loci connected with dotted lines (figure 2 from Donald 1936). (Reprinted by permission from RightsLink Permissions Springer Customer Service Centre).
Equivalence of D. melanogaster and D. pseudoobscura chromosomal arms
| Chromosomal arms | |||||
|---|---|---|---|---|---|
| D. melanogaster | X | 2L | 2R | 3L | 3R |
| D. pseudoobscura | XL | 4 | 3 | XR | 2 |
| Chromosomal arms | |||||
|---|---|---|---|---|---|
| D. melanogaster | X | 2L | 2R | 3L | 3R |
| D. pseudoobscura | XL | 4 | 3 | XR | 2 |
| Chromosomal arms | |||||
|---|---|---|---|---|---|
| D. melanogaster | X | 2L | 2R | 3L | 3R |
| D. pseudoobscura | XL | 4 | 3 | XR | 2 |
| Chromosomal arms | |||||
|---|---|---|---|---|---|
| D. melanogaster | X | 2L | 2R | 3L | 3R |
| D. pseudoobscura | XL | 4 | 3 | XR | 2 |
This equivalence table nicely demonstrates the problem. Although the data inferred which chromosomal arms corresponded to each other, the historical names for the arms did not equate with those of D. melanogaster. It was at this point that Muller (1940) developed the nomenclature for the chromosomal arms for Drosophila as a by-product of synthesizing a model for the evolution of genes, chromosomes, and species. He noted that cytogenetic studies of Dobzhansky and Sturtevant (1938) showed extensive polymorphism for paracentric inversions whose history could be described in networks of single changes. Not only were inversions observed within species, but they could be observed between closely related species (Tan 1935). Muller also noted that other types of rearrangements, deficiencies, duplications, and translocations were quite rare in Drosophila lineages. Given that paracentric inversions were a common form of rearrangement and the stability of chromosomal arm sizes across the Drosophila genus, he proposed his model of chromosomal conservation and a standardized nomenclature for referring to the chromosomal arms. Table 2 reproduces Muller’s original proposal of the six conserved chromosomal elements.
Comparisons of chromosomal arms among Drosophila species (Muller 1940)
| Chromosomal arm (notation ours) | A | B | C | D | E | F |
|---|---|---|---|---|---|---|
| melanogaster and simulans | X | IIL | IIR | IIIL | IIIR | IV |
| pseudoobscura | XL | IV | III | XR | II | V |
| miranda | XL | IV | X2 | XR | II | V |
| virilis | X | IV | V | III | II | VI |
| (virilis) americana | XL | XR | IV |
In a footnote to the table, he stated that “any system of numbering the whole chromosomes in sequence, as hitherto practiced, must fail to indicate homologies.” In other words, chromosomal arms are conserved across species, but not complete chromosomes. For instance, the X chromosome of D. pseudoobscura (XL+XR, one chromosome) is not equivalent to the X of D. melanogaster (X+IIIL, two arms of different chromosomes). The original table from Muller (1940) expanded as the number of species studied increased (Sturtevant and Novitski 1941; Patterson and Stone 1952; Ashburner 1989).
The evolution of the conserved arms using polytene chromosomes has been a useful phylogenetic character to understand how the karyotype has changed through evolutionary history (Carson and Yoon 1982; Ehrman and Powell 1982; Lakovaara and Saura 1982; Levitan 1982; Throckmorton 1982; Wasserman 1982). Comparisons of closely related Drosophila species have found inversion differences among species, such as the pericentric inversion on chromosome 2 that distinguishes the melanogaster subgroup from D. erecta and D. yakuba (Lemeunier and Ashburner 1976). Recent data suggest that the species-specific inversions may have played an important role in limiting genetic exchange through recombination suppression in species hybrids (Noor et al. 2001). Although rare, translocations have fused different Muller elements together.
Muller’s elements have been confirmed with molecular genetic data. The advent of protein electrophoresis extended genetic maps to include enzyme- and protein-encoding loci (Lewontin and Hubby 1966; Cavener 1977; Prakash 1977; Loukas et al. 1979; Böhm et al. 1987). The locations of the allozyme genes supported the conservation of Muller elements. The small numbers of morphological and allozyme loci suggested that inversions were shuffling gene order, but it was not clear the magnitude of rearrangement that had occurred among species.
The use of in situ hybridization of DNA to polytene chromosomes has been a powerful approach to verify the conservation of Muller elements, but it also provided valuable insights into the mechanisms of chromosomal rearrangements and laid the groundwork for anchoring genome sequence contigs to the polytene chromosomes. Initially, small numbers of DNA probes were hybridized to the polytene chromosomes of different species, adding support for the conservation of Muller elements (Steinemann 1982, 1984; Whiting et al. 1989; Terol et al. 1991; Segarra and Aguade 1992; Papaceit and Juan 1993; Rohde et al. 1994, 1995; Bondinas et al. 2001, 2002; Santos et al. 2010).
Molecular cloning and the construction of genomic libraries allowed hundreds of kilobase-sized clones (λ’σ, P1s, and BACs) to be used to develop extensive physical maps of Drosophila chromosomes and determine rates of rearrangement on the different chromosomal arms (Segarra et al. 1996; Ranz et al. 1997, 1999, 2001, 2003; Vieira et al. 1997a,b; Gonzalez et al. 2002, 2007; Papaceit et al. 2006). These studies showed that inversion rates were an order of magnitude higher than transposition rates (Ranz et al. 2003). Inversion rates differed among Muller elements and differed among Drosophila lineages (Gonzalez et al. 2002, 2007). These dense physical maps also suggested that inversion breakpoints may be reused (Gonzalez et al. 2007), confirming the observation of coincident breakpoints on polytene maps in the melanogaster subgroup (Lemeunier and Ashburner 1976). The in situ hybridization data also revealed exceptions of strict conservation of Muller elements. Papaceit and Juan (1998) showed that the dot chromosome of D. willistoni fused to Muller E, while the dot chromosome of D. lebanonensis fused with Muller A. Another apparent departure from strict conservation is seen on the metacentric X of D. pseudoobscura, where the in situ hybridization with P1 clones suggested that there was a pericentric inversion that moved DNA from Muller A to the Muller D arm (Segarra et al. 1995).
The ultimate test of conservation of the chromosomal arms of Drosophila was confirmed with the comparison of 12 complete Drosophila genomes (Clark et al. 2007). The in situ hybridization proved to be an invaluable tool to link the contigs from the sequence assembly to the polytene chromosomes (Schaeffer et al. 2008). These genomes allowed a detailed comparison of the locations of all genes among the genomes and confirmed the observations from the in situ hybridization experiments (Bhutkar et al. 2008). The genome data provided a quantitative estimate of gene sharing among the elements. Eighty-nine percent of genes are found on their predicted Muller elements. The complete genomes supported the low transposition rate of genes between chromosomal arms. The genome data confirmed observations from in situ hybridization that the rearrangement rates differ on each Muller element and among the various Drosophila lineages (Gonzalez et al. 2007; Bhutkar et al. 2008). The genomic data also confirmed the exceptions of strict conservation of Muller elements. The major pericentric inversion between Muller B and C in the ancestor of D. erecta and D. yakuba, as predicted from the cytogenetic analysis of polytene chromosomes (Lemeunier and Ashburner 1976), was also found in the genomic data. The in situ hybridization data for the X chromosome of D. pseudoobscura suggested that a pericentric inversion had moved genes from Muller A to Muller D (Segarra et al. 1995). The genomic sequence provides evidence that, instead of a pericentric inversion, it appears that the centromere has moved because none of Muller D gene orthologs had moved to the Muller A arm, an expectation if a pericentric inversion occurred. The genome data also confirm that the dot chromosome (Muller F) is now fused with Muller E in D. willistoni. Amazingly, Muller’s elements appear to be conserved for >250 MY, based on comparisons of the D. melanogaster and Anopheles gambiae genomes (Coluzzi et al. 2002). Although there are exceptions, the original findings of chromosomal arm conservation proposed by Muller based on a minimal set of carefully curated morphological mutations is largely supported by molecular genetic data and complete genomes sequences.
Muller did not refer to the chromosomal arms as his elements. After his 1940 publication, authors referred to the chromosomal arms using the A through F nomenclature of Muller (1940) or as the Muller (1940) chromosomal elements. The first reference to the conserved chromosomal arms as Muller elements appears first in the late 1980s (Ashburner 1989; Whiting et al. 1989) and has been used consistently ever since.
The confirmation of Muller elements through genome sequencing is not the end of the story. We are now poised to understand why the genome is structured the way it is. Why are Muller elements conserved? Why does the number of chromosomes increase and decrease through fissions and fusions? What are the mechanisms that generate new inversion mutations? What are the evolutionary genetic mechanisms for reshaping the genome? Is it that there are functional constraints to maintain the same genes together on a chromosome, or is it that species lack genomic mechanisms to make certain types of rearrangements? There has been renewed interest in understanding the evolutionary mechanisms that establish and maintain the rearrangements’ shuffled gene order within the Muller elements, both within populations and between species. Fortunately, comparative genomics and bioinformatics have provided powerful tools to help understand the forces that shape the evolution of Drosophila genomes in nature.
Nucleotide sequences at inversion breakpoints have provided clues about how inversions are generated in populations, although there does not appear to be a universal mechanism for the breakage and rearrangement of chromosomal segments. Some inversions may be the product of random breakage of chromosomes (Wesley and Eanes 1994). Inter- and intraspecific analyses of Drosophila inversion breakpoints have suggested a staggered-cut model where two offset cuts in DNA lead to duplication of genes at the proximal and distal breakpoints (Matzkin et al. 2005; Ranz et al. 2007). The staggered-cut model can explain how an embedded gene can be decoupled from the intron of its parental gene when this complex gene structure is duplicated at the two breakpoints (Calvete et al. 2012). On the other hand, Drosophila inversions can be generated via simple repeats or transposable elements (Andolfatto et al. 1999; Casals et al. 2003; Richards et al. 2005; Delprat et al. 2009; Rius et al. 2013). The small repeats found in D. pseudoobscura were enriched in intergenic regions associated with syntenic breaks among species as well as at intraspecies breakpoints (Richards et al. 2005). The third chromosome of D. pseudoobscura has >30 different gene arrangements that were generated by paracentric inversions (Dobzhansky 1944). The repeats discovered at inversion and syntenic breakpoints, however, are not restricted to the highly polymorphic third chromosome, leaving a mystery as to why other chromosomes are not segregating for paracentric inversions.
Comparative genomes among Drosophila species has shown that inversion breakpoints are nonrandomly distributed along the Muller elements (Engstrom et al. 2007; Bhutkar et al. 2008; von Grotthuss et al. 2010). Two explanations have been proposed to explain the pattern: breakpoints occur at fragile sites, or regions resist breakpoints because of functional-constraints models. The functional-constraints model suggests that inversion breakpoints are limited in where they can occur (Richards et al. 2005) because of their potential to disrupt coordinated regulatory domains (Stolc et al. 2004). Alternatively, the fragile-sites model suggests that only particular nucleotide sequences are vulnerable to double-strand breaks. The fragile-sites model can explain the breakpoint distribution across Muller elements among 12 species with modest levels of functional constraint and amounts of breakpoint reusage (von Grotthuss et al. 2010). The structure of DNA domains (topologically associated domains or TADs) inferred from cross-linking proteins associated with DNA (HiC analysis) may play a role in what a fragile site is within the genome (Stadler et al. 2017; Kolesnikova 2018; Kolesnikova et al. 2018), but further analysis of chromatin confirmation in the nuclei of diverse tissues is needed to fully understand whether breakpoints tend to occur at the boundaries of TADs.
Population genomic data are testing hypotheses about how inversion mutations become established in populations. Inversions in many Drosophila species are found in geographic clines or gradients that are reproduced on multiple continents and have been stable over many years (Dobzhansky 1944; Kennington and Hoffmann 2013). Four major hypotheses have been proposed for the establishment of gene arrangements: selective neutrality, the direct or position effect of the inversion breakpoints, hitchhiking with a selectively advantageous allele, or the indirect effect of recombination suppression of an inversion (described in Kirkpatrick and Barton 2006). The direct effect suggests that the inversion mutation generates variation that is selected, either because the breakpoint disrupts the structure of a gene or because it alters how adjacent or nearby genes are expressed. The indirect effect of recombination suppression implies that the inverted region captures sets of alleles that are either free of deleterious mutations, under epistatic selection, or are involved in local adaptation. Position effect may play a role in how selection acts on inversions of different sizes (Corbett-Detig 2016). Population genomic and transcriptomic analysis of inversions suggests that the indirect effect of recombination suppression may be the prime driver for the establishment of new gene arrangements (Corbett-Detig and Hartl 2012; Fabian et al. 2012; Simões et al. 2012; Kennington and Hoffmann 2013; Fuller et al. 2016, 2017b; Kapun et al. 2016a; Lavington and Kern 2017). Multiple genes within inverted regions are targeted by selection either because they affect complex traits (Kennington et al. 2007; Kapun et al. 2016b; Pool et al. 2017), alter protein structure (Fuller et al. 2017b), or modify gene expression (Fuller et al. 2016; Lavington and Kern 2017). Functional studies are necessary to genetically test whether the candidate genes are the evolutionary basis for the establishment of the inversions.
Inversions were important phylogenetic characters to delineate species in many groups of Drosophila (Carson et al. 1992; Levitan 1992; Wasserman 1992), but an active area of current research is investigating the role that inversions may play in the formation and maintenance of Drosophila species barriers. Noor et al. (2001) noted that genes implicated in reproductive isolation were found within the boundaries of fixed inversions between D. pseudoobscura and D. persimilis. It is not clear whether inversions arise prior to the beginning of the speciation process, enhancing the diversification process when populations become allopatric (Fuller et al. 2017a), or whether inversions arise during the speciation process to act as a genomic block to gene flow between the proto-species (Llopart et al. 2005; Lohse et al. 2015). The analyses of genomic data are benefiting from the development of new theory to aid in the interpretation of the pattern and organization of nucleotide diversity (Navarro and Barton 2003; Kirkpatrick and Barton 2006; Charlesworth and Barton 2018). It is beyond the scope of this article to thoroughly review this topic, but the inversions observed within the Muller elements may be part of the repertoire of evolutionary genomic mechanisms involved in forming new species. In a sense, we have come full circle from Muller’s article. We are now addressing how nucleotide and chromosomal changes in Drosophila contribute to our understanding of how populations become species.
Acknowledgments
A great deal of credit goes to the Drosophila pioneers whose incredible intellects provided the framework for molecular evolutionary genetics and comparative genomics. The author thanks Thom Kaufman of Indiana University for his comments that improved the manuscript. A special thanks go to an anonymous reviewer for suggestions to improve the coverage of the in situ hybridization analyses and to expand on what we have learned about the mechanisms of chromosomal evolution from comparative genomics. The appreciation of chromosomal evolution by the author benefited from his support from a grant from the National Institute for General Medical Sciences at the National Institutes of Health R01 GM-098478.
Footnotes
Communicating editor: A. S. Wilkins
Literature Cited
Bateson, W., E. R. Saunders, and R. C. Punnett, 1905 Experimental Studies in the Physiology of Heredity. (Reports to the Evolution Committee of the Royal Society, Report II), pp. 4–99. The Royal Society of London, London.
