


Abstract
CRISPR/Cas9 gene drive (CGD) promises to be a highly adaptable approach for spreading genetically engineered alleles throughout a species, even if those alleles impair reproductive success. CGD has been shown to be effective in laboratory crosses of insects, yet it remains unclear to what extent potential resistance mechanisms will affect the dynamics of this process in large natural populations. Here we develop a comprehensive population genetic framework for modeling CGD dynamics, which incorporates potential resistance mechanisms as well as random genetic drift. Using this framework, we calculate the probability that resistance against CGD evolves from standing genetic variation, de novo mutation of wild-type alleles, or cleavage repair by nonhomologous end joining (NHEJ)—a likely by-product of CGD itself. We show that resistance to standard CGD approaches should evolve almost inevitably in most natural populations, unless repair of CGD-induced cleavage via NHEJ can be effectively suppressed, or resistance costs are on par with those of the driver. The key factor determining the probability that resistance evolves is the overall rate at which resistance alleles arise at the population level by mutation or NHEJ. By contrast, the conversion efficiency of the driver, its fitness cost, and its introduction frequency have only minor impact. Our results shed light on strategies that could facilitate the engineering of drivers with lower resistance potential, and motivate the possibility to embrace resistance as a possible mechanism for controlling a CGD approach. This study highlights the need for careful modeling of the population dynamics of CGD prior to the actual release of a driver construct into the wild.
THE prospect of driving genetically modified alleles to fixation in a population has enticed scientists for >40 years (Curtis 1968; Foster et al. 1972). Potential applications are broad and ambitious, including the eradication of vector-borne diseases such as malaria, dengue, and Zika (Burt 2003; Esvelt et al. 2014; Champer et al. 2016). For example, mosquitoes could be genetically altered such that they can no longer transmit Plasmodium parasites. If these altered alleles could then be spread in a wild population, we could effectively eradicate malaria in humans. Similarly, a gene drive could be used to reverse insecticide resistance in an agricultural pest, or to spread a deleterious allele in an invasive species to drive it toward extinction.
While various strategies for implementing a gene drive have been discussed since the 1970s, all previously proposed mechanisms have faced significant obstacles. Ongoing efforts to transfer the Medea system from flour beetles to other insects have, thus far, fallen short (Chen et al. 2007; Akbari et al. 2014). Underdominance systems have also been developed (Altrock et al. 2010; Akbari et al. 2013; Reeves et al. 2014), but these are slow-spreading systems that require multiple releases of large numbers of male transgenic insects. The use of Wolbachia-mediated strategies have perhaps been most successful (Lambrechts et al. 2015).
The recently proposed CRISPR/Cas9 gene drive (CGD) system now promises a highly adaptable approach for driving genetically engineered alleles into a population, even when those alleles carry substantial fitness costs (Gantz and Bier 2015; Gantz et al. 2015). CGD falls into the category of homing endonuclease gene drives, first proposed by Burt (2003), which consists of a genetic construct (driver allele) encoding an endonuclease that can cleave a genomic target site and then insert itself into that site. CGD uses a Cas9 endonuclease for cleavage that can be engineered to target virtually any 20-bp-long nucleotide sequence in a genome, using a target-specific guide RNA (gRNA). The driver construct is flanked by two homology arms to facilitate its incorporation at the cleavage site during homology-directed repair. In addition, arbitrary payload sequences can be included in the construct that will be transmitted alongside the driver. By converting heterozygotes for the driver allele into homozygotes (Figure 1A), a CGD construct can “cheat” the rules of Mendelian inheritance, allowing for rapid spread of the driver in the population (Burt 2003; Unckless et al. 2015).

(A) CGD mechanism and creation of resistance alleles by NHEJ: In heterozygotes, Cas9 from the driver construct cleaves the wild-type chromosome at the target site. (i) Cleavage repair by homology-directed repair using the sister chromatid as a template will convert heterozygotes for the driver allele into homozygotes. (ii) Break-repair by NHEJ, on the other hand, can create a resistance allele, e.g., by introducing an indel (green) at the target site. (B) Driver dynamics and resistance allele creation rates in our standard model: driver frequency initially grows exponentially in our standard model and the driver fixes after ∼30 generations (assuming resistance does not evolve). As the driver increases in frequency, so does The establishment probability of a newly arisen resistance allele, increases with but is already quite high in generation zero, because resistance alleles present at that time only have to survive a few generations of drift before their relative selective advantage becomes noticeable. The rate of resistance allele creation by de novo mutation, is proportional to the frequency of wild types and thus decreases as the driver becomes more frequent. The rate of resistance allele creation by NHEJ, is proportional to the frequency of driver/wild-type heterozygotes and is thus maximal for intermediate driver frequencies. (C) Probability that resistance establishes from the SGV as a function of the initial copy number, of resistance alleles present when the driver is introduced. The three curves show our standard model (black), a scenario in which the driver cleaves at only 50% efficiency (blue), and one where driver cost is 10 times smaller (red).
As a proof of principle, Gantz and Bier (2015) showed that CGD was highly effective at converting heterozygotes for a driver allele into homozygotes in a laboratory cross of Drosophila melanogaster. In their experiment, insects homozygous for a CGD construct that disrupts the X-linked yellow gene were crossed to wild-type insects, resulting in 254 of 261 daughters with the disrupted yellow phenotype (Gantz and Bier 2015). Since this phenotype is recessive, CGD must have disrupted the wild-type allele in these females. In another study, a similar construct conferring resistance to Plasmodium falciparum was successfully introduced into a laboratory population of Anopheles mosquitoes (Gantz et al. 2015). A third study recently generated a CGD targeting a mosquito fertility gene for population suppression (Hammond et al. 2016). Several theoretical studies have further shown that gene drives can, in principle, spread very rapidly in a population, even when the driver allele carries a substantial fitness cost (Burt 2003; Sinkins and Gould 2006; Deredec et al. 2008; Gould 2008; North et al. 2013; Burt 2014; Unckless et al. 2015; Drury et al. 2016).
Despite these initial results, it is still unclear whether CGD can actually lead to fixation of the driver allele in a large natural population because of several factors that might influence its population dynamics. Arguably the most critical problem is the evolution of resistance against the drive (Burt 2003; Deredec et al. 2008, 2011; Esvelt et al. 2014; Bull 2016; Noble et al. 2016b). Such resistance could arise, for instance, through alleles at the target locus that cannot be converted by CGD because they are not recognized by the driver’s gRNA. In fact, a single nucleotide mutation in the 3-bp-long PAM motif of the target sequence will typically suffice to create such a resistance allele. Most indels within the target will likely create a resistance allele as well. Importantly, the driver itself is expected to produce its own resistance alleles when cleavage is repaired by end joining mechanisms such as nonhomologous end joining (NHEJ) or microhomology-mediated end joining, rather than homologous recombination, and such resistance alleles have already been observed in several experiments (Gantz and Bier 2015; Gantz et al. 2015; Hammond et al. 2016; Wang et al. 2016).
If resistance alleles are less deleterious than the driver allele—as will likely be the case for many types of resistance alleles—natural selection will favor these alleles over the driver. As a result, they will rise in frequency and should eventually replace the driver. Thus, even though a driver may initially spread to high frequency in the population, its ultimate fate will depend on whether resistance alleles have emerged during this process. While several strategies have been proposed for reducing resistance potential; including the use of multiple gRNAs, the targeting of essential genes, daisy chains, or poison-antidote systems (Esvelt et al. 2014; Champer et al. 2016; Noble et al. 2016a); it remains to be seen how well these approaches can actually work in practice.
It is clear that any informed decision about the potential consequences and risks of releasing a CGD construct into a wild population requires that we first understand the dynamics of this process on the population level, including potential resistance mechanisms. Here, we build on previous theoretical results to devise a comprehensive population genetic model of CGD, which allows us to quantitatively study the population dynamics of such systems, calculate the probability that resistance evolves, and predict how resistance alleles will interfere with the spread of a driver construct.
Results
Population genetic model of CGD
Our model for studying the population dynamics of CGD is based on the original drive system proposed by Gantz and Bier (2015), which hearkens back to Burt (2003). We consider a single locus with three types of alleles: wild type (0); driver (d); and resistance (r), where we define a resistance allele to be any allele that cannot drive and also cannot be converted into a functioning driver by the CGD machinery (complete resistance). The driver cleaves the wild-type allele in heterozygous driver/wild-type embryos at rate In a fraction of cases, cleavage repair creates a resistance allele when NHEJ introduces an indel at the target site. In reality, such resistance alleles can be created by any repair mechanism that changes the target sequence without incorporating the functional drive machinery (e.g., microhomology-mediated end joining or the incorporation of a loss-of-function driver construct) (Champer et al. 2016), but we refer to this entire class as NHEJ for simplicity. Resistance alleles can also arise by de novo mutation in wild-type alleles at rate specifying an effective rate that includes all possible mutations creating resistance. We set the fitness of wild-type homozygotes to whereas all other genotypes can carry arbitrary fitness cost, The driver is initially introduced into the population in generation at frequency We model a large, panmictic population with variance effective population size and census population size
Note that there could generally also exist other types of alleles at the locus. For example, resistance alleles that arise by de novo mutation could be distinguishable from those that arise by NHEJ, or resistance alleles that were already present as natural variation in the population. Depending on the specific drive scenario, these different resistance alleles could carry different costs. For simplicity, we combine all resistance alleles into a single class with the same fitness costs in our model.
We will typically perform our numerical analyses using a “standard” model, for which we vary individual parameters independently, while keeping the other parameters constant. This will allow us to dissect how each individual parameter affects the general behavior of the model. Our standard model assumes a scenario in which cleavage is efficient, as one would likely aim to design a driver this way. We further assume that resistance alleles carry no cost, which we will relax later. Driver alleles, by contrast, carry a substantial cost that is codominant, In those analyses where both the driver and the resistance allele carry a cost, we will assume that these costs are codominant to each other, We further set and Both are likely conservative choices with respect to the actual rates at which resistance alleles arise in many systems of interest, such as insects. In fact, NHEJ rates are probably several orders of magnitude higher in most systems, in which case the evolution of resistance from NHEJ will be practically assured (as we will show below). We still choose a very low value of for our standard model both to be able to study systems in which NHEJ has been intentionally suppressed and because it is the parameter space where resistance is not inevitable. We finally set for simplicity, and introduce driver alleles into the population at frequency Table 1 provides a summary of the different parameters and their default values in our standard model.
Description of all model parameters
| Parameter | Standard model | Description |
|---|---|---|
| 10−5 | Introduction frequency of driver allele | |
| 0.9 | Cleavage rate in driver/wild-type heterozygotes | |
| 10−6 | Fraction of cleavage events resulting in resistance allele by NHEJ | |
| 10−8 | Rate at which wild-type alleles mutate into resistance alleles | |
| 0.1 | Fitness cost of driver/wild-type heterozygotes | |
| 0.1 | Fitness cost of driver/resistance heterozygotes | |
| 0.0 | Fitness cost of resistance/wild-type heterozygotes | |
| 0.2 | Fitness cost of driver homozygotes | |
| 0.0 | Fitness cost of resistance homozygotes | |
| 106 | Variance effective population size | |
| 106 | Census population size |
Deterministic frequency dynamics
We and others have previously shown that these dynamics can already produce rich behavior in the absence of resistance (Burt 2003; Deredec et al. 2008; Unckless et al. 2015). Possible outcomes can include the fixation of the driver, loss of the driver, and both stable or unstable equilibria, depending on the cleavage rate, the fitness costs of the driver allele, and and the initial frequency at which the driver is introduced into the population. Briefly, in scenarios with high cleavage rate and small fitness costs, the driver will usually fix even when introduced at low frequency, whereas for low cleavage rates and high fitness costs the driver may not be able to invade at all. Intermediate scenarios can give rise to equilibria that are usually unstable, but can be stable if cleavage rates are small and fitness costs are low and recessive. For the remainder of this study, we will focus only on cases where, in the absence of resistance, the driver allele can go to fixation.
Origin of resistance alleles
Establishment of resistance alleles
The overall likelihood that resistance evolves will depend on the supply of resistance alleles by the individual mechanisms, and the probability that a new resistance allele is not lost to drift when it is still rare (its so-called establishment probability). Before we discuss the individual contributions of resistance from SGV, de novo mutation, and NHEJ, we will first calculate these establishment probabilities in our model.
Resistance from the standing genetic variation
The probability that resistance evolves from alleles present as SGV will depend on the expected frequencies of such alleles in the population in generation and their establishment probabilities provided by Equation 11. We can use existing theory for the well-studied problem of evolutionary rescue from SGV (Hermisson and Pennings 2005; Orr and Unckless 2008) for calculating this probability. In particular, we will use the analytical framework of Hermisson and Pennings (2005) and consider the introduction of the driver to be the environmental shift, which then renders a previously neutral or deleterious resistance allele as beneficial as mean population fitness declines when the driver spreads. We assume that prior to introduction of the driver, resistance alleles arise at rate per generation per haploid wild-type genome, and that they are evolving under mutation-selection-drift balance, specified by fitness costs and We define to be twice the population-level mutation rate toward resistance alleles. After introduction of the driver, the fitness effects of resistance alleles are given by as defined in Equation 8.
Figure 2 shows as a function of in our standard model, while simultaneously varying the cleavage rate (Figure 2A), the fitness cost of the driver allele (Figure 2B), or the fitness cost of resistance (Figure 2, C and D). Interestingly, as the cleavage rate increases, so does the probability of resistance from SGV. This is because higher leads to a faster spread of the driver, and resistance alleles present in the SGV will thus experience their net fitness advantage sooner; increasing their chances of surviving drift. Generally, as long as resistance alleles provide a net fitness advantage over the driver, evolution of resistance from the SGV is practically assured whenever whereas it remains unlikely for This is consistent with the general result that the probability of adaptation to an environmental shift using alleles from the SGV should depend only weakly on the selective advantage of these alleles in the new environment, but should be mostly determined by how many such alleles were present when the environment changed, which is a function of and the selective disadvantage of these alleles prior to the change (Hermisson and Pennings 2005).
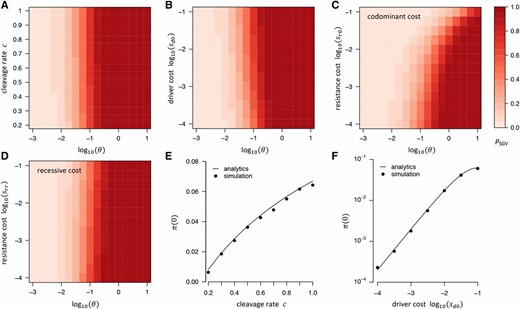
Probability that resistance evolves from SGV in our standard model. (A) as a function of and cleavage rate: higher c increases by increasing (see panel E). (B) as a function of and driver cost: higher driver costs also increases by increasing (see F). (C) when resistance alleles carry a codominant fitness cost (D) Same as (C), but assuming recessive fitness costs Higher fitness cost of resistance alleles lead to lower only if fitness costs are codominant, whereas recessive costs have almost no noticeable effect. To vary in (A–D), we always varied while keeping constant. (E) Establishment probability as a function of cleavage rate: increases with because resistance alleles can experience their net fitness advantage faster when the driver spreads faster. Our analytics (line) agree well with numerical simulations (●) under a Wright–Fisher model with conversion, selection, and drift. (F) Same as (E) but varying driver costs instead of cleavage rate.
If resistance alleles carry a fitness cost themselves, this lowers the probability that resistance evolves from the SGV. However, this effect is much more pronounced when fitness costs are codominant than when they are recessive, consistent with the fact that even a deleterious allele can still reach a noticeable frequency in the SGV as long as its costs are only recessive. In our model, even for substantial recessive costs we still find to be practically indistinguishable from the cost-free scenario.
Resistance from de novo mutation
Note that is defined in terms of the census population size because the overall supply of resistance mutations depends on how many wild-type genomes are present in the population overall, not the effective population size. If the effective population size differs from the census size, this will not affect but will change the establishment probability of a new resistance allele initially present in just a single copy in the population, specified by Equation A1. However, this change is often well approximated by where technically refers to the so-called “fixation” effective population size (Otto and Whitlock 1997). In that case, simply cancels out in the products We always set in our standard model for simplicity.

Probability that resistance evolves from de novo mutation or NHEJ in our standard model. (A) as a function of and cleavage rate: higher cleavage rate decreases because it leads to faster fixation of the driver, providing less time for resistance alleles to arise during its spread. (B) as a function of and driver cost: higher driver costs increase by increasing throughout the drive. (C) as a function of and (codominant) resistance costs: resistance costs have only very little effect on until they become comparable to the cost of the driver. To vary in (A–C), we always varied while keeping constant. (D) as a function of and cleavage rate, which has very little effect on because the overall number of resistance alleles created by NHEJ throughout the spread of the driver is proportional to the overall number of cleavage events that occur during its spread, which does not depend strongly on c (a driver always has to produce roughly 2N cleavage events over the course of its spread to become fixed in the population). (E) as a function of and driver cost: higher driver costs increase by increasing similar to their effect on (D) as a function of and (codominant) resistance costs, which have only very little effect on To vary in (D–F), we always varied while keeping constant.
When comparing with for the same set of model parameters, we find that is generally higher than Hence, resistance is more likely to evolve from resistance alleles already present when the driver is introduced, than from de novo mutation after its introduction. The only exception would be a scenario of a very inefficient drive (small c), in which case it would take a long time until the driver becomes prevalent in the population, reducing while at the same time providing more time for de novo resistance alleles to emerge.
Resistance from NHEJ
Given the similarity between the NHEJ and de novo mutation scenarios, it is not very surprising that the key parameter determining the likelihood of resistance in the NHEJ scenario is the product similar to the parameter in the de novo scenario. Whenever becomes on the order of one or larger in our model, evolution of resistance from NHEJ becomes likely.
In contrast to the de novo mutation scenario, the cleavage rate has very little impact on This can be understood from the fact that the overall number of resistance alleles that arise by NHEJ before driver fixation is proportional to the overall number of cleavage events that occur, which is independent of the actual cleavage rate (as long as selection against the driver does not yet have a strong effect on its spread). Successful fixation, on average, always requires conversion events throughout this process, regardless of the actual conversion rate. Fitness costs of the driver, however, can have a strong impact on with higher fitness costs leading to lower by reducing — the same effect they had in the de novo mutation scenario.
Total resistance probability
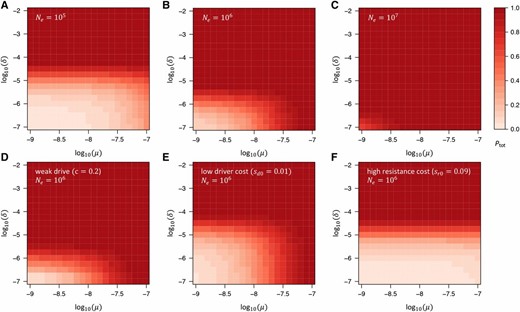
Total probability that resistance evolves in our model. (A–C) as a function of and in our standard model, assuming three different effective population sizes (A) (B) and (C) Larger values of increase the probability of resistance, yet even in the scenario with low values of are still required if resistance from NHEJ is to be prevented. (D–F) as a function of and for fixed in three limiting cases of our standard model: (D) scenario of a very weak drive with cleavage rate Comparison with (B) shows that this has almost no effect on (E) Scenario with low driver costs, While this allows for larger values of the dependence on does not change much, since remains largely unaffected by the driver costs (compare with Figure 2B). (F) Scenario in which resistance alleles carry (codominant) fitness costs almost as large (90%) as those of the driver, In this case, resistance is unlikely to evolve from SGV or de novo mutation. However, it is still likely to evolve by NHEJ unless
Relaxing model assumptions
Recessive and dominant driver costs:
So far, we have assumed that driver fitness costs are codominant. If they are recessive, the driver can initially rise in frequency faster, as driver heterozyogtes carry no costs. Conversely, if they are dominant, this will slow down the initial spread of the driver. In our standard model, the differences in driver frequency trajectories between recessive, codominant, and dominant driver fitness costs are only marginal (Figure 5A). This is because driver dynamics are dominated by conversion, rather than selection, which only becomes important once driver fitness costs are of the same order as the cleavage rate
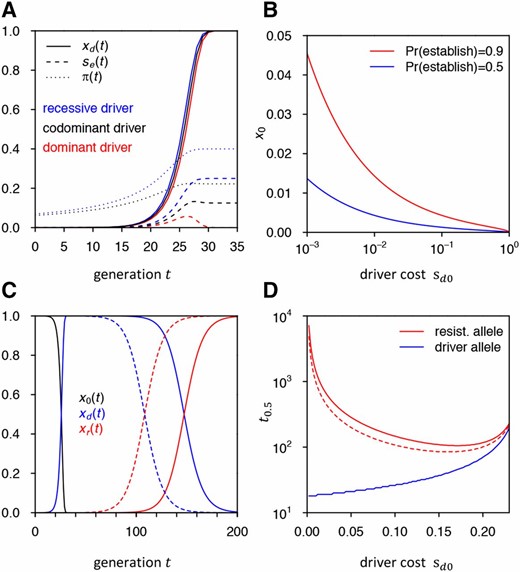
(A) Driver allele frequency trajectories, effective fitness advantage of resistance allele, and establishment probabilities under recessive, codominant, and completely dominant driver fitness costs in our standard model. is not visible in the dominant scenario as it is very close to zero. (B) Threshold frequencies at which a resistance allele needs to be present to have the given establishment probability in the case of a completely dominant driver with cost (C) Replacement of driver by resistance allele. Shown is the deterministic frequency trajectory of a driver allele in our standard model and its replacement by a resistance allele from the SGV that was present as a single copy (solid line) or 100 copies (dashed line) when the driver was introduced. (D) Time until resistance allele and driver allele reach 50% population frequency in (C) when varying driver cost Once driver cost reaches in our model, the driver will be outpaced by the resistance allele before it can reach 50%.
Dominance of the driver can nevertheless have a strong impact on the probability that resistance evolves, due to its effects on the fitness of driver/resistance heterozygotes. Resistance alleles that are still rare will predominantly be present in driver/resistance heterozygotes once a driver is frequent. If driver costs are recessive, will then be larger than in the codominant case, increasing and thus and By contrast, if driver costs are dominant, driver/resistance heterozygotes will have no fitness advantage over driver homozygotes. Once wild-type alleles have been completely displaced by the driver, only resistance homozygotes would then have a fitness advantage. Unfortunately our approach for calculating establishment probabilities based on Equation 10 fails here because it does not take resistance homozygotes into account.
Frequent NHEJ regime:
High introduction frequency:
Our simulations show that varying the introduction frequency of the driver has almost no noticeable effect on the total probability that resistance evolves, which is due to two competing effects: Increasing the introduction frequency will increase and thus because resistance alleles present in the SGV will experience their fitness advantage faster. At the same time, this will also lead to faster fixation of the driver, leaving less time for de novo resistance mutations to occur, which will decrease The two effects approximately cancel out. will generally not depend much on the introduction frequency, as long as because most resistance alleles produced by NHEJ arise when the driver is at intermediate frequency. Note that changing can still have a noticeable impact on the fixation time of the driver. For example, while it takes the driver generations to reach frequency 0.5 in our standard model with this only takes generations when initially introduced at frequency
Varying population size:
We have so far assumed that population size remains constant over time. This assumption is likely violated in many systems. Insect populations, for instance, can show dramatic fluctuations in population size over just a few generations (Berryman 2002). In temperate areas, winters can result in population crashes, followed by rapid increase during the growing season. Management practices for pests, such as insecticide application, can also change population sizes dramatically, as could CGD itself if the goal is to spread a harmful allele in the population.
To our knowledge, there are no general analytical solutions for mutation-selection-drift balance under arbitrary demography scenarios. Calculation of will therefore typically rely on numerical simulations to infer the expected frequency of resistance alleles in the SGV. However, such distributions could be easily obtained from Wright–Fisher simulations under any given demographic model, allowing for numerical estimation of
Data availability
Our theory for modeling CGD dynamics and calculating resistance probabilities is implemented in a C++ command line program. This program takes as input the parameter values of the given model: For the given parameters, it then calculates the driver allele frequency trajectory under a deterministic model, specified by Equations 1–4 in the absence of resistance; the rate at which resistance alleles are expected to arise by de novo mutation; the rate at which they are expected to arise by NHEJ; the effective selection coefficient of resistance alleles; and the establishment probability of a resistance allele arising in a single copy in generation Results are provided for each generation The program also calculates the individual resistance probabilities and Executables, source code, and documentation for this program are available at http://messerlab.org/resources/.
Discussion
The prospect of using CGD for genetic manipulation of entire populations has sparked both optimism and deep concern. While this technology could help us tackle some of the most pressing public health challenges, such as vector-borne diseases, there are also serious doubts regarding our ability to control a gene drive once released into a wild population. In this study, we showed that resistance will almost inevitably evolve against standard CGD approaches, most likely due to resistance alleles produced by the driver itself when cleavage is repaired by NHEJ-type mechanisms.
We focused in our analyses on population parameters we feel are appropriate for many proposed target systems of CGD, such as insect populations. Estimates of single nucleotide mutation rates tend to be in the range of in such organisms (Haag-Liautard et al. 2007; Keightley et al. 2009, 2014), and a single mutation in the PAM motif probably already suffices to create a resistance allele against CGD (Cong et al. 2013). In addition, indels should typically occur within the 20-bp-long target sequence of a CGD construct at rates comparable to single nucleotide mutation rates (Schrider et al. 2013). In our model, we showed that resistance from SGV and de novo mutation is then likely whenever compatible with estimates of effective population sizes in many insect populations (Leffler et al. 2012). In fact, the values of relevant for CGD in natural insect populations may often be much larger than these values of long-term obtained from levels of neutral diversity, which tend to be dominated by historical bottlenecks and seasonal population crashes (e.g., caused by the winters in a temperate region) (Hartl and Clark 1997; Berryman 2002; Karasov et al. 2010; Messer and Petrov 2013). During warm seasons, insect population sizes can easily reach billions and more, and resistance alleles will inevitably arise during these times when the supply of resistance alleles is not limited by mutation. If enough generations occur before the next population collapse, resistance alleles could reach a sufficiently high frequency to persist throughout the collapse (Wilson et al. 2014). In such scenarios, resistance probabilities may then actually depend on the specific time during the year a driver is released.
Yet even in much smaller populations, resistance is still likely to evolve from the repair of driver-induced cleavage events by NHEJ, unless the NHEJ rate can be limited to below This poses a very low boundary for many natural populations, which should be quite difficult to achieve in practice, given that NHEJ rates observed in previous CGD experiments were typically on the order of 1% or larger (Gantz et al. 2015). In conclusion, our results suggest that resistance should evolve almost inevitably against standard CGD approaches in most natural populations, unless NHEJ can be effectively suppressed, fitness costs of the driver are completely dominant, or these fitness costs are on par with those of resistance alleles.
Our modeling framework also allows us to study and compare resistance probabilities under specific CGD strategies (Esvelt et al. 2014). One proposed strategy is to disrupt an existing gene (e.g., a gene involved in insecticide resistance). In this case, cleavage repair by NHEJ could still achieve the intended result—a disrupted copy of the gene. Since these alleles should carry similar fitness costs as the driver, they are not likely to rise in frequency. However, resistance may still evolve if some mutations change the target sequence without actually disrupting the gene, or if the ability to drive itself is already associated with some fitness costs, as will likely be the case if off-target effects of the driver have not been completely suppressed (Fu et al. 2013; Anderson et al. 2015; Zhang et al. 2015). Another proposed strategy is the insertion of a new gene (e.g., a gene that prevents mosquitoes from transmitting malaria). If the target site lies in a nonfunctional region, NHEJ could then create cost-free resistance alleles, rendering the evolution of resistance highly probable if the driver carries a fitness cost.
Several CGD strategies have already been proposed specifically to combat resistance (Burt 2003; Deredec et al. 2008, 2011; Esvelt et al. 2014; Noble et al. 2016a,b). One such strategy is to include multiple gRNAs in the construct to target different sites. The probability that resistance evolves should then remain very low in our model, due to the large number of mutations required for an allele that is resistant to all gRNAs. Yet in practice such a strategy will likely add complexities that require more sophisticated modeling, such as allele classes with intermediate levels of resistance and possibly intermediate fitness costs. Resistance could then still evolve via a succession of intermediate steps. Another approach, often proposed in concert with multiple gRNAs, is the targeting of a conserved region of an essential gene (Esvelt et al. 2014). The idea being that individuals carrying NHEJ alleles will then have very low fitness—even as heterozygotes—and therefore will be quickly purged from the population. However, this strategy may not be appropriate in all cases. For example, if the goal is to knock out an insecticide-resistance gene, then the target gene will be predetermined. Furthermore, NHEJ may still occasionally repair sequences in such a way that renders them resistant to further drive, but without introducing significant fitness consequence. Our analytical framework can accommodate such an approach if we create two categories of NHEJ alleles: lethal and viable. The lethal NHEJ alleles can simply be ignored, while the viable NHEJ alleles can be modeled the same way as in our original model, but arising at a lower effective rate. Note that even if the proportion of such viable NHEJ among all NHEJ alleles is only 0.1–1%, as long as overall NHEJ rates are high enough, resistance will still likely evolve in our model.
All of these approaches are based on the paradigm that resistance is always an impediment for practical CGD applications, which needs to be averted using more elaborate CGD approaches. Yet maybe this is not always true. In fact, there may be scenarios in which the ensured evolution of resistance could actually provide a valuable safety mechanism for controlling a driver, while still allowing the approach to effectively achieve its goal. This is because even when resistance alleles will ultimately replace the driver allele, this replacement will be driven by natural selection, which can be much slower than the initial rise of the driver. In our standard model, for instance, it takes >100 generations until resistance alleles reach 50% frequency even when they were already present when the driver was introduced, whereas the driver reaches 99% frequency in <30 generations (Figure 5C). This lag time depends on the net selective advantage of the resistance allele over the driver and will be even longer for lower driver costs (Figure 5D). Short-term population transformations can thus still be attained. Subsequent CGD constructs could be designed and released that specifically target resistance alleles, based on regular surveys of genetic variation at the target site—a process that may be more effective and safe than the use of the CGD system with multiple gRNAs (Esvelt et al. 2014). Our model provides a quantitative framework for predicting the population dynamics of driver and resistance alleles in such scenarios and can shed light on how drive parameters need to be tuned to orchestrate key features of these dynamics, such as the initial rate of spread of the driver, the maximum frequency it can attain in the population, and the time it will take until resistance alleles will replace the driver. Note that our theory also allows the assessment of strategies involving the intentional release of resistance alleles for controlling a CGD approach.
It is clear that there is a need for more detailed modeling of CGD on several fronts. For example, we assumed that resistance is a binary trait, yet resistance levels could depend on number, type, and location of mutations in the target site (Cong et al. 2013). Expression of the driver in the germline, instead of embryos, could alleviate some of the recessive fitness costs of the driver in converted individuals (Deredec et al. 2008). Furthermore, resistance alleles may be created if homology-directed repair inserts the driver construct, but introduces errors that prevent it from driving. We also limited our study to resistance at the target site, even though trans-resistance might be common. Target species may harbor natural variation for Cas9 expression levels or may produce peptides or RNA that silences the CRISPR machinery (Bondy-Denomy et al. 2013). The possibility of all these other resistance mechanisms suggests that our estimates for the probability that resistance evolves are likely to be conservative. Finally, we have not addressed CGD strategies in which an allele is spread with the intention to actively diminish a population. While our model does provide a framework for analyzing such strategies when provided with an explicit model for how the spread of the suppression allele will affect population size, we still know very little about how an actual population would react to such an approach.
Throughout this analysis we remained purposefully agnostic to the potential benefits and risks of this potent biological technology. We do, however, acknowledge the need for extensive discussion among scientists, policy makers, and the public before any release of a CGD into a wild population is ever considered (Esvelt et al. 2014; Oye et al. 2014; Akbari et al. 2015). It is our hope that this work facilitates such discussion.
Appendix A: Calculation of Establishment Probabilities
Uecker and Hermisson (2011) developed a framework for calculating the establishment probability of a new mutation when its selection coefficient is time dependent. Their theory can be directly applied to our scenario if we consider a resistance allele to be a new mutation with time-dependent selection coefficient According to equation 16 in Uecker and Hermisson (2011), the establishment probability of such a resistance allele when initially present in a single copy at time is then given by
Importantly, all the above integrals are defined over continuous time, whereas in our Wright–Fisher-type model, generations are discrete and values for are only defined for Before we can estimate establishment probabilities in our discrete model, we first have to map these integrals onto sums over discrete generations. In the following, we will always use to denote discrete variables (generations), whereas will denote continuous variables.
Appendix B: Frequent NHEJ Regime
Our dynamical model for the allele frequencies described by Equations 1–4 assumed that the rates at which resistance alleles are created by mutation and NHEJ are small enough that we can neglect their contribution to changes in allele frequencies between generations. This may no longer be the case if NHEJ becomes more frequent. Extending our dynamical model to such a scenario is straightforward. In this case, the dynamics described by Equations 1–4 become
Acknowledgments
We thank Anthony Long for suggesting the nonhomologous end joining resistance concern and Jackson Champer, Brittny Smith, and members of the Messer and Clark laboratories for helpful discussions. This work was supported by the National Institutes of Health grants R01 GM-064590 to A.G.C. and K99 GM-114714 to R.L.U, and funds from the College of Agriculture and Life Sciences at Cornell University to P.W.M.
Footnotes
Communicating editor: J. Hermisson
