


Abstract
The genetic consequences of population bottlenecks on patterns of deleterious genetic variation in human populations are of tremendous interest. Based on exome sequencing of 18 Greenlandic Inuit we show that the Inuit have undergone a severe ∼20,000-year-long bottleneck. This has led to a markedly more extreme distribution of allele frequencies than seen for any other human population tested to date, making the Inuit the perfect population for investigating the effect of a bottleneck on patterns of deleterious variation. When comparing proxies for genetic load that assume an additive effect of deleterious alleles, the Inuit show, at most, a slight increase in load compared to European, East Asian, and African populations. Specifically, we observe <4% increase in the number of derived deleterious alleles in the Inuit. In contrast, proxies for genetic load under a recessive model suggest that the Inuit have a significantly higher load (20% increase or more) compared to other less bottlenecked human populations. Forward simulations under realistic models of demography support our empirical findings, showing up to a 6% increase in the genetic load for the Inuit population across all models of dominance. Further, the Inuit population carries fewer deleterious variants than other human populations, but those that are present tend to be at higher frequency than in other populations. Overall, our results show how recent demographic history has affected patterns of deleterious variants in human populations.
PREDICTIONS about the consequences of a small population size on genetic variation are fundamental to population genetics (Kimura et al. 1963; Ohta 1973; Charlesworth 2009). Small populations are more affected by drift than are large populations; therefore, small populations are predicted to have lower genetic diversity (Kimura et al. 1963). Additionally, natural selection acting against deleterious alleles is predicted to be less efficient in small populations (Ohta 1973). Finally, the genetic load, defined as the reduction in mean fitness in a population caused by deleterious variation relative to a mutation-free population (Morton et al. 1956; Kimura et al. 1963) (see our Equation 1), is predicted to be larger in small populations (Kimura et al. 1963).
With the recent advent of genome-wide sequencing data from humans, it has become possible to test these predictions in human populations. Indeed, numerous studies have compared the patterns of deleterious variation across human populations (Boyko et al. 2008; Fu et al. 2014; Lohmueller 2014a; Simons et al. 2014; Do et al. 2015; Henn et al. 2015, 2016; Simons and Sella 2016). Most of these studies have focused on genetic consequences of the bottlenecks, i.e., rapid large decreases in population sizes, that all non-African populations went through during the Out-Of-Africa (OOA) dispersal. One challenge with this endeavor is that there is no direct way to measure genetic load from genetic variation data (Lohmueller 2014b). Rather, summary statistics that are proportional to genetic load under specific models can be calculated and compared. This is challenging, because different statistics, which make different assumptions about how mutations impact genetic load, can show different qualitative trends. For example, many studies have shown that the European population (Boyko et al. 2008; Lohmueller et al. 2008; Fu et al. 2014; Simons et al. 2014; Do et al. 2015) and other non-African populations (Henn et al. 2016) carry more homozygous deleterious genotypes compared to the African populations (Lohmueller 2014a; Henn et al. 2015) and thus may have a higher genetic load assuming mutations have a recessive effect.
However, studies by Fu et al. (2014), Lohmueller (2014b), Simons et al. (2014), Do et al. (2015), and Henn et al. (2015) reached different conclusions about the extent to which genetic load varies across populations and also whether selection is less efficient in small populations. For example, a recent study by Do et al. (2015) found no difference between the non-African and African 1000 Genomes populations using the RX/Y statistic, which is monotonically related to the difference in number of derived alleles between the two populations. In line with this finding, Simons et al. (2014) found no significant difference in the number of derived alleles per genome between individuals of European descent and individuals of African American descent. Based on this observation, Simons et al. (2014) concluded that Europeans and African Americans carry the same additive genetic load. They furthermore concluded, using theoretical arguments and simulations, that genetic load is not affected much by recent population size changes. On the other hand, other studies found slightly, but significantly, more derived deleterious alleles per individual in the European population than in African populations (Boyko et al. 2008; Fu et al. 2014) implying that the OOA bottleneck has led to a small increase in genetic load in the European population. Further, theoretical work using realistic models of demographic history have suggested that non-African populations have a slightly higher additive genetic load compared to African ones (Gravel 2016). Similarly, in a recent study of seven populations, Henn et al. (2016) reported that the non-African populations on average harbor slightly more derived alleles among alleles with large Genomic Evolutionary Rate Profiling (GERP) scores. Furthermore, Henn et al. (2016) reported a small, but significant, difference in load across the seven populations under an additive effect model when load is estimated using selection coefficients approximated based on GERP scores.
The consequences of smaller population sizes on the efficacy of selection in humans has also received much attention (Gravel 2016). This topic was first investigated in a study of exome data from 15 African Americans and 20 Europeans (Lohmueller et al. 2008). That study showed that the proportion of SNPs that are nonsynonymous, and thus likely deleterious, is larger in Europeans than in African Americans. This observation was initially interpreted as being, in part, due to less efficient selection during the OOA bottleneck (Henn et al. 2016) combined with the recent influx of nonsynonymous mutations during the recovery of the bottleneck. Several later studies have come to similar conclusions (Fu et al. 2014; Lohmueller 2014a; Henn et al. 2016). In contrast, based on their results about genetic load described above, Do et al. (2015) concluded the efficacy of selection was not reduced due to the reduced population size during the OOA bottleneck. A recent review by Lohmueller (2014a) tried to reconcile the different observations and conclusions by pointing out that different studies have focused on different definitions of the efficacy of selection and used different metrics to quantify it. The review ends by calling for descriptions of empirical patterns of deleterious mutations in other human populations than Europeans and Africans with different population size histories to shed further light on the questions about the effect of small size on selection and load. Motivated by this, we here analyze patterns of deleterious mutations in the Greenlandic Inuit (GI) population based on exome sequencing data from 18 GI individuals.
The GI settled Greenland within the last 1000 years (Gulløv 2004; Raghavan et al. 2014) and a previous study has shown that their ancestors split from the closest large old-world population, the Han Chinese (CHB) population, some ∼23,000 years before present with only a limited amount of subsequent gene flow (Fumagalli et al. 2015). The study also showed that the GI population has a very small effective population size (Fumagalli et al. 2015). This suggests that the GI population has likely been small and isolated for a long period of time after the OOA dispersal took place. Analyses of the GI population could therefore contribute to understanding patterns of deleterious variation and genetic load in small populations [e.g., Casals et al. (2013) and Lim et al. (2014)].
In this paper, we first show that the GI population is one of the historically smallest human populations in the world and therefore represents a valuable contribution to the study of deleterious variation in human populations. We compare different proxies for genetic load between the GI and other large populations, as well as investigate several additional measures related to efficacy of selection and show that for recessive models, the GI have a substantially increased genetic load relative to other human populations. For additive models, however, we detect, at most, a subtle increase in the number of derived deleterious alleles in the GI relative to other populations. Forward simulations under realistic models of demography and selection confirm these findings. Across a wide range of models in the simulations, the GI show an elevated additive genetic load relative to other human populations, even when the number of derived deleterious alleles are approximately equal, suggesting that this summary statistic may lack power to detect subtle increases in genetic load, particularly when it is not possible to clearly differentiate neutral variants from deleterious ones. Finally, we explore the consequences of our findings in the context of disease association studies.
Materials and Methods
Data
We based all of our analyses of the GI population on the high-depth whole exome sequencing data from Moltke et al. (2014). This dataset consists of nine Greenlandic trios; however, we restricted our analyses to data from the 18 unrelated parents to avoid any effect of relatedness among individuals. The GI data were both analyzed alone and together with other datasets including: (1) whole exome sequencing data from 18 unrelated Utah residents with Northern and Western European ancestry (CEU), 18 Han Chinese individuals from Beijing (CHB), and Yoruban individuals from Ibadan, Nigeria (YRI) from the 1000 Genomes project (McVean et al. 2012); (2) an exome dataset which includes Mayans, Mbuti, and Cambodians from Henn et al. (2016); and (3) called genotypes from the 1000 Genome low-coverage data. The analyzed datasets are described in detail below.
GI dataset
This dataset consists of high-depth exome data from 18 GI individuals. To generate it, Moltke et al. (2014) performed SNP and indel calling followed by genotype calling for the extended exome target region, spanning 75 MB, captured using Agilent SureSelect from the 18 Greenlandic samples using Samtools version 0.1.18 (Li et al. 2009). Reads with a mapping quality lower than 30 as well as bases with a base quality lower than 20 were removed. SNPs were called using standard settings and genotypes were called based on the highest genotype likelihood. We used VCFtools version 0.1.11 (Danecek et al. 2011) for filtering. We removed SNVs where all individuals were heterozygous, which are likely genotyping errors. In addition, we removed sites with sequencing depth lower than 10 for all individuals or higher than 500 that likely belong to repetitive regions. The resulting dataset comprise 133,808 SNVs within the exome. This dataset was used solely for identifying absolute numbers of SNVs across a number of functional categories and for inferring population size changes though time.
Three combined exome datasets
These three datasets each consists of exome data from the GI and the 1000 Genomes populations. Specifically, the GI exomes were merged with 18 exomes from the CEU population, 18 exomes from the CHB, and 18 exomes from the YRI, respectively. To generate the combined exome datasets, we performed joint SNP and genotype calling for the exome data from both populations using ANGSD (Korneliussen et al. 2014) under the Samtools (Li et al. 2009) genotype likelihood model based on the highest genotype likelihood. Reads with a mapping quality lower than 30 and bases with a base quality lower than 20 were removed. SNVs were called using a likelihood ratio test (Korneliussen et al. 2014) with a P-value cutoff of 10−6 and genotypes were called based on the highest genotype likelihood. We required a minimum depth of 10 for calling genotypes and removed sites with missing genotypes and sites which were triallelic when including the ancestral allele. This dataset comprises 93,047 SNVs for the GI-CEU populations, 90,528 SNVs for the GI-CHB populations, and 158,356 SNVs for the GI-YRI populations. Site frequency spectrum (SFS) comparison of the 1000 Genomes genotype calls from the low-depth data and our genotype calling from the exome data for the same individuals revealed no differences in the SFS (Supplemental Material, File S1, Figure S7), suggesting that it is appropriate to merge the low-coverage and high-depth data for later analyses (see below). The datasets were polarized using the chimp allele, which has been determined reliably using UCSC multiple alignment for many species, available within the SeattleSeq 138 annotation. For each pairwise comparison, only the sites that are polymorphic in at least one of the populations were used.
Dataset from 1000 Genomes low-depth whole genome sequencing
This dataset consists of the 1000 Genomes population samples (McVean et al. 2012): Finns from Finland (FIN), Peruvians from Lima, Peru (PEL), Gujarati Indians from Houston, Texas (GIH), Utah Residents (CEPH) with Northern and Western Ancestry (CEU), Yoruba in Ibadan, Nigeria (YRI), and Han Chinese in Bejing, China (CHB). To generate the dataset, we used Variant Call Format (VCF) files with genotypes calls from the complete Phase 3 1000 Genomes dataset. Because of apparent admixture in the Peruvians, we reduced the sample size for each population to 11 individuals. Unadmixed individuals from PEL were selected based on inferred admixture proportions (<5%) using an ADMIXTURE analysis that also included YRI, CHB, and CEU individuals from the 1000 Genomes. The final dataset comprised 401,821 SNVs within the exome.
Exome sequencing data for Mayans, Mbuti, and Cambodians
This dataset consists of data from six samples from each of the Mayan, Mbuti, and Cambodian populations. To generate this dataset, we downloaded VCF files with called genotypes for individuals from seven populations recently made publicly available by Henn et al. (2016) (https://ecoevo.stonybrook.edu/hennlab/data-software/). From this dataset we extracted data from six Mbuti Pygmies, six Mayan Indians, and six Cambodians. More specifically, following Henn et al. (2016) we excluded two of the eight Mayan samples due to admixture, leaving only six Mayan samples. To ensure comparability between the SFSs inferred from the different populations, we included only six randomly chosen individuals from each of the other populations. The ancestral allele for each dataset was obtained as previously described. The final dataset contains genotype data for 194,278 SNVs.
Annotation of variants
We divided variant sites into four categories based on the functional category annotated to the derived allele: synonymous, a combined category of noncoding exons (NCE) and the leading and trailing untranslated region (UTR), missense, and loss of function (LoF). The LoF category includes all mutations that lead to a stop codon in a protein-coding region, i.e., both mutations that disrupt splice sites and LoF mutations. Variant sites that belong to other functional annotations were excluded from further analyses. When there were multiple transcripts or functional annotations for variants, we assigned a variant to the putatively most deleterious annotation category. We also included an additional category for loss of function where all isoforms are annotated to be loss of function (denoted LoFa) in the expectation that these sites are more likely to be deleterious than the sites in the LoF category. The five categories thus range from mutations that are expected to be neutrally evolving to mutations that are expected to be highly deleterious.
We also classified variants into categories based on GERP scores (Cooper et al. 2005). These GERP scores measure conservation across a phylogeny of 35 mammalian species excluding humans (Henn et al. 2016). Specifically, GERP scores represent the deficiency in the number of substitutions at putatively functional sites compared to the number of substitutions seen in neutral DNA. Thus, the lower the number of substitutions at a site across the phylogeny, the higher the level of purifying selection at that site (Goode et al. 2010; Henn et al. 2016). We used the same approach as Henn et al. (2015) for the GERP score annotation. We retrieved the GERP scores from the UCSC browser and grouped variants into four categories according to their degree of deleteriousness based on their GERP score. The categories are “neutral” (GERP < 2), “moderate” (2 ≤ GERP < 4), “large” (4 ≤ GERP < 6), and “extreme” (GERP ≥ 6).
Inference of population size
We performed inference of population size over time on the GI dataset using the stairway plot [version 2 beta (Liu and Fu 2015)]. This approach uses the SFS to fit a demographic model consisting of a number of epochs of population size changes. We performed the analysis using the unfolded SFS from called genotypes based on a sequence length containing 41,222,102 total sites. We used three different mutation rates, 1.3 × 10⁻⁸ and 1.6 × 10⁻⁸ (Campbell and Eichler 2013) as well as an intermediate rate 1.38 × 10⁻⁸, and two different generation times, 25 and 29 years (Fenner 2005) for inference. Confidence intervals and median estimates of the population size were estimated using the built-in bootstrap function using 200 replicates of the input file.
Approximating genetic load based on the number of derived alleles and the number of homozygous-derived genotypes
We used two different proxies for genetic load based on counts of derived alleles: the total number of derived alleles per individual, which has previously been used to quantify load under an additive model (Fu et al. 2014; Simons et al. 2014; Do et al. 2015; Henn et al. 2016; Marsden et al. 2016; Simons and Sella 2016) and the number of homozygous-derived genotypes per individual, which can equivalently be used to quantify load under a recessive model (Henn et al. 2015; Henn et al. 2016).
Approximating genetic load based using GERP score load
Calculation of πvar
Simulations
We performed forward-time simulations using the Selection on Linked Mutations (SLIM) software (Messer 2013). We used the demographic history estimated for the GI in this study and for the CHB by Fumagalli et al. (2015). Specifically, we used the estimates for population sizes in present time as well as the estimated split time. The demographic history and population size changes prior to the split of the GI and CHB were taken from Gutenkunst et al. (2009) (Figure S1). We initiated simulations with a haploid population size of 9395 at 29,459 generations before the sampling time (present time), allowing sufficient time to reach mutation-drift-selection equilibrium. The population size was reduced to 5443 chromosomes 18,619 generations ago to simulate OOA bottleneck. We employed two different models of CHB demography (Table S6 and Table S7) from this point forward. First, we used one where the CHB population did not change in population size. In the second model the CHB population increased in size exponentially 840 generations up until the present time (Gutenkunst et al. 2009). To simulate the additional bottleneck, which the GI population underwent after splitting from CHB, we introduced an additional reduction in population size 930 generations before the present, resulting in a population size of 1550 chromosomes. We sampled 36 chromosomes from each of the present-day simulated GI and CHB populations, allowing us to capture comparable levels of genetic diversity as the empirical data.
We examined a number of models of purifying selection. First, for each simulated demographic scenario, 90% of sites within the region were simulated as neutral mutations and 10% were under selection. For the deleterious mutations, we varied the dominance coefficient (h) and the selection coefficient (s) to mimic the effects of three modes of inheritance: additive (h = 0.5), near-recessive (h = 0.1), and recessive (h = 0). Furthermore, for each of these modes, we varied the selection coefficient, s, across four levels, reflecting increasingly deleterious functional effects (s = 0.0002; s = 0.002; s = 0.02; s = 0.2). Note, though SLIM uses a different scaling of selection than the one we mentioned above, we present the selection coefficients in terms of the equations described above.
For each scenario (combination of demographic models and values of s and h), we simulated 10,000 replicates of a sequence of 100 kb using a recombination rate of 1.2 × 10⁻⁸ per base position per generation and a mutation rate of 1.38 × 10⁻⁸ per base position per generation (Campbell and Eichler 2013). Furthermore, for the model without recent growth in CHB, we simulated a scenario where all new mutations have neutral fitness effects in GI after the split between GI and CHB. Older, preexisting mutations retained their existing value of s.
Comparison of allele frequencies in GI to Europeans, East Asians, Finns, and Latinos
To compare frequencies of alleles shared across populations, we used the information available for >9.3 million sites based on exome data in the ExAC browser (ftp://ftp.broadinstitute.org/pub/ExAC_release/release0.3/ExAC.r0.3.sites.vep.vcf.gz) (Exome Aggregation Consortium [ExAC], Cambridge, MA). This dataset has sufficient numbers of samples for European and East Asian populations to allow reliable calculation of rare allele frequencies.
Data collection and ethical considerations
The data from the GI were collected as a part of several general health surveys (for details see Moltke et al. 2014). The study has received ethics approval from the Commission for Scientific Research in Greenland (project 2011-13, ref. no. 2011-056978; and project 2014-8, ref. no. 2014-098017) and was conducted in accordance with the ethical standards of the Declaration of Helsinki, second revision.
Data availability
The authors do not have the authority to grant permission to use the data, which belong to the Greenland Government. Requests for anonymized relevant consented data should be addressed to the Ministry of Health in Greenland ([email protected]).
Results
Inference of demographic history and analysis of the SFS
To investigate how the history of the GI population compares to that of other previously studied populations, we first inferred the size of the GI population over time from exome data for 18 GI using the stairway plot (Liu and Fu 2015). The results suggest that the GI population experienced a marked decrease in size beginning 20,000 years ago (Figure 1), remained small for at least 15,000 years, and only recently started to increase in size. We note that there is a considerable amount of uncertainty for recent population size estimates, which makes it difficult to assess the extent of the recent increase. We also note that the results depend on both mutation rate and generation time. However, even assuming extreme values of these parameters, we find evidence of a very long bottleneck in the recent past of the GI population (Figure S2).
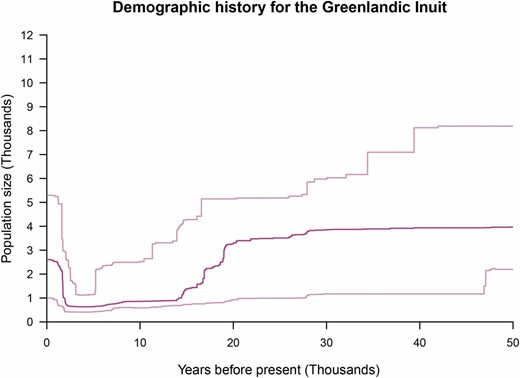
Inferred history of population size for the Greenlandic Inuit population. The dark pink line shows the estimated diploid population size changes in discrete increments for the last 50,000 years. The estimates were obtained with the method “Stairway plot,” which bases its estimates on the SFS. The estimates are based on an assumption of a mutation rate of 1.38 × 10⁻⁸ per site per generation and a generation time of 25 years. The light pink lines represent 95% CI based on bootstraps. This analysis was based on 41,222,102 sites.
Next, we compared the SFS of the GI population to the SFSs of a number of other human populations from the 1000 Genomes Project (Figure 2) and Cambodians and Mayans from Henn et al. (2016) (Figure S8). Because the SFS is affected by demographic history (Adams and Hudson 2004; Marth et al. 2004; Nielsen et al. 2005), this comparison should reveal whether the GI experienced an increase in genetic drift due to a long population bottleneck relative to other OOA populations. These comparisons show that the SFS for the GI population is flatter than those seen in any other human population tested to date. This deficit of rare alleles is also reflected in markedly higher nucleotide diversity for the variable sites (πvar). Thus compared to other populations, the GI population has had both a greater depletion of rare variants, as well as a higher increase in allele frequencies for remaining variants. Hence the GI population shows evidence for having undergone a more extreme population bottleneck than other human populations tested to date.
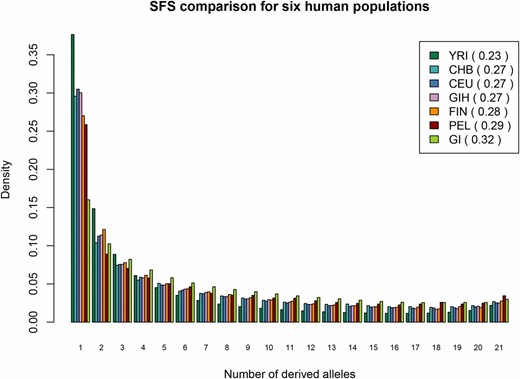
Site frequency spectrum for six human populations. We used 11 randomly sampled individuals from each population to infer the site frequency spectrum and excluded fixed categories. Populations contain individuals with the following ancestry: Finns from Finland (FIN), Peruvians from Lima, Peru (PEL), Gujarati Indians from Houston, Texas (GIH), Utah Residents (CEPH) with Northern and Western Ancestry (CEU), Yoruba in Ibadan, Nigeria (YRI), and Han Chinese in Bejing, China (CHB). The GI population has fewer sites in the singleton category, but more in the remaining more “common” categories. Each population is followed by a πvar estimate per variable site. The idea for this figure was adopted from the SFS comparison of four Hapmap populations and GI in Moltke et al. (2015).
Comparison of different approximations of genetic load in GI and other larger populations
Motivated by these initial findings, we first compared the genetic load between GI and the larger CEU population to investigate whether the long history of reduced population size has led to an increased genetic load in the GI population. For this comparison we used the exome data from the 18 GI combined with exome data from 18 individuals with European ancestry (CEU). Since there is no direct way to calculate genetic load from genetic data, we examined several different statistics, all of which have recently been proposed as approximations to genetic load.
First, we examined load statistics that assume that all alleles have an additive effect. In particular, we looked at the average number of derived alleles per individual, which has previously been used by Fu et al. (2014), Do et al. (2015), Simons and Sella (2016), and Marsden et al. (2016) as a proxy for additive genetic load. We performed the comparison between GI and CEU by calculating the ratio of this statistic in GI and CEU. Here a ratio above one would indicate that the average number of derived alleles in GI is higher than that in CEU. We calculated this ratio both for all sites and for sites in nine different subcategories that represent a range of different levels of putative deleterious effect: five categories based on functional annotation and four based on GERP scores (for details see Materials and Methods). We did not find a significant difference between the numbers of derived alleles per individual between the two populations for any of the different functional annotation-based categories, i.e., the ratios did not differ significantly from 1 (Figure 3, Figure S5, and Table 1). The ratio of derived alleles in the more deleterious GERP categories show a 1–4% increase in GI compared to CEU (Figure 3), but this difference is not significant. Further, the number of derived alleles per individual with a GERP score of 4–6 or >6 shows up to a 7% increase in the GI relative to CEU, though this difference is not significant after correcting for multiple tests (Figure S5). The RX/Y ratio from Do et al. (2015) did not show a difference between populations (Table 1). Hence, the results from these statistics suggest that, under an additive effect model, the load is, at most, slightly higher in GI (Table 1). However, the percentage of the derived alleles per individual that come from sites fixed for the derived allele differs markedly between GI and the three larger populations. The GI have a greater proportion of sites where the derived alleles is fixed compared to the CEU population (Table 1). This is seen for all sites as well as in most functional subcategories (e.g., LoF alleles and GERP scores higher than 6; Table 1, column 4). We also note that the average number of derived alleles per SNV differs significantly between the GI and CEU populations in all categories (Table 1, column 6). All the ratios are significantly larger than 1, indicating that per SNV, the derived allele is at a higher frequency in GI compared to CEU. This observation combined with our previous observation that the average number of derived alleles per individual is approximately the same in the two populations, reveals that the derived alleles in GI are from fewer sites with putatively higher derived allele frequencies and thus that the load under an additive model is distributed differently in GI compared to the larger CEU population.
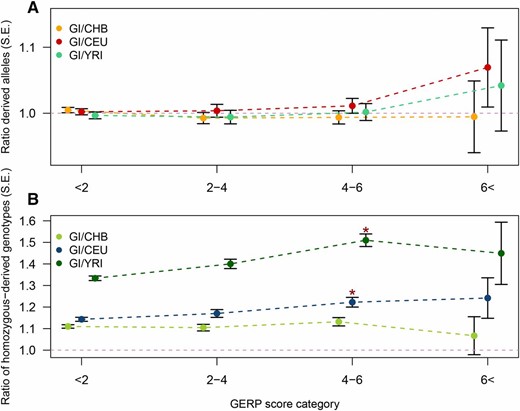
Comparison of the number of derived alleles and homozygous genotypes across populations for variants in different GERP score categories. For each of four GERP score categories two ratios calculated based on sites located in exons are shown: (A) the ratio of derived allele counts in GI vs. CHB (orange), CEU (red), and YRI (turquoise); and (B) the ratio of homozygous-derived genotype counts in GI vs. CHB (light green), CEU (blue), and YRI (dark green). The former ratio can be viewed as an approximation for the ratio of load between the populations under an additive model and latter ratio can be viewed as an approximation for the ratio of load between the populations under a recessive model. Standard error for each ratio is indicated by error bars. Additional information is available in Table 1, Table S1, and Table S2. The * indicates significance compared to the neutral GERP score category (GERP <2), for the CEU and YRI comparison this value is significant (P = 5.3 × 10⁻⁴ and P = 5.9 × 10⁻⁹, respectively).
Genetic load summary statistics
| Category (N SNV) | Ratio of derived allele counts | Ratio of homozygous-derived genotype counts | Ratio of derived alleles in fixed sites | Derived alleles from fixed sites | Ratio of derived alleles per SNV | Rxy |
|---|---|---|---|---|---|---|
| Derived alleles (49,631) | 1.002 (0.004) | 1.156 (0.008) | 4.413 (0.301) | GI:17.0% CEU:3.9% | 1.484 (0.009) | 1.004 (0.008) |
| Synonymous (20,693) | 1.006 (0.005) | 1.156 (0.010) | 4.733 (0.420) | GI:18.2% CEU:3.9% | 1.420 (0.011) | 1.013 (0.012) |
| NCE+UTR (4919) | 1.006 (0.012) | 1.168 (0.022) | 5.268 (0.900) | GI:17.9% CEU:3.4% | 1.466 (0.023) | 1.013 (0.026) |
| Missense (23,582) | 0.996 (0.006) | 1.151 (0.012) | 3.899 (0.377) | GI:15.5% CEU:4.0% | 1.550 (0.013) | 0.993 (0.013) |
| LoF (400) | 1.009 (0.063) | 1.296 (0.131) | 2.500 (2.840) | GI:9.3% CEU:3.8% | 1.625 (0.115) | 0.991 (0.104) |
| LoFa (278) | 1.045 (0.099) | 1.457 (0.286) | b | GI:0% CEU:4.4% | 2.026 (0.194) | 1.064 (0.142) |
| GERP <2 (29,183) | 0.999 (0.005) | 1.140 (0.009) | 4.293 (0.291) | GI:18.4% CEU:4.0% | 1.414 (0.009) | 0.999 (0.010) |
| GERP >2:<4 (9853) | 1.001 (0.010) | 1.169 (0.018) | 4.725 (0.757) | GI:15.3% CEU:3.1% | 1.517 (0.019) | 1.002 (0.019) |
| GERP >4:<6 (10,211) | 1.011 (0.011) | 1.222 (0.022) | 4.659 (0.919) | GI:12.7% CEU:2.8% | 1.697 (0.023) | 1.021 (0.021) |
| GERP >6 (353) | 1.069 (0.060) | 1.244 (0.093) | b | GI:8.6% CEU:0% | 1.888 (0.130) | 1.127 (0.113) |
Comparisons between 18 Greenlandic Inuit (GI) and 18 Utah Residents (CEPH) with Northern and Western Ancestry (CEU) individuals using 93.047 SNP sites located in genic regions with full information for both populations. Ratios are the sum within GI divided by the sum within CEU. Standard errors are given in parentheses.
Unambiguous sites (sites where all possible functional annotations were LoF annotations).
Too few sites fall in this category to allow a meaningful result.
| Category (N SNV) | Ratio of derived allele counts | Ratio of homozygous-derived genotype counts | Ratio of derived alleles in fixed sites | Derived alleles from fixed sites | Ratio of derived alleles per SNV | Rxy |
|---|---|---|---|---|---|---|
| Derived alleles (49,631) | 1.002 (0.004) | 1.156 (0.008) | 4.413 (0.301) | GI:17.0% CEU:3.9% | 1.484 (0.009) | 1.004 (0.008) |
| Synonymous (20,693) | 1.006 (0.005) | 1.156 (0.010) | 4.733 (0.420) | GI:18.2% CEU:3.9% | 1.420 (0.011) | 1.013 (0.012) |
| NCE+UTR (4919) | 1.006 (0.012) | 1.168 (0.022) | 5.268 (0.900) | GI:17.9% CEU:3.4% | 1.466 (0.023) | 1.013 (0.026) |
| Missense (23,582) | 0.996 (0.006) | 1.151 (0.012) | 3.899 (0.377) | GI:15.5% CEU:4.0% | 1.550 (0.013) | 0.993 (0.013) |
| LoF (400) | 1.009 (0.063) | 1.296 (0.131) | 2.500 (2.840) | GI:9.3% CEU:3.8% | 1.625 (0.115) | 0.991 (0.104) |
| LoFa (278) | 1.045 (0.099) | 1.457 (0.286) | b | GI:0% CEU:4.4% | 2.026 (0.194) | 1.064 (0.142) |
| GERP <2 (29,183) | 0.999 (0.005) | 1.140 (0.009) | 4.293 (0.291) | GI:18.4% CEU:4.0% | 1.414 (0.009) | 0.999 (0.010) |
| GERP >2:<4 (9853) | 1.001 (0.010) | 1.169 (0.018) | 4.725 (0.757) | GI:15.3% CEU:3.1% | 1.517 (0.019) | 1.002 (0.019) |
| GERP >4:<6 (10,211) | 1.011 (0.011) | 1.222 (0.022) | 4.659 (0.919) | GI:12.7% CEU:2.8% | 1.697 (0.023) | 1.021 (0.021) |
| GERP >6 (353) | 1.069 (0.060) | 1.244 (0.093) | b | GI:8.6% CEU:0% | 1.888 (0.130) | 1.127 (0.113) |
Comparisons between 18 Greenlandic Inuit (GI) and 18 Utah Residents (CEPH) with Northern and Western Ancestry (CEU) individuals using 93.047 SNP sites located in genic regions with full information for both populations. Ratios are the sum within GI divided by the sum within CEU. Standard errors are given in parentheses.
Unambiguous sites (sites where all possible functional annotations were LoF annotations).
Too few sites fall in this category to allow a meaningful result.
Next, we aimed to compare the genetic load under the assumption that deleterious alleles have a recessive effect. To do this we examined the average number of homozygous-derived genotypes per individual. The ratios of this statistic were significantly higher than 1 (Figure 4, Figure S6, and Table 1, column 2), indicating an accumulation of homozygous-derived genotypes in the GI population. This was seen for all categories, even for the LoF categories. In fact, the ratio is significantly higher in sites with large deleterious effects, i.e., GERP scores above 4, compared to neutral sites, i.e., sites with GERP scores below 2 (see asterisk in Figure 3). These observations suggest that, under a recessive model, the load is increased in GI.
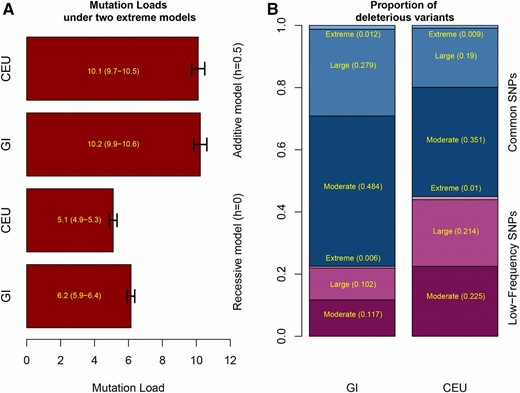
GERP score load and stratification of deleterious alleles based on frequency. (A) GERP score load for GI and CEU calculated assuming a fully additive model (top two bars) and assuming a fully recessive model (bottom two bars). The GERP score load is the approximation to the genetic load based on annotated GERP scores converted to selection coefficients using the approach used in the review by Henn et al. (2015). We note that if the selection coefficients from Henn et al. (2016) are used instead, we see qualitatively similar results. Black error bars indicate 95% C.I. (B) The proportion of deleterious variants classified by GERP score (Moderate: 2 < GERP < 4, Large: 4 < GERP < 6, Extreme: 6 < GERP) that belong to different frequency-based categories in GI and CEU: low frequency SNPs vs. common SNPs. Low-frequency SNPs are here defined as singletons and doubletons (equivalent of a frequency of at most 1/18∼0.056), while common SNPs are defined as tripletons or more than that including fixed derived sites (equivalent of a frequency of 1/12 or above).
We also looked at the load statistic proposed by Henn et al. (2015), which we denote as GERP score load. This statistic approximates load using the original definition by Kimura et al. (1963), where each GERP score category is translated into a selection coefficient. We coupled these groups of selection coefficients with two models of dominance: one where h was set to 0.5, i.e., assuming alleles have an additive effect, and one where h was set to 0, i.e., assuming alleles have a recessive effect (for details see Materials and Methods). When doing so, we saw no significant difference between the two populations under the additive model [10.1 (SE 0.4) for CEU vs. 10.2 (SE 0.4) for GI], but a 22% increase in the GERP score load under the completely recessive model [5.1 (SE 0.2) vs. 6.2 (SE 0.3)] (Figure 4). Furthermore, putatively deleterious SNVs (GERP score >2) that contribute to the genetic load are much more common in the GI population compared to the CEU population (Figure 4). Hence, the results obtained based on GERP scores lead to qualitatively the same conclusion as the other statistics.
We also performed similar comparisons of statistics related to genetic load of the 18 GI to 18 individuals with East Asian ancestry (CHB) and the 18 individuals with African ancestry (YRI) to ensure that our conclusions were not artifacts of particular features of the CEU. In particular, we performed the analyses underlying Table 1 and Figure 3 for these two additional populations (Figure 3, Table S1, Table S2. Also, for results without merging data set see Table S3). When doing so, we reached the same conclusions for both populations with one exception: when comparing GI and CHB, the ratio of homozygous-derived genotype counts is indeed higher in the GI at sites with large deleterious effects, i.e., GERP scores above 4, compared to neutral sites, but not significantly so (Figure 3). For YRI, as in the CEU, this difference is significant (asterisk in Figure 3). Thus, overall, the GI show a consistent increase in the number of homozygous deleterious genotypes and, at most, a slight, but not significant, increase in the number of derived deleterious alleles regardless of which other human population they are compared to.
Comparison of the true genetic load based on simulations
To employ a model-based approach to investigate how differences in demography could impact the genetic load, we performed simulations of GI and CHB populations using the demographic history of these two populations inferred in Fumagalli et al. (2015) and Gutenkunst et al. (2009). We also considered a model where the CHB population began to grow exponentially after splitting from the GI population (see dotted lines in Figure S1). We performed simulations for 12 different combinations of selection (s) and dominance coefficients (h), reflecting different degrees of fitness effects.
Finally, we calculated the true genetic load based on the true effect model and the true selection coefficient for each site in the simulated data using the standard genetic load equations (Equation 3). Interestingly the ratio of this true load in GI and CHB is higher than 1 in at least one scenario across all dominance models, indicating a higher load in GI than in CHB (Figure 5). This difference decreases as h increases. However, importantly, even in the scenarios where additive selection (h = 0.5) was simulated, except one scenario, the ratios of load were all above 1, with the increase varying from 1 to 6% (Figure S9, Table S6, and Table S7) depending on the strength of selection simulated. The highest load difference was in general observed for the scenario with s = 0.002. Overall, this magnitude of increase in load in the GI relative to the CHB (for s = 0.002) was similar in magnitude to the increase in the number of derived deleterious alleles per individual (GERP score >4) seen empirically (Figure S5). Thus, our empirical and simulation results taken together argue that there is a slight increase (1–6%) in additive load in the GI relative to other populations.
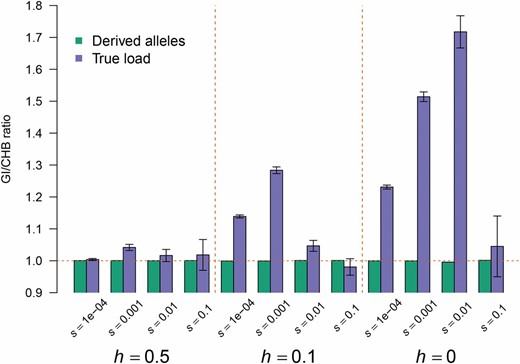
GI are predicted to have a higher genetic load than the CHB. The ratio of the true genetic load (black errors bars indicate SE) (see Materials and Methods) in the GI vs. CHB (blue bars) is >1, suggesting that the GI have a higher genetic load than CHB. However, the ratio of the number of derived alleles in the GI vs. CHB rarely shows any deviation from 1 (green bars), likely due to the inclusion of neutral sites (see text).
We next compared the ratio of the number of derived alleles between the simulated GI and CHB populations. Overall, this ratio was only slightly different from 1 in all of the scenarios (Table S6 and Table S7). Because this comparison includes both the neutral and deleterious mutations, it suggests that including neutral derived alleles when using the number of derived deleterious alleles as a measure of load will substantially reduce power. Lastly, we also counted the number of homozygous-derived genotypes and, as expected, we observed a significantly higher number in GI than in CHB (Figure S9). The increase is about 19% across all selection scenarios (Table S6), while growth in the CHB population resulted in an even greater increase (about 25%) in load in the GI population (Table S7). Including neutral variants in this comparison does not result in a loss of power because the bottleneck increases homozygosity for derived alleles across all functional categories.
Effectiveness of selection
To investigate to what extent the long recent bottleneck in GI has affected the effectiveness of selection, we looked at two other summary statistics, which have both previously been used to address this question in the context of the OOA bottleneck: SFSs and the proportion of nonsynonymous mutations (Lohmueller et al. 2008).
We first compared SFSs for GI and the CEU. Specifically, we made SFSs for each of the five functional categories: synonymous, a combined category of non-coding exons (NCE) and the leading and trailing untranslated region (UTR), missense, and finally two different LoF categories (Figure S3 and Figure S4). These SFSs show that the GI have a larger proportion of alleles found in higher frequencies, not only overall, but also within all of the functional categories. This is also apparent for the LoF category suggesting an increase in frequency of potentially highly deleterious alleles. And consistent with the results described previously, the SFSs also show that the GI population has a higher proportion of fixed putatively deleterious derived alleles in all the functional categories. Such comparisons of the SFSs for various levels of deleterious categories serves as a proxy for selection, as more harmful categories will have lower overall allele frequencies. In contrast, the CEU population has a clear skew toward rare variants for all functional categories (Figure S4). This difference may reflect the effects of less efficient purifying selection in GI and/or recent growth in CEU (Nielsen et al. 2005; Boyko et al. 2008). However, based on simulations similar to the ones presented above, but where each new deleterious mutation is set to neutral (changing the selection coefficient to 0) in GI after the start of the GI bottleneck (Figure S10), we observed a fairly similar SFS to the one where selection continues to happen after the bottleneck. Thus, based on the simulations, we do not necessarily expect to observe large differences in the SFS of the different functional categories even in the complete absence of recent negative selection. Thus, the shift in the SFS toward intermediate and higher frequency derived alleles in the GI relative to the CEU likely reflects the extreme genetic drift experienced by the GI, and may be less informative regarding the efficacy of selection.
Next, we compared the ratio of nonsynonymous to synonymous SNPs in the GI populations to that of the CEU population using the combined GI and CEU dataset, following what was done by Lohmueller et al. (2008) (Table S4). Specifically, we tested for a difference in this ratio between the two populations both among all sites and among sites from different GERP scores categories. We found that the ratio of the number of nonsynonymous to synonymous SNPs is significantly higher in CEU than in GI, when considering all sites (first row in Table S4). When considering different GERP score categories, the nonsynonymous to synonymous ratio in GI becomes even lower relative to that seen in CEU with increasing levels of deleteriousness.
We further investigated this pattern by defining neutral sites as those with GERP scores below 2 and deleterious variants as those with GERP scores above 4 and then calculating the ratio of deleterious to neutral SNPs for both GI and CEU. When doing so the deleterious to neutral SNP ratio is significantly lower in the GI compared to the CEU (Table S4, row 2) and is almost as low as the ratio of nonsynonymous to synonymous sites among the most deleterious GERP scores (Table S4, rows 5 and 6). Hence, there seem to be a higher proportion of deleterious variants in CEU than in GI, particularly for highly deleterious variants. We provide an interpretation of this finding in the Discussion section.
Consequences for disease mapping
Regardless of whether selection has acted less efficiently in GI or not, our results clearly show that individual deleterious variants tend to have higher frequency in GI compared to CEU (Figure 4). This is potentially important for quantitative trait mapping and disease mapping since it implies that the GI population will, in some cases, be more powerful for associating variants with disease than the CEU population (Hong and Park 2012). This view is similar in spirit to what was suggested for other historically isolated populations like the Finnish and Native American populations (Peltonen et al. 2000; Kristiansson et al. 2008; Kurki et al. 2014; Zuk et al. 2014). To investigate the potential of GI for mapping complex traits relative to other isolated populations, we binned alleles according to their frequency in larger cosmopolitan reference populations, using the allele frequencies from the ExAC. Then, for each bin, we determined how often the alleles are common among GI compared to how often they are common in other isolated populations. As can be seen in Figure 6, Figure S9, Figure S10, and Figure S11, we find that rare alleles among Non-Finnish Europeans are more likely to be common in GI than in Finnish, East Asian, and Latino populations. This pattern is especially pronounced for variants that are extremely rare in Non-Finnish Europeans (MAF <1 × 10⁻³). Similar patterns are seen when looking at variants that are rare in East Asians. This suggests that the GI population does indeed have potential to provide increased power to detect alleles that are rare in Non-Finnish Europeans and East Asians. Further, this increase in power is even larger than that of both Latinos and Finns, populations that are considered particularly powerful for trait mapping.
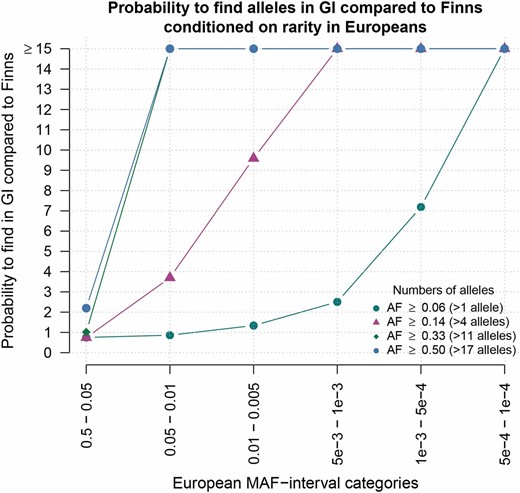
Probability of alleles being common among GI compared to among Finns. For alleles in different frequency categories in Europeans (x-axis) the points show how much more likely the alleles are to be common in GI than in Finns (y-axis). Here, common is defined in four different ways, each represented by a specific color point: e.g., the dark blue circles represent results for analyses made with common defined as >2 out of 36 alleles, which corresponds to a frequency of ∼0.056 (for the remaining definitions, see the figure legend).
Next, we investigated the frequency distribution of all the LoF variants (including frameshift) that are present in at least two copies in the GI dataset and are rare, but not absent, in both the European and EAS populations (MAF below 0.5%) (Table 2 and Table S5). We did this because such alleles are of potential interest for the Europeans and EAS, but difficult to map and investigate in these populations due to their low frequency. This approach led to the identification of 6 SNVs and 14 indels. One of the SNVs, located in TBC1D4, was recently shown to have a very large impact on type 2 diabetes (Moltke et al. 2014) and one of the indels, located in SI, was recently shown to have large impact on a sucrase-isomaltase deficiency (Marcadier et al. 2014). Other interesting variants include an SNV in the gene SEMA4C, which is associated with neonatal lethality (Maier et al. 2011; Moltke et al. 2014), and SNVs in CRYGA and USP45, which might be involved in cataract and DNA repair, respectively (Kapur et al. 2009; Perez-Oliva et al. 2015). The fact that these variants which have phenotypic consequences are relatively common in the GI (at least 2 out of 36 copies) suggests that deleterious variants of functional importance may have drifted up in frequency in the GI, making them easier to detect using genome-wide association studies.
Summary of loss-of-function mutations at count >2 in the GI
| rs number | Gene name | Possible clinical implications | Genotypes among the 18 Inuit (parents only) | Reference allele |
|---|---|---|---|---|
| rs12471298 | SEMA4C | Neonatal lethality | CC = 12,CA = 6 | C |
| rs61736969 | TBC1D4 | Type 2 diabetes | GG = 7,GA = 7,AA = 4 | G |
| rs116344874 | CRYGA | Cataract | GG = 13,GA = 5 | G |
| rs189281869 | USP45 | DNA repair (following UV irradiation) | TT = 15,TA = 3 | T |
| rs189664399 | SIGLEC7 | Unknown | CC = 15,CT = 3 | C |
| rs201985967 | SPAG4 | Unknown | TT = 13,TA = 5 | T |
LoF variant (Stop & splice variants) annotation for alleles that are rare in Europeans and East Asians (below a MAF of 0.5%).
| rs number | Gene name | Possible clinical implications | Genotypes among the 18 Inuit (parents only) | Reference allele |
|---|---|---|---|---|
| rs12471298 | SEMA4C | Neonatal lethality | CC = 12,CA = 6 | C |
| rs61736969 | TBC1D4 | Type 2 diabetes | GG = 7,GA = 7,AA = 4 | G |
| rs116344874 | CRYGA | Cataract | GG = 13,GA = 5 | G |
| rs189281869 | USP45 | DNA repair (following UV irradiation) | TT = 15,TA = 3 | T |
| rs189664399 | SIGLEC7 | Unknown | CC = 15,CT = 3 | C |
| rs201985967 | SPAG4 | Unknown | TT = 13,TA = 5 | T |
LoF variant (Stop & splice variants) annotation for alleles that are rare in Europeans and East Asians (below a MAF of 0.5%).
Discussion
We have performed analyses of exome data from the GI population with the aim of investigating the consequences of small population size for deleterious genetic variation in humans. We first investigated the demographic history of the GI population and found that it dramatically decreased in size ∼20,000 years ago and remained small for >15,000 years, which corroborates previously reported results (Fumagalli et al. 2015). Furthermore, we observed a flattening of the SFS (i.e., decrease in the proportion of low-frequency variants) for populations with increasing distance to Africa. In fact, the SFS for the GI population was even flatter than those for the equally distant Mayan and Peruvian populations. This suggests that the GI population underwent further reductions in population size while crossing the North America landmass. This is consistent with our estimates of the GI population size over time (Figure 1), where the population size remained low following the entry into North America. This finding makes the GI population highly relevant to the study of how demography has shaped deleterious variation in humans.
Comparing genetic load in GI and other populations using different approximations
We next investigated whether the severe bottleneck has affected the genetic load of the GI population by comparing it to other human populations. In this context, it is important to reiterate that genetic load cannot be directly calculated from exome data (Lohmueller 2014a). It can only be approximated through the use of summary statistics. The accuracy and effectiveness of these approximations depend on the underlying effect model, i.e., whether the deleterious alleles are acting additively or recessively. Further, empirical quantification of genetic load from genetic variation data depends on the accuracy of the functional annotations and predictions of whether and to what extent alleles are deleterious. We therefore compared the genetic load between the GI and CEU populations using several different proxy statistics. Our analyses reveal a slight, but not significant, increase in load in GI when using proxy statistics that assume an additive effect, like the number of derived alleles. However, the GI show a significantly larger genetic load when using proxy statistics for load that assume a recessive effect, like the number of homozygous-derived genotypes (Table 1). Importantly, we observed similar results when comparing GI to CHB and YRI (Table S1 and Table S2). These observations are in line with the results from several previous studies (Simons et al. 2014; Do et al. 2015) and are consistent with our simulations where we observe no significant effect on the number of derived alleles and a large significant difference in number of homozygous-derived genotypes (Figure 3, Figure S9, Table S6, and Table S7). When looking at variant sites that are predicted to be strongly deleterious by GERP (score >6), we observed a larger increase in number of derived alleles in GI than in CEU. However, this increase is still small and nonsignificant using jackknife resampling. Therefore, our results are not necessarily conflicting with Henn et al. (2016) who found that the number of deleterious alleles increases with distance from Africa. However, while we may have expected to see a stronger increase in load in the GI than in the Mayan used by Henn et al. (2016), we likely have limited power to detect these subtle effects.
Simulation of genetic load
Importantly, because our simulations assume an underlying population genetic model, it is possible to directly compute the true genetic load from them. Thus, we are not confounded by the accuracy of the functional annotation or using the wrong summary statistics for the true genetic model. When computing genetic load using its definition, the simulations show a significant increase in the true load in the simulated GI individuals compared to the simulated CHB individuals (Figure 5 and Table S6). Even under an additive model, there is a small but significant increase of 4%, when simulating no recent population growth in the CHB population, and up to >6% when simulating recent population growth in the CHB population. This suggests that small population size over a long period of time can indeed lead to increased load even if all alleles have an additive effect. Our results are concordant with recent results from Harris and Nielsen (2016) who found a large significant decrease in additive fitness among Neanderthals relative to humans due to a severe population size reduction in Neanderthals. Further, our results are also concordant with those of Marsden et al. (2016) who, using simulations, showed that bottlenecks associated with dog domestication could result in a 2–3% increase in additive genetic load in dogs compared to wolves. We note that our simulations are based on 10,000 independent regions of 100,000 bases, which might be the reason we see a significant difference in the number of derived alleles between the two populations in the simulations for three of our models (Table S6 and Table S7) and not in our exome genotype data. Importantly, we see that the load ratios remain much higher than one indicating there is in fact a difference in true load under an additive model (Table S6 and Table S7). However, we note that this difference in load remains small (1–6%) and thus its biological impact is not clear.
Overall, our results suggest that the fact that we do not see a significant increase in the number of derived alleles in GI compared to CEU (or the other two populations) does not necessarily mean that there is no difference in load under an additive model (Figure 5). Furthermore, it supports the conclusion from Lohmueller (2014a) that part of the reason why different studies reach different conclusions about load is that they are based on different ways of quantifying load, and testing for differences across populations. Some of these approaches are likely underpowered to detect subtle, but real, differences in load across populations. More specifically, while recent studies have suggested that the number of derived alleles per individual is gold-standard in quantifying differences in genetic load in populations (Simons and Sella 2016), our simulation results suggest that this statistic is likely underpowered to detect subtle, but real, differences in load when neutral variants are included in the putatively deleterious class (Figure 5). Given that determining which variants are in fact deleterious remains challenging (Dong et al. 2015), we favor a more comprehensive approach relying on multiple summary statistics and model-based analyses to carefully dissect patterns of deleterious variation across populations (Brandvain and Wright 2016).
Taken together, the results from our empirical analyses and simulations argue that there likely is a slight (<6%) increase in genetic load in the GI compared to other populations. Importantly, the fact that the increase in load was so small for a population with such an extreme bottleneck argues that the load is unlikely to differ between other human populations with less dramatic demographic histories. However, species other than humans, which may have greater variation in demographic histories, or may have had small population sizes for much longer time periods, may show greater variability in additive genetic load with demography. Indeed, the long-term small population size inferred for Neanderthals may have resulted in them having a higher genetic load than humans (Harris and Nielsen 2016). Our results also clearly show that the extent to which the load is increased in GI due to the severe bottleneck depends heavily on the true distribution of fitness effects and dominance coefficients. Hence to fully explore the degree to which genetic load differs across populations, more knowledge about these critical parameters is needed.
Selection in the GI population
The subtleties discussed above make it difficult to use comparisons of the overall genetic load to make conclusions about whether or not the severe bottleneck in GI has led to less efficient selection in the GI. We therefore also examined other statistics to address that question. One of these was the ratio of nonsynonymous to synonymous SNPs. If selection has acted less effectively in GI compared to larger populations, like the CEU, then we would expect this ratio to be higher in the GI population than in CEU. We observe the opposite. However, we note that the ratio of nonsynonymous to synonymous SNPs is highly sensitive to recent demographic changes (Brandvain and Wright 2016; Gravel 2016) and that our observations could also be explained by the recent explosive population growth in CEU (Lohmueller 2014a). Importantly, we also note that if selection has acted equally efficiently in the two populations, then we would expect that the ratio of homozygous-derived genotypes in the two populations would be the same across categories with different levels of deleterious effect. However, we find that this is not the case. On the contrary, the ratio of homozygous-derived genotypes is significantly higher in sites with large deleterious effects, i.e., GERP scores above 4 and below 6 as compared to neutral sites, i.e., sites with GERP scores below 2 (see asterisk in Figure 3). This result was also seen when comparing GI and YRI (asterisk in Figure 3) but not when comparing GI and CHB (see Figure 3). In the latter case, there is an increase in the ratio between the two categories but it is not significant (Figure 3). This suggests that the impact of selection is not the same in GI compared to the YRI and CEU populations and potentially not CHB either. More specifically, it suggests that selection against deleterious alleles has acted less efficiently in GI under a recessive model compared to the other populations. This argument is supported by the fact that we observed a similar pattern in our simulations. Here the increase in the homozygous-derived genotype ratio for the sites under selection (denoted as load ratio in Table S6 and Table S7) under a recessive model is particularly large for alleles with selection coefficient s = 0.002, which correspond to a GERP score of 4–6 (Henn et al. 2016) (Figure S9, Figure S10, and Figure S11). However, we note that in the simulation with growth for the CHB population under a fully recessive model for strong selection (s = 0.1 and s = 0.01) we see a particularly high load for GI (ratio >2.8 times higher than CHB) and suspect this to be a result of the combination of limited data and much more efficient purging of deleterious alleles in the growing CHB population. This load difference would also explain why deleterious alleles have higher frequencies in GI than in CEU (Figure 4). Hence these results combined suggest that selection may have acted less efficiently, and that the higher ratio of synonymous to nonsynonymous sites in GI is most likely explained by the population growth in CEU as has been suggested in other studies (Lohmueller 2014b).
Disease mapping in the GI population
Regardless of whether the genetic load is higher in GI, our results clearly show that the manner in which that load is carried has been substantially affected by population history. The GI population has fewer polymorphic sites. However, derived alleles at those sites that are segregating tend to be at higher frequencies. This finding has direct implications for the architecture and study of complex traits. First, for complex disorders, where many loci are involved, we do not expect the severe population bottlenecks to lead to a large increase in disease prevalence in the GI compared to other populations.
For example, this can be illustrated by the TBC1D4 variant’s impact on the prevalence of type 2 diabetes. Despite its large effect (odds ratio = 10.3) and relatively high frequency of 23% in the GI (Moltke et al. 2014), the Greenlandic population has not had a historically high incidence of type 2 diabetes (Jorgensen et al. 2002). We suspect that the absence of other type 2 diabetes variants in GI are compensating for the presence of this common variant, but acknowledge that other variants may be found if we studied more samples. However, for the rarer, more monogenetic traits, we suspect that the burden of risk mutations will be very different in Greenland. Because fewer variants are involved, the variance of the prevalence of the trait will be much greater. This means that such diseases will likely either be entirely absent from the population or be more prevalent. Sucrase-isomaltase deficiency is an example of the latter. Sucrase-isomaltase deficiency is a very rare disorder in large populations, but is estimated to affect 5–10% of individuals in Greenland (McNair et al. 1972; Gudmand-Høyer et al. 1987). This is presumably solely due to a single SI frameshift variant, which we find in a homozygous state in three of the individuals among the nine GI trios (Table S5).
The way that the bottleneck in GI has shifted the frequency spectrum also has implications for our ability to characterize the function of certain genes, including causal mutations for Mendelian and complex traits. Due to the higher frequency of deleterious alleles, even LoF alleles, the GI are enriched for homozygous functional knockouts compared to the CEU. This enables investigation of the function of the genes that harbor such mutations.
Finally, the population history of GI has implications for disease mapping. It has long been acknowledged that populations which have undergone a recent population bottleneck and therefore, like the Greenlandic population, carry deleterious alleles with higher allele frequency compared to larger populations are useful in disease studies, because the increased allele frequency (along with increased linkage disequilibrium) leads to increased power in association testing (Peltonen et al. 2000; Kristiansson et al. 2008; Kurki et al. 2014; Zuk et al. 2014). The isolated Greek population is one such population, where a cardioprotective variant was found at a higher frequency than in European populations (Tachmazidou et al. 2013). The isolated Finnish population is another well-studied population, where two novel mutations have been found to be associated with lipoprotein levels (Lim et al. 2014). Other examples included various Native American populations where studies have detected several novel disease variants. Interestingly, our analyses show that GI outperforms both Finns and Latinos in terms of improving power in association testing due to higher allele frequencies (Figure 6, Figure S11, Figure S12, Figure S13, and Figure S14). Thus, our results argue that the GI will provide an excellent opportunity to discover many novel associations between genetic variants and complex traits.
Our simple screening of the LoF variants demonstrates the utility of the GI for disease mapping. It also shows that studies of the Greenlandic population can be used to identify alleles of large effect. However, populations like the Greenlandic are also useful for identifying variants with lower effect sizes, because, as shown here, such alleles are much more likely to be at high frequency than are alleles of large effect. Because our analyses of allele frequencies among GI compared to Finns and Latinos were carried out for alleles that are rare, but still present in Europeans and East Asians, they suggest that disease mapping in the Greenlandic population has great potential to lead to identification of variants that are also important in larger populations. Thus, studies of the GI population constitute a particularly promising approach for future disease mapping.
Acknowledgments
The Novo Nordisk Foundation Center for Basic Metabolic Research is an independent Research Center at the University of Copenhagen partially funded by an unrestricted donation from the Novo Nordisk Foundation (http://www.metabol.ku.dk). K.E.L. is supported by National Institutes of Health grant R35GM119856. I.M. is supported by a grant from the Danish Council for Independent Research with reference DFF-4090-00244. A.A. is supported by a Lundbeck fellowship.
Footnotes
Supplemental material is available online at www.genetics.org/lookup/suppl/doi:10.1534/genetics.116.193821/-/DC1.
Communicating editor: N. A. Rosenberg
