


Abstract
Genome-wide association (GWA) studies typically lack power to detect genotypes significantly associated with complex diseases, where different causal mutations of small effect may be present across cases. A common, tractable approach for identifying genomic elements associated with complex traits is to evaluate combinations of variants in known pathways or gene sets with shared biological function. Such gene-set analyses require the computation of gene-level P-values or gene scores; these gene scores are also useful when generating hypotheses for experimental validation. However, commonly used methods for generating GWA gene scores are computationally inefficient, biased by gene length, imprecise, or have low true positive rate (TPR) at low false positive rates (FPR), leading to erroneous hypotheses for functional validation. Here we introduce a new method, PEGASUS, for analytically calculating gene scores. PEGASUS produces gene scores with as much as 10 orders of magnitude higher numerical precision than competing methods. In simulation, PEGASUS outperforms existing methods, achieving up to 30% higher TPR when the FPR is fixed at 1%. We use gene scores from PEGASUS as input to HotNet2 to identify networks of interacting genes associated with multiple complex diseases and traits; this is the first application of HotNet2 to common variation. In ulcerative colitis and waist–hip ratio, we discover networks that include genes previously associated with these phenotypes, as well as novel candidate genes. In contrast, existing methods fail to identify these networks. We also identify networks for attention-deficit/hyperactivity disorder, in which GWA studies have yet to identify any significant SNPs.
GENOME-WIDE association (GWA) studies and meta-analyses are widely used to identify susceptibility loci for complex diseases and traits, which are phenotypes generated by multiple mutations of moderate to small effect (Hirschhorn and Daly 2005; McCarthy et al. 2008; Daly 2010; Jiang et al. 2012; Evangelou and Ioannidis 2013; Nalls et al. 2014; Skibola et al. 2014; Woo et al. 2014; Buch et al. 2015; Kouri et al. 2015; Litchfield et al. 2015; Renton et al. 2015; Hallberg et al. 2016). To date, >2400 GWA studies have been conducted to find causal variants that are statistically associated with a disease or trait (http://www.ebi.ac.uk/gwas/). The GWA framework tests the hypothesis that individual mutations of large effect generate phenotypes of interest. However, this framework has multiple limitations when applied to complex diseases. First, complex diseases are known to exhibit genetic heterogeneity on multiple levels: (i) The disease may be generated by multiple mutations within an associated gene and (ii) mutations in distinct genes within a pathway may interact and produce the disease state (McClellan and King 2010). In both cases, separately testing individual variants for statistical associations with a phenotype may not identify susceptibility loci (McClellan and King 2010; Stranger et al. 2011). Further, SNP-level GWA results are unlikely to reveal complex disease mechanisms, given that different combinations of functionally related variants in genes and pathways may interact to produce the phenotype of interest.
Gene-set analyses, which test for the statistical association of phenotype state with a set of genes, are commonly used to address these limitations of the GWA framework (see Wang et al. 2010, Leiserson et al. 2013, and Mooney et al. 2014 for reviews). To increase computational efficiency and limit the number of hypotheses tested, it is necessary to reduce the combinations of variants examined to a tractable number. This is typically done using databases of known pathways or other biological interactions, nearly all of which are annotated at the gene level. Thus, a crucial step in most gene-set analyses is combining SNP-level GWA P-values within genes into a “gene score” (Mooney et al. 2014). Here we use “gene-set analysis” to describe three types of statistical tests for association at the gene level with a phenotype of interest. First, we describe permutation tests (e.g., DAPPLE and dmGWAS) (Jia et al. 2011; Rossin et al. 2011) where P-values are assigned to gene scores observed in an annotated pathway. Second, we describe tests for enrichment in related annotations among genes in a predetermined list (e.g., GRAIL, MAGENTA, DAVID, and GSEA-SNP) (Huang et al. 2007; Holden et al. 2008; Raychaudhuri et al. 2009; Segrè et al. 2010). To conduct these tests, the investigator must compute a gene score and, in some cases, determine a threshold for extreme gene scores to generate a list of genes associated with the phenotype of interest. In the third type of test, once a gene score is computed, the investigator can conduct a gene-level association test and/or a gene-network association test, to identify novel combinations of variants that generate a phenotype of interest, due to unknown interactions between genes or uncharacterized crosstalk between pathways.
An informative gene score is a necessary ingredient for accurate gene-set analyses, but all commonly used methods for generating gene scores have substantial drawbacks. Commonly used methods include choosing the best SNP P-value within a gene to be the gene score, which is sometimes referred to as “minSNP” (Torkamani et al. 2008; Fehringer et al. 2012; Gelernter et al. 2015; Hu et al. 2015); permutation-based methods such as permSNP (Wang et al. 2007; Eleftherohorinou et al. 2009; Ballard et al. 2010; Christoforou et al. 2014; Evangelou et al. 2014; Backes et al. 2016); regression-based methods such as the sequence kernel association test (SKAT) family of tests (Wu et al. 2010, 2011) and stratified LD score regression (Finucane et al. 2015); and VEGAS (Liu et al. 2010) and RAREMETALS (Liu et al. 2013), which correct for linkage disequilibrium (LD) between SNPs, using simulations from a multivariate normal distribution whose variance is the empirical LD observed among SNPs within each gene being analyzed. Multiple methods exist that use the same null distribution as VEGAS (Tzeng and Zhang 2007; Pan 2009). Other methods that have been proposed include Fisher’s combination test (where the gene score must be calculated empirically using permutation tests), Simes’ combination test, and Sidak’s combination test (Ballard et al. 2010; Peng et al. 2010; Wojcik et al. 2015).
The limitations of these approaches range from biased results to computational inefficiency to imprecision (Table 1). minSNP is heavily biased by gene length; the longer the gene is, the more likely it is to have a low gene score. permSNP permutes case–control labels within a genotype data set to calculate an empirical P-value for every gene, which becomes computationally intractable for large data sets (Liu et al. 2010). Further, permSNP and SKAT require gaining access to genotype data to perform permutations and regression, respectively. The VEGAS method is more computationally efficient than other permutation methods (e.g., permSNP requires recomputing GWA P-values for each permuted data set) and requires only GWA SNP-level P-values as input, but both permSNP and VEGAS give gene scores whose numerical precision depends on the number of permutations and simulations, respectively, that are performed. The smallest gene score VEGAS reports by default is and for permSNP, it is the reciprocal of the number of permutations performed per gene (Table 1).
Summary of minSNP, permSNP, SKAT, and VEGAS gene score methods and limitations
| Gene score method | How it works | Limitations |
|---|---|---|
| minSNP | The gene score for each gene is the smallest SNP P-value observed within that gene in a GWA study. | Biased by gene length (longer genes have lower gene scores). |
| permSNP | Permutes case–control labels within a genotype data set, recomputes GWA SNP P-values using a permuted data set, and calculates an empirical gene P-value based on the number of times the observed average SNP P-value is lower than the permuted P-values | Requires access to genotype data; very computationally costly for genome-wide data sets; numerical precision of gene scores is bounded by the number of permutations performed. |
| SKAT | Uses multiple linear/logistic mixed-model regression of covariates (such as principal components to control for population stratification) and genotypes for variants in a gene set onto disease state. | Requires access to genotype data. |
| VEGAS | Uses simulations from a multivariate normal distribution to correct for LD between SNPs. The variance of the distribution is the empirical LD observed among SNPs within each gene in the data set. | Numerical precision of gene scores is bounded by the number of simulations performed; computationally inefficient due to simulations. |
Here we propose a new method—the precise, efficient gene association score using SNPs (PEGASUS)—to calculate gene scores analytically from a null chi-square distribution that captures LD between SNPs in a gene and addresses the shortcomings of existing methods. PEGASUS requires only GWA study summary statistics and a suitable reference population for LD calculations as input and thus can be applied to GWA study meta-analyses performed on summary statistics, pooled DNA sequencing GWA studies, family-based GWA studies, transmission disequilibrium test (TDT) results, and also traditional GWA studies where consent guidelines prohibit release of genotype data. PEGASUS gene scores are correlated with statistics like VEGAS (Tzeng and Zhang 2007; Pan 2009; Liu et al. 2010), which rely on the same null distributions to calculate gene scores. These methods use different approximations for the distribution of the sum of correlated chi-square statistics, in contrast to the more accurate numerical integration of the null distribution implemented in PEGASUS. We apply our method to publicly available GWA data sets for nine common diseases and three quantitative traits from the Psychiatric Genomics Consortium (PGC) (Neale et al. 2010; Ripke et al. 2011, 2013; Sklar et al. 2011), the International IBD Genetics Consortium (IIBDGC) (Franke et al. 2010; Anderson et al. 2011), the Genetic Investigation of Anthropometric Traits (GIANT) Consortium (Heid et al. 2010; Lango Allen et al. 2010; Speliotes et al. 2010), the Broad Institute (Stahl et al. 2010), the Diabetes Genetics Replication and Meta-analysis (DIAGRAM) Consortium (Morris et al. 2012), and Xu et al. (2013) (Table 2). These data sets were chosen because the full set of SNP-level P-values from the GWA study were available for public download. We compare our method to gene scores generated by minSNP, permSNP, SKAT, and VEGAS, using real and simulated GWA data. Finally, we use our gene scores as input in pathway analysis with HotNet2 (Leiserson et al. 2015), thereby conducting the first application of HotNet2 to common genetic variation and identifying gene networks harboring several variants associated with three phenotypes: attention-deficit/hyperactivity disorder, ulcerative colitis, and waist–hip ratio. For these three phenotypes of interest, HotNet2 using VEGAS gene scores recovered fewer significant subnetworks for attention-deficit/hyperactivity disorder, ulcerative colitis, and waist–hip ratio. Neither VEGAS nor PEGASUS yielded significant subnetworks for the other nine traits studied here.
Total numbers of cases and controls and number of SNP loci in GWA studies for the 12 phenotypes studied here
| Disease or trait (reference) | No. cases | No. controls | No. SNPs |
|---|---|---|---|
| Attention-deficit/hyperactivity disorder (ADHD) (Neale et al. 2010) | 864 + 2,064 trios | 2,455 | 1,206,461 |
| Acute lymphoblastic leukemia (ALL) (Xu et al. 2013) | 1,593 | 6,661 | 709,059 |
| Bipolar disorder (BIP) (Sklar et al. 2011) | 7,481 | 9,250 | 2,427,220 |
| Body mass index (BMI) (Speliotes et al. 2010) | NA | 123,865 | 2,471,516 |
| Crohn’s disease (CD) (Franke et al. 2010) | 6,333 | 15,056 | 953,241 |
| Height (Lango Allen et al. 2010) | NA | 183,727 | 2,469,635 |
| Major depressive disorder (MDD) (Ripke et al. 2013) | 9,240 | 9,519 | 1,235,109 |
| Rheumatoid arthritis (RA) (Stahl et al. 2010) | 5,539 | 20,169 | 2,556,271 |
| Schizophrenia (SCZ) (Ripke et al. 2011) | 9,394 | 12,462 | 1,252,901 |
| Type 2 diabetes (T2D) (Morris et al. 2012) | 12,171 | 56,862 | 2,473,441 |
| Ulcerative colitis (UC) (Anderson et al. 2011) | 6,687 | 19,718 | 1,428,749 |
| Waist–hip ratio adjusted for BMI (WHR) (Heid et al. 2010) | NA | 77,167 | 2,483,325 |
Materials and Methods
Data sets analyzed from genome-wide association studies
Methods for computing gene scores require a full list of GWA SNP-level P-values; these can be computed from genotype data obtained from previously published GWA studies. We were able to obtain complete results from previous GWA studies for nine common diseases and three quantitative traits (Table 2). See Supplemental Material, Table S3 for URLs to download GWA P-values from the studies referenced in Table 2.
Gene scores
We compared PEGASUS to four existing methods for generating gene-based scores from GWA SNP-level P-values: (i) minSNP (Torkamani et al. 2008; Fehringer et al. 2012; Gelernter et al. 2015; Hu et al. 2015), (ii) permSNP (Wang et al. 2007; Eleftherohorinou et al. 2009; Ballard et al. 2010; Christoforou et al. 2014; Evangelou et al. 2014; Backes et al. 2016), (iii) SKAT (Wu et al. 2010, 2011), and (iv) VEGAS (Liu et al. 2010). For n markers in a given gene, these methods use different strategies, each detailed below and summarized in Figure 1, to combine P-values within the gene and calculate a gene-level P-value. We refer to this gene-level P-value as the gene score or
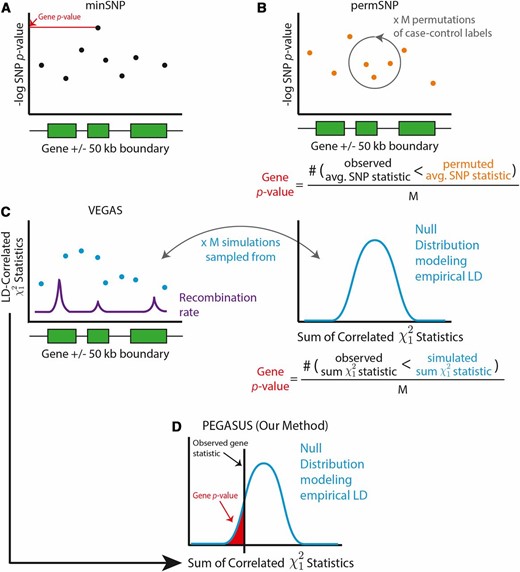
Schematic representations of PEGASUS and the three other methods—minSNP, permSNP, and VEGAS—assessed in this study. (A) minSNP defines the gene score to be the lowest of the SNP-level P-values within the gene observed in a GWA study. (B) permSNP (Ballard et al. 2010) performs M permutations of case–control labels in genotype data, recomputes GWA P-values for each SNP for each permuted data set, averages SNP P-values within each gene, and computes an empirical gene P-value based on the number of times the observed gene P-value is lower than permuted P-values. (C) VEGAS performs multivariate normal simulations from a null distribution of statistics where the statistics are correlated by empirical LD calculated from genotype data. M simulations are performed, the null statistics are summed within each gene and the empirical gene P-value is the number of times the observed statistic is lower than the permuted statistic. (D) In PEGASUS, for each gene, we numerically integrate the distribution of the sum of correlated statistics at the observed gene statistic to determine the gene score. We also assess the performance of SKAT (Wu et al. 2010, 2011), which is not depicted here. SKAT uses a multiple linear/logistic regression framework, where genotypes for variants in a gene set and covariates are regressed onto phenotype to generate gene scores.
minSNP:
The minSNP method (Torkamani et al. 2008; Fehringer et al. 2012; Gelernter et al. 2015; Hu et al. 2015) for generating gene scores assigns the smallest GWA SNP-level P-value in a given gene to be the gene score (Equation 1):
permSNP:
The permSNP method (Wang et al. 2007; Eleftherohorinou et al. 2009; Ballard et al. 2010; Christo-Forou et al. 2014; Evangelou et al. 2014; Backes et al. 2016) produces gene scores by permuting phenotype labels across all genotyped individuals to generate an empirical P-value for every gene. We carried out permSNP only on the acute lymphoblastic leukemia (ALL) data set (Xu et al. 2013), as genotype data are required for this method, and we did not have genotype data for the other traits analyzed here. We calculated permSNP gene scores only for the top 400 most significant genes determined by minSNP using set-based test analysis in PLINK due to computational constraints (Purcell et al. 2007) (see File S1, Algorithm S1 for more details.)
The following settings were used to calculate permSNP gene scores in PLINK (Purcell et al. 2007): --set-r2 1, --set-p 1, --set-max 99999, --maf 0.01, and --mperm 10,000 permutations of case–control labels. With these command flags, PLINK first does an association test between phenotype state and allele dosage at each SNP. Second, for every gene, the SNP test statistics () within the gene are averaged to calculate the observed gene-level test statistic (File S1, Algorithm S1). Third, the phenotype labels are permuted M times and the previous two steps are repeated for the permuted data each time, resulting in SNP statistics using the permuted phenotype data and corresponding gene statistics The gene score is then the fraction of times the gene statistic is greater than the observed statistic over the M permutations (File S1, Algorithm S1).
SKAT (Wu et al. 2010, 2011):
VEGAS (Liu et al. 2010):
Consider a gene with n SNPs. Under the null hypothesis of no association, a gene can be represented by an n-element multivariate normal vector with mean 0 and variance the pairwise LD matrix. Given this model, VEGAS generates gene scores by (i) performing multivariate normal simulations from the null distribution of LD-correlated SNPs, (ii) squaring the simulated values and summing to get a null test statistic for each gene, and (iii) calculating an empirical gene-level P-value based on the proportion of times the observed test statistic is smaller than the simulated null statistics across all simulations (Liu et al. 2010).
PEGASUS:
Connection between SKAT and PEGASUS tests:
As shown in Text S1, the SKAT and PEGASUS null distributions are mixtures of chi-square distributions. Mixture proportions for the SKAT null distribution are the eigenvalues of the matrix where is a projection matrix dependent on the covariate matrix and is a kernel matrix dependent on the genotype matrix and a diagonal matrix of weights For the PEGASUS null distribution, mixture proportions are given by the eigenvalues of the LD matrix If no covariates are considered and the variant weights are uniform () for all variants, the SKAT null distribution becomes a mixture of chi-square distributions with mixture proportions given by the eigenvalues of the matrix, which is a variance–covariance matrix similar to the PEGASUS LD matrix Thus, under these circumstances, the two tests give similar results. However, PEGASUS requires only summary statistics and is a better choice when genotype data are not available for analysis.
GWA study replication
To further assess the robustness of our method, PEGASUS, we attempted to replicate gene hits ( or ) generated by PEGASUS for four data sets [bipolar disorder (BIP), Crohn’s disease (CD), rheumatoid arthritis (RA), and type 2 diabetes (T2D)], using genotype data from the WTCCC (WTCCC 2007). For the replication study, we carried out PEGASUS on these four WTCCC data sets (our “replication cohort”) and compared the top genes found in our “discovery” data sets (Franke et al. 2010; Stahl et al. 2010; Sklar et al. 2011; Morris et al. 2012) to those found in the WTCCC data sets. We note that this is not an independent replication study since the WTCCC data sets were included in the discovery cohorts; cases from the WTCCC data sets comprised at most 38% of the cases included in the discovery cohorts (Table S2). The replication data sets consist of 2000 cases for each disease and 3000 shared controls recruited from the United Kingdom and genotyped on the Affymetrix 500K GeneChip (WTCCC 2007).
Eight quality control steps were carried out for each of the four WTCCC data sets. Steps 1–7 were carried out using PLINK (Purcell et al. 2007) (version 1.07):
Markers with minor allele frequency <1% were removed.
Loci with a call rate ≤95% across individuals were removed.
Individuals with at least 5% missingness across all loci were removed.
Loci not in Hardy–Weinberg equilibrium were removed (P-value threshold of ).
Individuals were pruned based on inbreeding coefficient ().
Duplicate individuals were removed (one individual for each pair with ).
Related individuals were removed (one individual for each pair with ).
Individuals determined to be outliers by principal component analysis were removed. SmartPCA from the EIGENSOFT (Price et al. 2006) software package (version 4.0.2) was used to do PCA with outlier removal. Five iterations of outlier removal were performed with the outlier σ threshold = 6.
We conducted GWA analysis using PLINK (Purcell et al. 2007) (version 1.07) on the WTCCC data sets. SNP-level P-values were determined by logistic regression of disease state onto minor allele dosage, using the top four principal components as covariates in the logistic regression to control for ancestry.
GWA study simulation
To compare how well minSNP, SKAT, VEGAS, and PEGASUS can recover causal genes, we conducted a GWA study for a simulated complex phenotype with known genetic architecture based on the approach outlined in Wojcik et al. (2015) and applied these four methods to the simulated data (Figure S13). To choose causal genes, we picked four pathways with >20 genes each at random from the KEGG pathway database (Kanehisa 1997; Kanehisa et al. 2012). For each pathway, we randomly sampled 20% of its genes, resulting in 54 total causal genes. We ran Tagger (Haploview, Version 4.3) (Barrett et al. 2005) on each gene to find independent tag SNPs ( 0.2), using the WTCCC controls (N = 2900 individuals) as reference individuals to calculate LD. For each of the 54 causal genes, we chose 1, 2, or 5 tag SNPs to be associated with the phenotype, giving 123 total causal SNPs. All the chosen SNPs in each gene were randomly assigned an effect size of either 1.2 or 2 to simulate a range of effect sizes.
We then conducted GWA analysis using PLINK (Purcell et al. 2007) (version 1.07) on the WTCCC controls and the simulated phenotypes. SNP-level P-values were determined by logistic regression of minor allele dosage onto disease state. We used the top four principal components, determined by applying smartPCA (Price et al. 2006) to the genotypes, as covariates in the logistic regression to control for ancestry. To simulate spurious associations between SNPs and our associated phenotype, we added 20% of significant SNP P-values (144 new SNPs total) from an existing GWA study on CD (Franke et al. 2010) to our simulated GWA P-values; these spuriously associated SNPs did not overlap with SNPs already associated with simulated phenotype. By “spuriously associated” SNPs, we mean SNPs that achieve genome-wide significance (P-value ) but are not discussed or selected for replication studies, eQTL analysis, or other downstream analyses due to filtering steps. Such SNPs may be excluded based on criteria such as failure to achieve significance within a majority of the individual cohorts analyzed in a meta-analysis (Anderson et al. 2011), location within regions with complex LD or complex association patterns with the trait such as the MHC or TNFAIP3 regions for RA (Stahl et al. 2010), or P-value thresholds based on additional in silico analyses such as GRAIL (Raychaudhuri et al. 2009; Franke et al. 2010). Since the true causal genes underlying the simulated phenotype are known, we are able to measure true positive rate (TPR) and false positive rate (FPR) for each gene score method and used the following gene score thresholds: We find that our simulation results are robust to varying percentages of spuriously associated SNPs added and the GWA data set used (Figure S14).
Pathway analysis
We performed pathway analysis with HotNet2 (Leiserson et al. 2015), a topology-based method for finding significantly mutated subnetworks within protein–protein interaction networks, originally developed for analyzing somatic mutation data from cancer data sets. HotNet2 uses directed heat diffusion along interaction networks where every gene, represented by nodes in the network graph, has a “heat score” based on its gene score. We used negative log-transformed gene scores generated by PEGASUS, VEGAS, and minSNP as heat scores in HotNet2.
We use HotNet2 to find gene interaction subnetworks containing genes that we have highest confidence are truly associated with the phenotype. We found that HotNet2 does not perform well when too many genes are assigned similar heat scores, as will happen when the majority of genes have insignificant P-values. Thus, following the approach used in earlier applications of HotNet2 to somatic mutations in cancer, we assigned heat scores of zero to genes that we have low confidence are truly associated with the phenotype (Leiserson et al. 2015). To identify low-confidence genes, we compute a hard threshold based on local false discovery rates (lFDR) for the gene P-values. In a disease association setting, lFDR is the probability that a gene is not associated with the phenotype given its corresponding observed P-value; thus, can be thought of as “confidence.” When plotting confidence against gene scores (Figure S5 and Figure S6), an “elbow” or inflection point typically corresponds to a sharp drop in confidence; therefore, the inflection point is a natural choice for a gene score threshold. We compute the lFDRs for the gene scores using the twilight R package (Scheid and Spang 2005) (version 1.44.0). We calculate lFDR for minSNP, VEGAS, and PEGASUS gene scores and then determine a cutoff at the first elbow or inflection point in the graph of against gene scores where possible (Figure S5 and Figure S6). If the graph has no elbow point, as in the minSNP lFDR curves, we used the gene score corresponding to an lFDR cutoff of 0.05 (Figure S4). Since the cutoffs for the minSNP scores were greater than those calculated using PEGASUS and VEGAS gene scores, we ran HotNet2 twice: once using the PEGASUS lFDR threshold and once with the higher minSNP lFDR threshold. We assessed significance of HotNet2 results for each run by permuting the heat scores on genes to find a P-value for the number of subnetworks containing ≥k genes, as reported by HotNet2 (Leiserson et al. 2015).
HotNet2 analysis was performed using the HINT interaction network (Das and Yu 2012). Runs that had multiple P-values of varying size k in the permutation test were further studied, for example, by annotation using the Genome-wide Repository of Associations between SNPs and Phenotypes (GRASP) GWA study catalog (Leslie et al. 2014) to determine significance of the genes in previous GWA studies, along with functional annotations and literature searches.
Data availability
GWA P-values analyzed here (Table 2) can be accessed at the URLs given in Table S3. WTCCC data (WTCCC 2007) used in power simulations and replication studies can be accessed through the Wellcome Trust Case Control Consortium: http://www.wtccc.org.uk/. PEGASUS software and LD reference data are available online at the following URL: https://github.com/ramachandran-lab/PEGASUS. HotNet2 (Leiserson et al. 2015) software is available online at the following URL: https://github.com/raphael-group/hotnet2.
Results
Performance comparison of PEGASUS against minSNP, permSNP, SKAT, and VEGAS
We compared PEGASUS against minSNP (Torkamani et al. 2008; Fehringer et al. 2012; Gelernter et al. 2015; Hu et al. 2015), permSNP (Wang et al. 2007; Eleftherohorinou et al. 2009; Ballard et al. 2010; Christoforou et al. 2014; Evangelou et al. 2014; Backes et al. 2016), SKAT (Wu et al. 2010, 2011), and VEGAS (Liu et al. 2010) (Figure 2 and Figure S15), using several metrics to evaluate the different scores.
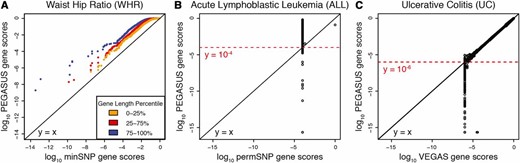
Quantile–quantile plots comparing gene scores produced by PEGASUS against those produced by minSNP, permSNP, and VEGAS. (A) Quantile–quantile plots of PEGASUS gene scores vs. minSNP gene scores. Each point represents a gene and is colored yellow, red, or blue based on gene length percentile, 0–25%, 25–75%, and 75–100%, respectively. The phenotype used is waist–hip ratio adjusted for body mass index (WHR). minSNP gene scores are smaller than PEGASUS gene scores and decrease with increasing number of SNPs in a gene. The deviations from show that minSNP scores are biased toward being smaller than PEGASUS scores, and this bias increases for increasing gene length (genes colored in blue and red). (B) Base-10 logarithm of PEGASUS gene scores vs. base-10 logarithm of permSNP gene scores for acute lymphoblastic leukemia (ALL). permSNP can determine gene scores only as low as the reciprocal of the number of permutations (10,000 in this case) whereas PEGASUS can determine gene scores as low as (the numerical precision of R). Note that the minimum permSNP scores of differ widely from their P-values computed by PEGASUS. (C) Base-10 logarithm of PEGASUS gene scores vs. base-10 logarithm VEGAS gene scores. Using 1 million simulations, the lowest gene scores output by VEGAS are while PEGASUS determines gene scores as low as In addition, for gene scores close to the reciprocal of the maximum number of simulations performed, VEGAS can return inaccurate gene scores compared to PEGASUS.
We find that, for all 12 GWA data sets analyzed, minSNP gene scores are almost always smaller than PEGASUS gene scores (Figure 2A and Figure S1). We also find that minSNP gene scores show a clear dependence on gene length; as the number of SNPs in a gene increases, the minSNP gene score decreases for all data sets analyzed. In contrast, PEGASUS gene scores do not show this trend (Figure 2A, Figure S2, and Figure S16).
We tested whether two corrections to minSNP gene scores mitigated its bias with gene length: (i) calculating P-values for minSNP gene scores from the Beta(1, no. of SNPs in gene) distribution (note that minSNP can be thought of as the first-order statistic for SNP P-values) and (ii) multiplying minSNP gene scores by the number of SNPs in a gene. Both corrections resulted in gene scores that decrease with increasing gene length (Figure S7 and Figure S8).
Since permSNP requires genotype data and is computationally expensive, permSNP was carried out only on the ALL data set (Xu et al. 2013), using 10,000 permutations; thus, there is large variation in PEGASUS gene scores at a permSNP gene score of (Figure 2B). Further, permSNP is extremely computationally costly: Carrying out permSNP on a random subset of 400 genes took ∼6 hr. Thus, permSNP would be extremely computationally inefficient for analyzing a genome-wide human data set (∼18,000–20,000 genes).
Since SKAT requires genotype data, SKAT was carried out on the ALL (Xu et al. 2013) and the WTCCC T2D (WTCCC 2007) data sets, using the top four principal components from PCA on these data sets as covariates. We find that PEGASUS gene scores and SKAT gene scores are correlated ( and P-values and for ALL and T2D, respectively) for both data sets (Figure S15, A and B). We also find that PEGASUS gene scores and unweighted SKAT gene scores are correlated ( and P-values and for ALL and T2D, respectively) (Figure S15, C and D).
Compared to VEGAS, our method has increased numerical precision when calculating gene scores (Figure 2C). Due to its underlying Monte Carlo simulations ( by default), VEGAS does not calculate gene scores less than the reciprocal of the number of simulations. However, PEGASUS can evaluate gene scores to the machine precision of R, which is In addition, VEGAS gene scores become inaccurate close to due to the random nature of Monte Carlo simulations (Figure 2C), whereas PEGASUS does not have a stochastic element. We find that VEGAS produces less numerically precise gene scores than PEGASUS in all 12 data sets analyzed (Figure S3). We also find that PEGASUS runs twice as fast as VEGAS when using HapMap data (Frazer et al. 2007) (Phase 2) as references for LD.
Enrichment for known associations in real data
To assess how well minSNP and PEGASUS recover known GWA associations, we calculated the percentage of genes with significant minSNP and PEGASUS gene scores () for the 12 phenotypes in this analysis that have been found to be significantly associated (SNP-level ) with the disease or trait in GWA studies conducted with different genotype data (Figure 3). Taking known associations to be “true positives,” we calculated positive predictive values (PPV) for every gene score for every disease. We find that in 10 of 12 data sets, significantly associated PEGASUS gene hits () have higher PPV than minSNP gene hits by as much as 2.8-fold, showing that PEGASUS gene hits are enriched for known associations in comparison to minSNP (Figure 3). For the remaining two disorders, attention-deficit/hyperactivity disorder (ADHD) and major depressive disorder (MDD), minSNP identifies significantly associated genes () that have not been found in other GWA studies while PEGASUS does not report any findings (Figure 3).
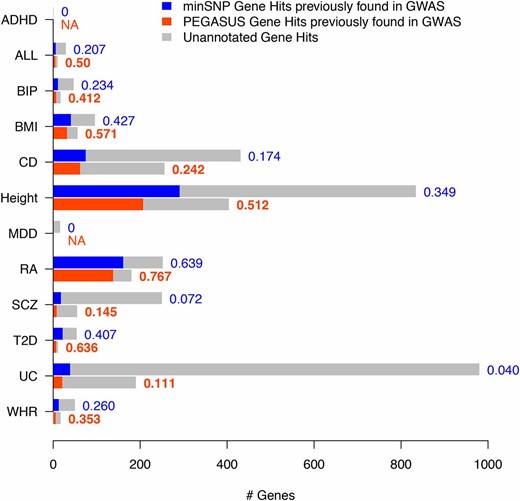
PEGASUS gene hits are enriched for known GWA study associations compared to minSNP gene hits. Shown are the numbers of minSNP gene hits (blue) and PEGASUS gene hits (orange) that contain known GWA study associations and gene hits not previously found in GWA studies (gray) for 12 GWA study data sets. To the right of each bar are positive predictive values (PPV) for each gene score for every data set; where possible, boldface type indicates the gene score with the highest PPV for each disease and “NA” means that PPV is undefined, which occurs when there are zero gene hits. A gene hit is a gene with a score of and known GWA study associations are genes containing genome-wide significant SNPs in GWA studies conducted with different data sets from the 12 data sets analyzed here. We find that PEGASUS gene hits have as much as 2.8-fold higher PPV than minSNP gene hits.
Replication of PEGASUS gene hits in WTCCC data
We attempted to replicate gene hits () generated by PEGASUS for four data sets (BIP, CD, RA, and T2D) for which we have genotype data from the WTCCC (WTCCC 2007). We note that our replication cohorts (WTCCC) were included in the discovery cohorts, and thus this is not an independent replication. We find that we are able to replicate up to 57.2% of gene hits in the case of RA and as low as 0 gene hits in the BIP data set (Table S2). We note that the four meta-analyses we consider our “discovery cohorts” are composed of much larger sample sizes than our replication data sets and thus had greater power to identify associated variants. Further, we do not necessarily follow the same steps for quality control and ancestry correction in our GWA study as did the meta-analyses reanalyzed here (see Materials and Methods), which may explain our low percentage of replicated significant genes for BIP and CD.
Power analysis using simulated GWA data
To compare how well minSNP, SKAT, VEGAS, and PEGASUS can recover causal genes, we conducted gene-level tests for association, using these methods on a GWA study for a simulated phenotype calculated from a model of additive genetic effects. PEGASUS and VEGAS outperform minSNP with a 30% TPR when the FPR is fixed at 1%, and PEGASUS and VEGAS outperform SKAT with 28% higher TPR when FPR is fixed at 1% (Figure 4). We find that minSNP, when applied to the GWA data sets in Table 2, outputs high numbers of significant genes (genes with ). For example, as many as 5.5% of all genes (lower bound: 0.01%) are below the Bonferroni-corrected threshold for significance when using minSNP across the 12 data sets we analyzed (Table S1). In our simulation, we find that the high FPR in minSNP is due to genes with spurious SNP association P-values added in as part of the simulation. This suggests that some minSNP gene hits in observed GWA studies are spurious associations as well. By correcting for LD, PEGASUS and VEGAS are able to ignore these false positives (Figure 4). At very low FPR (), SKAT is the most sensitive method, but SKAT has lower sensitivity overall. This could be a desirable feature if one is looking for a small number of reliable gene hits. However, for pathway/network analysis, it is useful to obtain high sensitivity, as the pathway/network information will help reduce the remaining false positives. We were unable to add in spurious SNP association P-values for the SKAT method since this test requires genotype data; however, inclusion of these SNPs could only decrease the performance of SKAT in simulation.
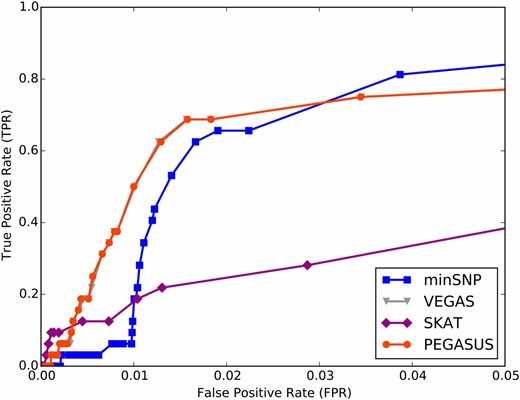
Receiver operating characteristic (ROC) curves from GWA conducted with simulated phenotypes show gene scores controlling for LD achieve higher true positive rates at low false positive rates. We performed a GWA study for a simulated phenotype with known underlying true causal genes (see Materials and Methods) and determined true positive rate (TPR; genes truly associated with phenotype that were identified as such) and false positive rate (FPR; genes identified as causal by a gene score method that were not truly associated with the simulated phenotype) for minSNP, VEGAS, SKAT, and PEGASUS for various gene score thresholds (see Materials and Methods). We find that PEGASUS and VEGAS, which control for pairwise correlations between SNPs within genes, outperform minSNP and SKAT with higher TPRs at very low FPRs.
The downstream effect of gene scores on pathway analysis
Using gene scores generated from minSNP, VEGAS, and PEGASUS as input to HotNet2 (Leiserson et al. 2015), we performed pathway analysis on each of the 12 GWA data sets. We find significantly associated gene subnetworks for ADHD, ulcerative colitis (UC), and waist–hip ratio adjusted for body mass index (WHR). Figure 5 shows a selection of subnetworks containing known or biologically plausible gene associations for these three phenotypes based on previous GWA or functional studies. Other significantly associated subnetworks can be found in Figure S9 and Figure S12.

Subnetworks for ulcerative colitis (A–C), attention-deficit/hyperactivity disorder (D–F), and waist–hip ratio adjusted for body mass index (G and H) from significant runs of HotNet2 (Leiserson et al. 2015) ( for multiple subnetwork sizes), using PEGASUS gene scores as input. Circles represent genes in each subnetwork and are colored by heat score (negative log-transformed PEGASUS gene scores); the color bar indicates the lowest heat score (blue or “cold” genes) and the highest heat score (red or “hot” genes) in each subnetwork for a given phenotype. Lines between genes indicate a direct gene–gene interaction from the HINT database (Das and Yu 2012). Gene names that are underlined, in boldface type, and italicized represent genes that have been previously associated with the ulcerative colitis (Duerr et al. 2006; Raelson et al. 2007; WTCCC 2007; Barrett et al. 2008; Silverberg et al. 2009; Franke et al. 2010; McGovern et al. 2010; Anderson et al. 2011; Festen et al. 2011; Ellinghaus et al. 2012; Jostins et al. 2012; Scharl et al. 2012; Parkes et al. 2013), attention-deficit/hyperactivity disorder (Wan et al. 1998; Maden 2007; Davis et al. 2008; Naka et al. 2008; McGrath et al. 2009; Need et al. 2009; Chen et al. 2010; Cirulli et al. 2010, 2012; Fuentealba et al. 2010; Neale et al. 2010; Hu et al. 2011; Luciano et al. 2011; Tang et al. 2011; De Jager et al. 2012; Rivière et al. 2012; Schuurs-Hoeijmakers et al. 2012; Peixoto and Abel 2013; Rietveld et al. 2013), and waist–hip ratio (Cantile et al. 2003; Eguchi et al. 2008, 2011; Guth et al. 2009; Hagberg et al. 2010; Heid et al. 2010; Siervo et al. 2012; Tchkonia et al. 2013; Karpe and Pinnick 2015) phenotypes in GWA or functional studies.
PEGASUS identifies multiple subnetworks containing genes with known associations to each phenotype of interest. Some of these subnetworks are not found when using minSNP and VEGAS gene scores as input to HotNet2 (Figure S10 and Figure S11). We also identify subnetworks associated with ADHD (Figure 5, D–F), a disorder for which GWA studies have not identified any SNPs with genome-wide significance. We detail our findings for each disease or trait below.
UC:
Inflammatory bowel disease (IBD), an inflammatory disease of the gastrointestinal tract, has two major subtypes: UC and CD. IBD is hypothesized to result from dysregulated T-cell immune responses to commensal enteric bacteria in the gut that develop in individuals who are genetically predisposed to the disease. Environmental factors also play an important role in triggering onset or recurrence of symptoms (Sartor 2006; Lee et al. 2012). UC is characterized by superficial, ulcerating inflammation that is limited to the colon (Christophi et al. 2012).
HotNet2 analysis using PEGASUS scores identifies a subnetwork containing several genes in JAK2-STAT signaling pathways as associated with UC disease state (Figure 5A). The subnetwork in Figure 5A contains the genes JAK2, IL12RB2, IFNG, PTPN2, and STAT4, which all have genome-wide significant SNP hits (SNP P-value ) in GWA studies for IBD (Duerr et al. 2006; Jostins et al. 2012). The gene IFNG also has genome-wide significant SNPs in GWA studies for ulcerative colitis conducted with different data sets from the data set used in this study and (Silverberg et al. 2009; McGovern et al. 2010). The following genes shown in this subnetwork have also been significantly associated (SNP P-value ) with CD (CD alone or in concert with psoriasis or celiac disease) in other GWA studies: JAK2, IL12RB2, SOCS1, and PTPN2 (Raelson et al. 2007; WTCCC 2007; Barrett et al. 2008; Franke et al. 2010; Festen et al. 2011; Ellinghaus et al. 2012). Two closely related pro-inflammatory cytokine signaling pathways involve many genes shown in this subnetwork: the interleukin (IL)-23/type 17 helper T-cell () signaling pathway and the IL-12/type 1 helper T-cell () signaling pathway. Both signaling pathways ultimately result in cytokine-mediated gut destruction (Wang et al. 2010; Parkes et al. 2013).
Similar pathways centered around IL-12, IL-23, and JAK2-STAT signaling have been manually compiled based on GWA studies for CD and IBD (Wang et al. 2010; Parkes et al. 2013). In addition, the subnetwork (Figure 5A) contains the gene PTPN2, which encodes protein tyrosine phosphatase nonreceptor type 2 (PTPN2) and has been shown to regulate autophagy in human intestinal epithelial cells; knockdown of PTPN2 caused impaired autophagosome formation and dysfunctional autophagy that eventually resulted in increased apoptosis of intestinal cells in response to IFNG and tumor necrosis factor-α (Scharl et al. 2012). This subnetwork illustrates interactions between multiple genes involved in the immune response to pathogens that may underlie the pathology of ulcerative colitis.
The subnetwork we identify in Figure 5B shows interactions between the human leukocyte antigen (HLA) class I genes and transporter associated with antigen processing (TAP) genes. These genes are thought to underlie IBD pathology as well as other immune-mediated disorders such as psoriasis and ankylosing spondylitis (Parkes et al. 2013). Finally, HotNet2 reports a significantly associated subnetwork containing genes that are part of the tumor necrosis factor (TNF) signaling pathway (Figure 5C). TNF signaling results in activation of nuclear factor kappa-light-chain enhancer of activated B cells (NF-κB), which is a known inflammatory response in IBD (Anderson et al. 2011). Additional significant gene subnetworks are shown in Figure S12.
We emphasize that neither the JAK2-STAT subnetwork (Figure 5A) nor the HLA class 1 and TAP genes (Figure 5B) are found when using VEGAS gene scores as input to HotNet2 (Figure S11), demonstrating the importance of high-precision gene scores in downstream analysis.
ADHD:
ADHD is a highly heritable neuropsychiatric disorder characterized by the following traits: inattention, hyperactivity, and impulsivity (Franke et al. 2009). It is thought to be a very complex multifactorial trait and, despite high heritability estimates (76%) (Neale et al. 2010), it has been difficult to find genes underlying the phenotype. GWA studies with very large sample sizes have been performed, yet no variants have reached genome-wide significance (Franke et al. 2009).
Using PEGASUS gene scores as input to HotNet2, we find five significantly associated gene subnetworks associated with ADHD (Figure 5 and Figure S9). Figure 5D includes interactions between multiple genes previously associated with cognition-related traits and neurodevelopmental disorders. RPS6KA5, PDZD2, and RAI1 are associated with years of education (GWA SNP P-values of and respectively) (Rietveld et al. 2013). The genes RPS6KA5, PDZD2, and ST3GAL3 have also been associated () with performance on multiple tests of cognitive function and memory in previous GWA studies (Need et al. 2009; Cirulli et al. 2010, 2012; Luciano et al. 2011; De Jager et al. 2012). In particular, RPS6KA5, which encodes ribosomal protein S6 kinase alpha-5, is part of a pathway involved in brain-derived neurotrophic factor (BDNF)/neurotrophin signaling; BDNF and other neurotrophins are important in neural development, learning, and memory and are implicated in neurodegenerative diseases such as Huntington’s, Alzheimer’s and Parkinson’s (Tang et al. 2011). RPS6KA5 is also thought to be a part of the upstream pathway involved in learning-dependent chromatin remodeling, which is important in long-term memory formation (Peixoto and Abel 2013). In addition, the gene PDLIM1 has been found to have strong maternal transmission in trios where the child is affected with ADHD, and PDLIM1 has been shown to play a role in Alzheimer’s disease (Wang et al. 2012). A linkage study for intellectual disability found mutations in the ST3GAL3 gene (Hu et al. 2011), and mutations in the ACTG1 gene cause Baraitser–Winter syndrome, a developmental disorder affecting the face and brain (Rivière et al. 2012). Taken together, multiple studies suggest that genes in this subnetwork we identified using PEGASUS and HotNet2 are involved in regulatory processes that affect neural development, learning, and memory.
The second subnetwork (Figure 5E) contains FURIN and other genes that play important roles in cell trafficking processes that may be involved in the pathology of neuropsychiatric and cognitive disorders such as Alzheimer’s disease and intellectual disability (Wan et al. 1998; Fuentealba et al. 2010; Schuurs-Hoeijmakers et al. 2012; Carlino et al. 2013). A third subnetwork (Figure 5F) contains genes that are likely involved in brain development (Maden 2007). Two additional subnetworks found by HotNet2 using PEGASUS scores contain genes that play regulatory roles in neurogenesis and responses to stress (Figure S9A) and genes associated with other social and behavioral abnormalities (Figure S9B). Additional information about genes in these subnetworks can be found in Text S2.
WHR adjusted for body mass index:
WHR adjusted for body mass index (BMI) is a quantitative trait that measures body fat distribution. Both WHR and BMI are heritable traits (25–70% heritability), but mechanisms underlying body fat distribution are still unclear (Baker et al. 2005). WHR is a useful trait for predicting risk for T2D and heart disease since it accounts for waist and hip size, which both have associations with these traits (Heid et al. 2010). Increasing waist size is associated with increased risk for T2D and heart disease, but gluteal fat deposits play a protective role against T2D, hypertension, and dyslipidemia (Heid et al. 2010; Shungin et al. 2015).
HotNet2 analysis with PEGASUS gene scores identifies two subnetworks with interactions between genes known to be associated with WHR that may shed light on the genetic determination of body fat distribution. Figure 5G displays a subnetwork of homeobox (HOX) genes, a family of transcription factors that play an important role in morphogenesis in animals (Zhang et al. 2007). The complete HOX gene network was found to be active in human white adipose tissue and fetal brown adipose tissue (Cantile et al. 2003). HOX genes contained in this subnetwork include HOXA9, HOXC11, HOXA11, and EMX2. Multiple studies of gene expression in human subcutaneous abdominal adipose tissue and gluteal adipose tissue found that the HOXA9 gene has increased expression in abdominal adipose tissue; MEIS1, which encodes a HOX cofactor and is also contained in this subnetwork, was also expressed more in abdominal adipose tissue than in gluteal depots in men only (Karpe and Pinnick 2015). In contrast, HOXC11 and HOXA11 have increased gene expression in gluteal adipose tissue than in abdominal adipose tissue (Karpe and Pinnick 2015). HOXA9 and EMX2, another homeobox gene, were induced after extreme weight loss following bariatric surgery (Tchkonia et al. 2013). The subnetwork shows SOX8, which encodes a transcription factor thought to play a role in development; mice deficient in SOX8 develop surprisingly normally, but undergo a severe degeneration of adipose tissue as adult mice (Guth et al. 2009). Guth et al. (2009) posit that SOX8 plays a role in adipocyte development, especially during replenishment of the adipocyte pool in adult mice. IRF4 is also contained in this subnetwork and encodes interferon regulatory factor 4 (IRF4), which is part of a family of transcription factors that are involved in various immune functions including regulation of innate immunity via the Toll-like receptor (TLR) signaling pathway (Eguchi et al. 2011). Many IRF proteins including IRF4 are also expressed in preadipocytes and mature adipocytes; their function is to repress adipogenesis (Eguchi et al. 2008). Eguchi et al. (2011) find that knockout mice lacking IRF4 in adipocytes display excess adiposity and resistance to lipolysis induced by catecholamines, fasting, or cold exposure, suggesting that IRF4 plays an important role in transcriptional regulation of lipid handling in fat. These findings indicate that this subnetwork may play an important role in development of adipocytes and fat distribution.
The second subnetwork found by HotNet2 (Figure 5H) elucidates the interactions of VEGFA, which contains a known GWA study association for WHR (SNP P-value ) and VEGFB, which is moderately associated with WHR (SNP P-value ) (Heid et al. 2010). Additional information about this subnetwork can be found in Text S3.
We also conducted HotNet2 analysis using minSNP gene scores for all phenotypes studied here. Since minSNP gene scores are misleadingly small (Figure 2A, Figure S2, and Figure S16), single highly significant genes pull in many unrelated genes with low gene scores to create artifactual “star-shaped” subnetworks that are likely false positives (see Figure S10 for HotNet2 results using minSNP gene scores for ulcerative colitis).
Discussion
Here we present a new approach for identifying geno–phenotype associations from case–control data that combines a novel gene score, PEGASUS, with network-based analyses using HotNet2 (Leiserson et al. 2015). PEGASUS computes gene scores that measure the statistical association of a gene with a phenotype of interest and has multiple advantages over commonly used methods for generating gene scores.
First, PEGASUS analytically models LD among SNPs within genes, producing a computationally efficient method that yields precise results—gene scores as small as (the machine precision of R). By modeling linkage disequilibrium, PEGASUS, like VEGAS (Liu et al. 2010), is sensitive to genes with multiple SNPs that are moderately associated with the phenotype of interest. Unlike existing methods, our gene scores are not biased by gene length or poor precision. In the future, our approach can be extended to combine SNP-level P-values within linkage blocks in contrast to the gene boundaries used in this study.
Second, we apply PEGASUS to 12 genome-wide association studies for complex diseases and traits and, in 10 of 12 studies, our significant gene scores () enrich for genes known to be associated with the phenotypes of interest (Figure 3). In simulation studies, we find that modeling fine-scale LD (or pairwise correlations between SNPs within genes), as in the PEGASUS and VEGAS methods, produces gene scores with much higher true positive rates of identifying genes associated with the simulated phenotype than does using minSNP (Figure 4). Thus, PEGASUS can be applied after conducting a GWA study to prioritize genes for functional validation.
Third, because our approach precisely assesses the statistical association of a gene with a phenotype of interest, PEGASUS offers the opportunity to identify novel sets of interacting genes underlying complex phenotypes via pathway or network analysis with our gene scores as input. Complex phenotypes may be generated via mutations in a subset of genes in a predefined gene set [such as the gene sets used in gene set enrichment analysis (Subramanian et al. 2005)] or via crosstalk between gene sets or pathways. To identify novel subnetworks of genes associated with each of the complex phenotypes analyzed in this study, we used gene scores generated by PEGASUS as input to HotNet2 (Leiserson et al. 2015); this is the first application of HotNet2 to common genetic variation. In our network analyses, minSNP and VEGAS miss key subnetworks containing genes known to be associated with the phenotype of interest (Figure 5, A and B, ulcerative colitis).
Fourth, in ADHD, a disease for which large GWA studies ( individuals) have not identified genome-wide significant associations (Franke et al. 2009; Neale et al. 2010), we identify significant subnetworks of interacting genes () that are involved in neural development and learning and cognition. As knowledge of the human interactome continues to improve, post hoc analysis of GWA studies using gene scores from PEGASUS in conjunction with HotNet2 has the potential to generate promising hypotheses for functional validation.
Finally, we argue that human genetics would benefit greatly if more GWA studies released all SNP-level P-values generated, instead of reporting a subset of P-values the authors consider to be of interest. The present situation, where only the genotypes are deposited in public repositories under managed access, makes it impossible to replicate the various filtering, quality control, ancestry correction, and other steps that lead from raw genotype calls to the handful of genome-wide significant SNPs reported in publications. Of course, participant confidentiality requirements may limit the public distribution of SNP P-values (Masca et al. 2011), but P-values could be released with the genotype data under a managed access model. If these summary statistics were routinely released, gene score methods like PEGASUS, network/pathway analyses like HotNet2 (Leiserson et al. 2015), and other computational innovations from the community could be more widely applied to yield new insight into the genomic underpinnings of complex diseases and traits.
Acknowledgments
We thank the Psychiatric Genomics Consortium, the Genetic Investigation of Anthropometric Traits Consortium, the International Inflammatory Bowel Disease Genetics Consortium, the Diabetes Genetics Replication and Meta-analysis Consortium, and the Broad Institute for making full genome-wide association (GWA) P-values data sets available for public download. We also thank Heng Xu, Virginia Perez-Andreu, and Jun J. Yang from the St. Jude Children’s Research Hospital for providing full GWA P-values and genotype data from their multiethnic acute lymphoblastic leukemia GWA study (Xu et al. 2013) and for help with curating the raw genotype data. We gratefully acknowledge Max Leiserson and Jonathan Eldridge for assistance with HotNet2 analysis; Matt Reyna, Julia Palacios, and Lauren A. Sugden for helpful discussions; and Genevieve Wojcik for providing software and help with GWA simulations. We also thank Chris Cotsapas for helpful discussions. B.J.R. is supported by a Career Award at the Scientific Interface from the Burroughs Wellcome Fund, an Alfred P. Sloan Research Fellowship, U.S. National Science Foundation (NSF) grant IIS-1016648, an NSF CAREER award (CCF-1053753), and U.S. National Institutes of Health (NIH) grants R01HG007069 and R01CA180776. P.N. is supported by an Oliver Cromwell Gorton Arnold predoctoral fellowship from Brown University and by NSF CAREER award DBI-1452622 (to S.R.). S.R. is also supported by NIH grant R01GM118652, the Pew Charitable Trusts as a Pew Scholar in the Biomedical Sciences, and an Alfred P. Sloan Research Fellowship.
Footnotes
Communicating editor: E. Eskin
Supplemental material is available online at www.genetics.org/lookup/suppl/doi:10.1534/genetics.116.188391/-/DC1.
Literature Cited
Lee, S., L. Miropolsky, and M. Wu, 2015 Skat: Snp-Set (Sequence) Kernel Association Test. R package version 1.1.2. Available at: https://CRAN.R-project.org/package=SKAT.
Rivière, J.-B., B. W. M. van Bon, A. Hoischen, S. S. Kholmanskikh, B. J. O’Roak, et al., 2012 De novo mutations in the actin genes ACTB and ACTG1 cause Baraitser-Winter syndrome. Nat. Genet.
