


Abstract
Parent-of-origin-effect loci have non-Mendelian inheritance in which phenotypes are determined by either the maternal or paternal allele alone. In angiosperms, parent-of-origin effects can be caused by loci required for gametophyte development or by imprinted genes needed for seed development. Few parent-of-origin-effect loci have been identified in maize (Zea mays) even though there are a large number of imprinted genes known from transcriptomics. We screened rough endosperm (rgh) mutants for parent-of-origin effects using reciprocal crosses with inbred parents. Six maternal rough endosperm (mre) and three paternal rough endosperm (pre) mutants were identified with three mre loci mapped. When inherited from the female parent, mre/+ seeds reduce grain fill with a rough, etched, or pitted endosperm surface. Pollen transmission of pre mutants results in rgh endosperm as well as embryo lethality. Eight of the mutants had significant distortion from the expected one-to-one ratio for parent-of-origin effects. Linked markers for mre1, mre2, and mre3 indicated that the mutant alleles have no bias in transmission. Histological analysis of mre1, mre2, mre3, and pre*-949 showed altered timing of starch grain accumulation and basal endosperm transfer cell layer (BETL) development. The mre1 locus delays BETL and starchy endosperm development, while mre2 and pre*-949 cause ectopic starchy endosperm differentiation. We conclude that many parent-of-origin effects in maize have incomplete penetrance of kernel phenotypes and that there is a large diversity of endosperm developmental roles for parent-of-origin-effect loci.
THE maternal and paternal parents have different genetic and epigenetic contributions to angiosperm seed development. Angiosperm seeds result from the double fertilization of two multicellular gametophytes (Walbot and Evans 2003). In diploid species, gametophytes grow from the haploid products of meiosis with the male and female gametophytes following different developmental programs. The male gametophyte or pollen grain, delivers two haploid sperm cells through the pollen tube to fertilize the female gametophyte. Fertilization of the egg forms a diploid zygote, and fertilization of the two central cell nuclei forms a triploid endosperm cell. The central cell and egg cell provide the vast majority of cytoplasm for the nascent endosperm and the zygote. In addition, the central cell genome has more open chromatin, and there is substantial evidence for a dominant maternal role to initiate the coordinate development of the endosperm and embryo (Baroux and Autran 2015; Borg and Borg 2015; Del Toro-De Leon et al. 2016).
Mutations in loci specific to the development of either gametophyte are expected to show non-Mendelian inheritance such as reduced transmission and maternal effect seed phenotypes. Only a few maize seed mutants have been identified with maternal effects, and most of these mutants primarily affect gametophyte development. The indeterminate gametophyte1 (ig1) locus encodes a LATERAL ORGAN BOUNDARIES (LOB) domain transcription factor that is required to limit cell divisions in the female gametophyte (Kermicle 1971; Evans 2007). Plants that are heterozygous for ig1 give a high frequency of defective kernels when pollinated with normal inbred lines. Similarly, baseless1 (bsl1) heterozygous plants will segregate near 1:1 defective kernels when pollinated with inbred pollen (Gutierrez-Marcos et al. 2006). The polar nuclei of the bsl1 central cell are not positioned correctly in the female gametophyte, indicating defective embryo sac development is likely to alter kernel development. The maize stunter1 (stt1) locus shows a low frequency of small kernels when fertilized with normal pollen (Phillips and Evans 2011). Mutant stt1 embryo sacs are reduced in size and appear delayed in development. Both bsl1 and stt1 show reduced transmission through the male, suggesting additional roles in the development of male gametophytes.
As the seed grows, the endosperm supplies nutrients and signals to promote embryo development (Yang et al. 2008; Xing et al. 2013; Costa et al. 2014). The two maternal copies of the genome in the endosperm create a gene dosage difference, with maternal alleles expected to provide twice as much gene product as paternal alleles. Despite these differences in gene dosage, mutations in loci required for seed development typically segregate at ratios consistent with Mendelian recessive mutations (Neuffer and Sheridan 1980; Scanlon et al. 1994; McElver et al. 2001; McCarty et al. 2005). This pattern of inheritance indicates that a single dose of a normal allele from pollen is expressed sufficiently for most genes essential for seed development. Detailed analysis of recessive seed mutants in Arabidopsis indicates that wild-type paternal alleles are in some cases delayed in expression, as measured by genetic complementation of mutant phenotypes, relative to the maternal allele (Del Toro-De Leon et al. 2014). Thus, maternal allele expression can be dominant immediately after fertilization, but most genes required for seed development are supplied by both parents.
By contrast, there are genes that have parent-of-origin specific patterns of seed expression known as imprinting (Gehring et al. 2011; Hsieh et al. 2011; Luo et al. 2011; Waters et al. 2011, 2013; Wolff et al. 2011; Zhang et al. 2011, 2014; Xin et al. 2013). Imprinted genes are epigenetically regulated such that gene expression is biased as either paternally expressed genes (PEGs) or maternally expressed genes (MEGs). Like gametophyte mutants, mutations in imprinted loci required for seed development are expected to show non-Mendelian segregation. In Arabidopsis, these parent-of-origin effects can manifest as mutants with half seed set, such as 1:1 segregation for defective seeds or aborted ovules. Molecular studies of Arabidopsis maternal-effect loci identified the FERTILIZATION INDEPENDENT SEED Polycomb Repressor Complex 2 (FIS-PRC2) as a primary regulator of early endosperm development (Ohad et al. 1996; Chaudhury et al. 1997; Grossniklaus et al. 1998; Kiyosue et al. 1999; Kohler et al. 2003). FIS-PRC2 trimethylates lysine 27 on histone H3 to add repressive chromatin marks, which are required for imprinted patterns of gene expression (Kohler et al. 2012). Mutants in FIS-PRC2 allow central cell divisions prior to fertilization and cause aberrant endosperm and embryo development. Even though most of the Arabidopsis FIS-PRC2 subunits have a MEG pattern of gene expression, the primary seed defect results from the loss of the complex in the female gametophyte (Leroy et al. 2007). Mutations in additional Arabidopsis MEG and PEG loci have been identified with few showing seed phenotypes (Bai and Settles 2015; Wolff et al. 2015).
In maize, the maternally expressed gene1 (meg1) is imprinted during the early stages of basal endosperm transfer layer (BETL) development and is expressed from both maternal and paternal alleles later in development (Gutierrez-Marcos et al. 2004). The BETL transfers nutrients from the maternal to filial tissues, and meg1 encodes a small peptide that promotes differentiation of the BETL (Costa et al. 2012). Maternal control of meg1 provides a mechanism to determine the size of the BETL, thereby influencing sink strength of individual developing kernels. The maternal effect lethal1 (mel1) locus in maize may also identify a maternal factor that determines grain fill (Evans and Kermicle 2001). Plants heterozygous for mel1 show a variable frequency of reduced grain-fill kernels, but these are unlikely to be caused by the female gametophyte, as no embryo sac defects are apparent in the mutant. Molecular studies of mel1 have been limited, because the mutant is only expressed in a single inbred background and requires at least two sporophytic enhancer loci.
Despite being maternal effect loci, both stt1 and mel1 can have a frequency of defective kernels well below the 1:1 ratio expected for a parent-of-origin-effect locus. Here we report a systematic genetic approach to identify maize parent-of-origin-effect loci even with a variable expressivity and low penetrance of seed developmental defects. A screen of 193 defective kernel mutants showing rough endosperm (rgh) phenotypes identified six maternal-effect (mre) and three paternal-effect (pre) loci. Mapping of three mre mutants indicates that these are new parent-of-origin-effect loci with all loci having normal transmission through both male and female gametes. Characterization of the mutant developmental phenotypes reveals that parent-of-origin-effect mutants can result in aberrant differentiation of specific endosperm cell types as well as delayed endosperm differentiation.
Materials and Methods
Genetic stocks
All genetic experiments were completed at the University of Florida Plant Science Research and Education Unit in Citra, FL or greenhouses located at the Horticultural Sciences Department in Gainesville, FL. For the parent-of-origin-effect screen, normal seeds were planted from segregating self-pollinations of 193 independent rgh mutants isolated in the UniformMu transposon-tagging population (McCarty et al. 2005). Each mutant isolate was self-pollinated and crossed onto the B73 and Mo17 inbred lines. Pollen from B73 and Mo17 was crossed onto the second ears of mutant isolates when possible. All crosses were screened for rgh kernel phenotypes, and the frequency of rgh phenotypes were compared between inbred crosses and segregating self-pollinations. Putative mre and pre mutants were sown in a subsequent generation and reciprocal crosses were completed with the W22 inbred line.
Backcross (BC1) mapping populations were developed by crossing F1 hybrids with both inbred parental lines. For example, Mo17 × mre1/+ F1 progeny were crossed reciprocally with Mo17 and W22. BC1 ears that segregated for the mre phenotype were then used for molecular mapping and transmission analysis.
Mature and developing kernel phenotype analysis was completed with mutant by W22 inbred crosses with plants segregating for mre or pre genotypes. The mre/+ × W22 pollinations were dated and sampled; second ears were crossed and scored for mre phenotypes at maturity. For W22 × pre*-949/+ developmental analysis, plants segregating for pre*-949/+ genotypes were crossed onto two W22 plants with one pollination scored for pre*-949 phenotypes at maturity.
Mature kernel phenotypes
Segregating mre/+ and +/pre crosses with the W22 inbred were visually sorted into mutant and normal sibling kernels. Single-kernel near-infrared reflectance (NIR) spectroscopy was used to predict quantitative kernel traits for 96 normal and 96 mutant kernels of each isolate (Gustin et al. 2013). Predicted traits include: weight (milligrams), % oil, % protein, % starch, seed density (grams per cubic centimeters), material density (grams per cubic centimeters), seed volume (cubic millimeters), and material volume (cubic millimeters). Sagittal sections of mature kernels were cut with a fixed-blade utility knife and imaged on a flatbed scanner.
Molecular mapping
BC1 progeny from crosses mre1/+ × Mo17, mre2/+ × B73, and mre3/+ × Mo17 were sorted for rgh phenotypes. DNA was extracted as described (Settles et al. 2004) from individual rgh kernels as well as normal sibling pools of 12 kernels per pool. For mre1, simple sequence repeat markers (SSRs) were selected from prescreened SSRs to have one polymorphic marker per chromosome arm (Martin et al. 2010). Each marker was amplified from 24 rgh kernels and scored for recombination. Segregation distortion was found for umc1294. Two linked markers, umc1164 and phi021, were amplified and scored to determine the region for fine mapping. For mre2 and mre3, DNA was extracted from 36 BC1 rgh kernels for each mutant. Each DNA sample was genotyped using the Sequenom MassARRAY platform at the Iowa State University Genomic Technologies Facility as described (Liu et al. 2010) except that a subset of 144 distributed single nucleotide polymorphism (SNP) markers were genotyped for each sample. Recombination frequencies for each marker were used to identify regions that had significant distortion for fine mapping. Additional SSR markers and insertion–deletion polymorphism (InDel) markers were screened for the fine-mapping regions on chromosomes 4, 6, and 10 as described (Settles et al. 2014). DNA was extracted from expanded BC1 populations, amplified, and scored for recombination. Primer sequences for SSR and InDel markers are given in Supplemental Material, Table S2.
Transmission assay
F1 hybrids of mre1 with Mo17, mre2 with B73, and mre3 with Mo17 were reciprocally crossed to generate BC1 progeny with heterozygotes as either the male or female parent. The crosses were screened for mre phenotypes to select heterozygous F1 individuals for transmission analysis. For each cross, 100 BC1 kernels were systematically sampled from kernel rows along the tip-to-base axis of the ear. Transmission of the mutant locus was scored using linked markers proximal and distal to each mutant locus. Primer sequences for the molecular markers are in Table S2.
Histochemical staining of developing seeds
Developing ears were harvested from 6 to 19 days after pollination (DAP) of mre1/+ × W22, mre2/+ × W22, mre3/+ × W22, and W22 × +/pre*-949. Harvest dates were adjusted in the spring and fall season due to temperature differences during the June and November kernel development periods. Kernels were fixed in FAA solution (3.7% formaldehyde, 5% glacial acetic acid, and 50% ethanol) at 4° overnight. Kernels were dehydrated in an ethanol series and then embedded in paraffin or JB-4 plastic embedding media (Electron Microscopy Sciences, Hatfield, PA). Paraffin-embedded sample were cut into 8-μm longitudinal sections close to the sagittal plane, deparaffinized, rehydrated, and counterstained with 1% safranin O and 0.5% Fast Green as described (Bai et al. 2012). Resin-embedded samples were cut into 4-μm sections. The sections were treated with 1% periodic acid for 10 min, rinsed in the running water for 5 min, and then placed in Schiff’s reagent for 30 min. The sections were transferred through three successive baths of 2 min each of 0.5% sodium metabisulfite in 1% HCl. Sections were then rinsed in running water for 5 min, counterstained in 1% aniline blue-black in 7% acetic acid for 20 min, rinsed in 7% acetic acid, and rinsed in water. Sections were dried, mounted, and examined by light microscopy. Images were captured with an AmScope digital camera.
Quantitative RT-PCR
Developing kernels of mre1/+, mre2/+, and mre3/+ crossed with W22 were sampled at 14 DAP in the fall field season. Kernels were cut in half with a transverse section as described (Gomez et al. 2009). Total RNA was extracted from the basal section of the kernel. Briefly, 100 mg of ground tissue was mixed with 200 μl of RNA extraction buffer (50 mM Tris-HCl, pH 8, 150 mM LiCl, 5 mM EDTA, 1% SDS in DEPC-treated water). The slurry was then extracted twice with 1:1 phenol:chloroform and once with chloroform at 4° for 5 min for each extraction. The aqueous phase was then extracted with TRIzol (Invitrogen, Carlsbad, CA) and chloroform. RNA was precipitated from the aqueous fraction using isopropanol and washed with 70% ethanol. RNA pellets were resuspended in nuclease-free water (Sigma, St. Louis, MO) treated with Purelink DNAase (Invitrogen). RNA was then further purified using an RNeasy MinElute Cleanup Kit (QIAGEN, Valencia, CA), and 1 μg total RNA was used to synthesize complementary DNA (cDNA) with M-MLV reverse transcriptase (Promega, Madison, WI). Quantitative RT-PCR used a StepOnePlus real-time PCR machine (Applied Biosystems, Foster City, CA) with 1× SYBR Green PCR Master Mix (Applied Biosystems) as described (Fouquet et al. 2011). The normalized expression level of each gene represents the average of three replicates of three distinct kernel pools relative to Ubiquitin using the comparative cycle threshold (Ct) method (Livak and Schmittgen 2001). The primers for each marker gene are listed in Table S2.
Data and reagent availability
All data necessary for confirming the conclusions are described within the article and Supplemental Material. Table S2 contains the primer sequences for the molecular markers used in the study. Mutants are available upon request.
Results and Discussion
Parent-of-origin-effect screen
We reasoned that parent-of-origin-effect mutants with low penetrance could be confused with recessive mutations in large-scale genetic screens, such as the UniformMu genetic screen for defective kernel mutations (McCarty et al. 2005). To identify parent-of-origin effects, we reciprocally crossed plants segregating for UniformMu rough endosperm (rgh) seed phenotypes with B73 and Mo17 inbred pollen. Most rgh mutants are seed lethal, and second ears were self-pollinated to identify rgh heterozygotes for each isolate. Parent-of-origin effects were distinguished from dominant mutations by comparing self-pollinations to the reciprocal crosses (Figure 1). Mutants were scored as maternal rough endosperm (mre) if both the self-pollination and cross with inbred pollen segregated for rgh phenotypes at similar frequencies, while the rgh/+ pollen failed to cause seed mutant phenotypes. The paternal rough endosperm (pre) mutants segregated for rgh phenotypes in self-pollinations and crosses onto inbred ears, while crosses of pre/+ with inbred pollen developed all normal seeds. This strategy requires two ears to be successfully pollinated on individual rgh/+ plants. A total of 146 rgh isolates had sufficient crosses to be screened for both mre and pre phenotypes. An additional 47 isolates lacked the rgh/+ by inbred cross and were screened for putative pre phenotypes, which could also have been dominant mutations.
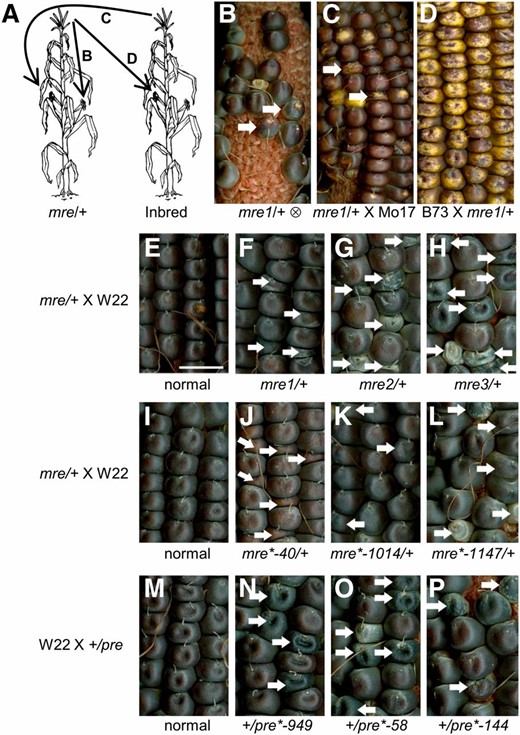
Genetic screen for mre and pre mutants. Parent-of-origin-effect mutants identified from 193 UniformMu rgh isolates. Reciprocal crosses reveal six mre mutants and three pre mutants. (A) Schematic of pollinations used to screen for parent-of-origin-effect mutants. Self-pollination identified plants heterozygous for rgh mutations. Reciprocal crosses with inbred lines were screened for rgh kernels in the F1 generation. (B) Self-pollination of mre1/+ segregates for rgh kernels. (C) mre1/+ crossed with Mo17 pollen segregates for rgh kernels. (D) B73 crossed with mre1/+ pollen has all normal kernels. Arrows indicate rgh kernels. (E) Normal sibling of mre1 × W22, (F) mre1/+ × W22, (G) mre2/+ × W22, (H) mre3/+ × W22, (I) normal sibling of mre2 × W22, (J) mre*-40/+ × W22, (K) mre*-1014/+ × W22, (L) mre*-1147/+ × W22, (M) W22 × normal sibling of pre*-949, (N) W22 × +/pre*-949, (O) W22 × +/pre*-58, and (P) W22 × +/pre*-144. White arrows indicate mutant seeds. Bar, 1 cm (shown in E) also applies to F–P.
Eight putative mre and seven putative pre isolates were identified and additional reciprocal crosses were completed with the W22 inbred. These crosses showed that six mre and three pre isolates had consistent parental effects with multiple inbred parents (Figure 1 and Figure S1). We found a wide range of segregation ratios for defective kernels in the mre and pre isolates (Table 1). Only mre3 had a 1:1 ratio of defective to normal seeds, suggesting that mre and pre loci either have reduced transmission or reduced penetrance of the rgh kernel phenotype.
Segregation of mre and pre mutants in W22 crosses
| Cross | Isolate | rgh | Normal | % rgh | Ratio | P(χ2) for 1:1 ratio |
|---|---|---|---|---|---|---|
| mre/+ × W22 | mre1 | 351 | 436 | 44.6 | 1:1.24 | 2.4 × 10⁻³ |
| mre2 | 276 | 450 | 38.0 | 1:1.63 | 1.1 × 10⁻¹⁰ | |
| mre3 | 302 | 333 | 47.6 | 1:1.10 | 0.22 | |
| mre*-40 | 69 | 162 | 29.9 | 1:2.35 | 9.4 × 10⁻¹⁰ | |
| mre*-1014 | 151 | 280 | 35.0 | 1:1.85 | 5.2 × 10⁻¹⁰ | |
| mre*-1147 | 25 | 121 | 17.1 | 1:4.84 | 1.9 × 10⁻¹⁵ | |
| W22 × pre/+ | pre*-949 | 107 | 348 | 23.5 | 1:3.25 | 1.3 × 10⁻²⁹ |
| pre*-58 | 77 | 194 | 28.4 | 1:2.52 | 1.2 × 10⁻¹² | |
| pre*-144 | 49 | 136 | 26.5 | 1:2.78 | 1.6 × 10⁻¹⁰ |
Mature seed traits of mre and pre mutants
Single-kernel NIR spectroscopy was used to predict kernel composition traits of the mre and pre isolates (Spielbauer et al. 2009; Gustin et al. 2013). All mutants reduced seed weight and volume without affecting relative protein and starch content (Figure S3). The three pre mutants had significantly reduced oil content, and sagittal sections of mature pre mutants revealed embryo development defects (Figure 2, A and B). Total and material densities were reduced in most of the mre and pre mutants (Figure S3). Endosperm storage molecule packing influences seed density, and these reductions are consistent with alterations in the mature endosperm such as reduced vitreous endosperm in mre1 or larger central endosperm air spaces in mre3 (Figure 2, C and D).
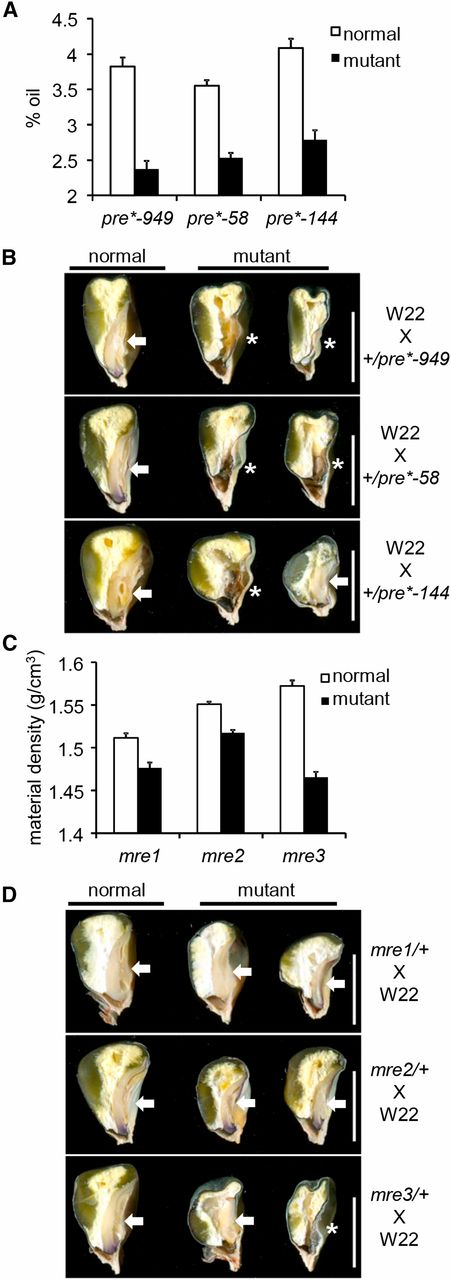
NIR kernel traits and sagittal sections of mre and pre mature seeds. (A) NIR-predicted % oil in pre*-949, pre*-58, and pre*-144. (B) Sagittal sections of pre*-949, pre*-58, and pre*-144. (C) NIR-predicted material density (grams per cubic centimeter) in mre1, mre2, and mre3. (D) Sagittal sections of mre1, mre2, and mre3. Arrows indicate embryos and an asterisk marks kernels without a visible embryo. Bar, 0.6 cm in all panels in B and D.
Sagittal mature kernel sections from mre or pre mutants showed variable severity in embryo defects, suggesting that many of the mre or pre seeds would fail to germinate (Figure S2). However, oil content was not entirely predictive of mre and pre mutant germination. Even though mre1 and mre2 had no significant reduction in kernel oil content, phenotypically mutant seeds frequently fail to germinate and only a small fraction of the mre1/+ and mre2/+ seedlings grow and develop normally (Figure S4). Similarly, mre*-40 and mre*-1014 have significantly reduced oil content, yet all mutant seeds germinated with mre/+ seedlings being indistinguishable from +/+ siblings (Figure S4). All three pre isolates have both low oil and low germination frequency (Figure S4). These pre phenotypes are surprising, because the mutagenic parents for the UniformMu population were crossed as males, and pre mutants that fail to germinate would not be expected to survive past the initial mutagenic cross (McCarty et al. 2005). All three pre isolates have a low frequency of rgh kernels when crossed onto inbred ears (Table 1), and it is likely that the pre mutants have low penetrance of the mutant phenotype. Both the inheritance patterns and the mature kernel phenotypes of the isolates suggest different developmental mechanisms underlie each mre and pre mutant phenotype.
Mapping of mre1, mre2, and mre3
Complementation groups of parent-of-origin-effect mutants are not possible to determine with traditional allelism tests. We took a molecular mapping approach to identify specific mre and pre loci from this screen. F1 crosses between each mutant and B73 or Mo17 were then backcrossed to the respective inbred or to the W22 parent of the UniformMu population. These experiments generated BC1 backcross mapping populations. For mre1 and mre3, Mo17 was the recurrent mapping parent, and B73 was the recurrent mapping parent for mre2. All other isolates failed to segregate for seed phenotypes in any of the BC1 crosses. The mre*-40, mre*-1014, mre*-1147, pre*-58, pre*-144, and pre*-949 isolates all show rgh kernel phenotypes in F1 crosses with B73, Mo17, and W22, suggesting complex genetic mechanisms suppress the phenotypes. Allele-specific imprinting is found in a small fraction of maize genes, which could explain suppression of the rgh phenotype in BC1 crosses to the B73 or Mo17 inbred lines (Waters et al. 2013). If the suppressed phenotypes were due to allele-specific imprinting, the parent-of-origin effect is expected to be recovered when F1 plants are crossed with W22 parents, suggesting that inbred variation at the mutant loci is unlikely to explain the loss of mre and pre phenotypes. Presence/absence variation (PAV) can also explain loss of parent-of-origin effects. Inbred differences in gene content and expression contribute significantly to maize phenotype diversity (Springer et al. 2009; Lai et al. 2010; Hansey et al. 2012). It is estimated that up to one-third of endosperm transcripts show PAV expression in diverse genotypes (Jin et al. 2016). Thus, there is a large number of potential genetic modifiers for rgh kernel phenotypes.
To obtain initial map positions, DNA from individual mutant kernels in the BC1 populations was genotyped using distributed SSR or SNP markers (Liu et al. 2010; Martin et al. 2010). Recombination frequencies were calculated for each marker and the physical position of linked markers identified is listed in Table S1. Expanded mapping populations were scored with additional markers. Figure 3 shows the results of these fine-mapping experiments. The mre1 locus was mapped to a 3.33-Mbp interval on the short arm of chromosome 4, while mre2 was mapped to a 0.82-Mbp interval on the long arm of chromosome 6. The mre3 locus maps to a 2.07-Mbp interval on the long arm of chromosome 10 (Figure 3). None of these mutants overlap with the genetic position of published maternal effect mutants, including ig1, bsl1, stt1, and mel1. These data indicate that mre1, mre2, and mre3 are new maternal effect loci. Interestingly, the mre1 mapping interval overlaps with a known PEG, the maize sbp3 locus (GRMZM2G106798), which has been detected as a PEG in multiple inbred combinations (Waters et al. 2011, 2013; Zhang et al. 2014). The sbp3 locus encodes a predicted transcription factor that is associated with flowering time traits in maize diversity populations (Li et al. 2016). As a PEG, sbp3 may also function in seed development, but a hypomorphic allele of a PEG is not expected to cause a maternal effect phenotype. The mre2 and mre3 mapping intervals do not contain previously identified imprinted genes.
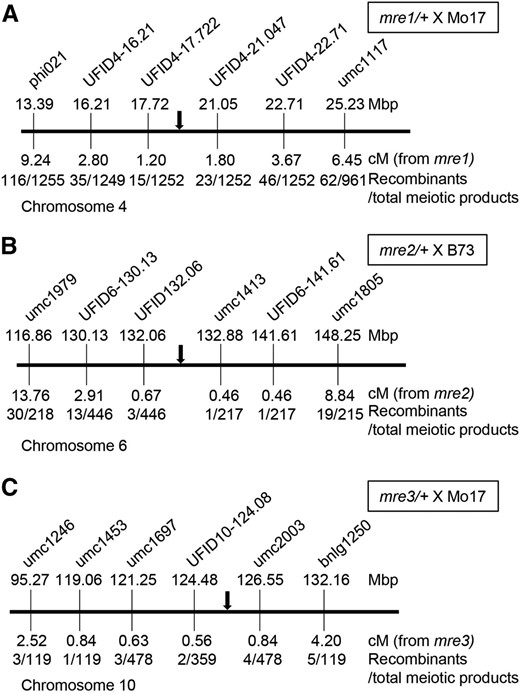
Map positions for three parent-of-origin-effect rgh loci. Integrated physical-genetic maps for (A) mre1/+ × Mo17, (B) mre2/+ × B73, and (C) mre3/+ × Mo17 BC1 mapping populations. Molecular markers are not positioned to scale. Each schematic indicates chromosome coordinates from the B73_v2 genome assembly for the markers. Recombination frequencies with the mutant phenotypes are given in centimorgans with the number of recombinants and meiotic products scored. The black arrow indicates the mutant locus position.
Transmission of mre1, mre2, and mre3
The mre1 and mre2 loci segregate for less than the 1:1 expected ratio of rgh kernels (Table 1), which could indicate incomplete penetrance of the defective kernel phenotype or reduced transmission of the mutant loci. We determined the transmission of each of the mapped loci using linked molecular markers. Reciprocal BC1 crosses with heterozygous mutants were sampled along the length of the ear and genotyped with flanking markers (Table S2). Recombinants between the flanking markers were not included as these kernels could have transmitted either the mutant or normal locus. Ratios close to 1:1 of normal to mutant were observed regardless of the direction of the cross (Table 2). These results indicate that the three mre loci transmit fully through both gametes. Based on the frequency of rgh kernels in mre1 and mre2 crosses, both mutants have incomplete penetrance and a subset of phenotypically normal kernels are expected to be heterozygous for the mre loci.
Transmission of mre and pre mutant alleles in BC1 crosses using linked molecular markers
| Mutant isolate | Reciprocal cross | W22 (mutant) | Inbred (normal) | Ratio | Expected ratio | Recombinants | P(χ2) for 1:1 |
|---|---|---|---|---|---|---|---|
| mre1 | mre1/+ × Mo17 | 51 | 44 | 1.16:1 | 1:1 | 5 | 0.47 |
| Mo17 × mre1/+ | 49 | 46 | 1.07:1 | 1:1 | 5 | 0.76 | |
| mre2 | mre2/+ × B73 | 45 | 44 | 1.02:1 | 1:1 | 0 | 0.92 |
| B73 × mre2/+ | 48 | 50 | 0.96:1 | 1:1 | 2 | 0.84 | |
| mre3 | mre3/+ × Mo17 | 53 | 46 | 1.15:1 | 1:1 | 1 | 0.48 |
| Mo17 × mre3/+ | 56 | 44 | 1.27:1 | 1:1 | 0 | 0.23 |
Contrasting endosperm defects in mre3 and mre1
It is likely that the mre and pre mutants disrupt kernel development through different mechanisms. Only the mre3 mutant is fully penetrant for the mature rgh kernel phenotype. We compared endosperm cell morphology in mutant mre3/+ kernels and normal siblings at two stages of development (Figure 4). The cellularized maize endosperm differentiates into internal starchy endosperm and three epidermal cell fates: aleurone, BETL cells, and embryo surrounding region (ESR) cells (Sabelli and Larkins 2009). The starchy endosperm cells in mre3 mutants are smaller in both developmental stages, but the mre/+ cells initiate starch accumulation with similar timing to normal (Figure 4, E and F).
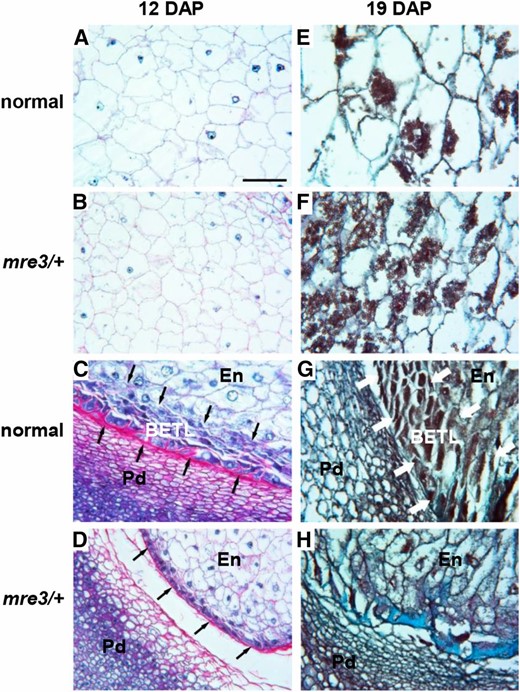
Endosperm defects in mre3. (A–D) Longitudinal sections of 12 DAP kernels stained with Schiff’s reagent and aniline blue-black. Insoluble carbohydrates in cell walls and starch grains stain fuschia; nucleoli, nuclei, and cytoplasm stain different intensities of blue. (E–H) Longitudinal sections of 19 DAP kernels stained with safranin and Fast Green. Starch and secondary cell walls are intensely stained. All samples were collected during the fall season. (A and E) Central endosperm of normal sibling kernels. (B and F) Central endosperm of mre3 kernels. (C and G) BETL endosperm region of normal kernels. (D and H) BETL endosperm region of mre3 kernels. Arrows indicate BETL. Bar, 0.1 mm (shown in A) applies to all panels. En, inner endosperm; Pd, pedicel.
The BETL shows more severe defects in mre3/+ kernels. The BETL can be clearly identified in normal sibling kernels as multiple layers of elongated transfer cells with extensive secondary cell wall ingrowths at 12 DAP and 19 DAP (Figure 4, C and G). The secondary cell wall ingrowths were not found in the BETL region of mre3/+ kernels, and the internal layers of cells in the BETL region expand isotropically to resemble starchy endosperm cells (Figure 4, D and H). These cellular phenotypes suggest mre3 causes a specific defect in BETL differentiation and bears some similarity with the maize bsl1 mutant. BETL cells differentiate in patches of the basal endosperm region in bsl1 mutants (Gutierrez-Marcos et al. 2006).
Similar comparisons between mutant and normal endosperm show a more global endosperm development defect in mre1 (Figure 5). The mre1/+ mutants have a general delay in endosperm development with smaller starchy endosperm cells in all developmental stages. Starchy endosperm cells started to accumulate starch granules at 8 DAP in normal sibling seeds (Figure 5E), but no starch granules formed in mutants by 10 DAP (Figure 5J). Mature mre1/+ kernels do eventually accumulate starch, because they have equivalent levels of starch and protein to normal siblings at maturity (Figure S3). The endosperm development delay is more clearly seen in the BETL region. At 6 DAP, normal sibling kernels have two layers of elongated transfer cells with extensive secondary cell wall ingrowths (Figure 5C), while no BETL cells are observed in mre1/+ mutants (Figure 5D). BETL development is clear in both mre1/+ and normal siblings after 8 DAP (Figure 5, G–K and H–L). These phenotypes are similar to the stt1 locus, which causes reduced grain fill through a delay in endosperm growth and differentiation (Phillips and Evans 2011).
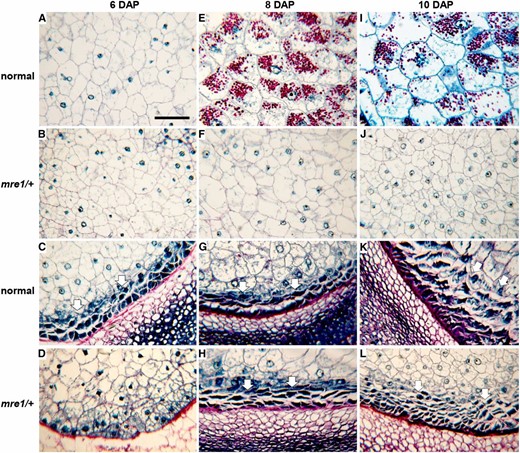
Endosperm development defects in mre1. Longitudinal sections through 6 DAP (A–D), 8 DAP (E–H), and 10 DAP (I–L) kernels sampled during the spring field season. All sections were stained with Schiff’s reagent and aniline blue-black. Insoluble carbohydrates in cell walls and starch grains stain fuschia; nucleoli, nuclei, and cytoplasm stain different intensities of blue. (A, E, and I) Central endosperm of normal sibling kernels. (B, F, and J) Central endosperm of mre1 kernels. (C, G, and K) BETL endosperm region of normal kernels. (D, H, and L) BETL endosperm region of mre1 kernels. Arrows indicate BETL. Bar, 0.1 mm (shown in A) applies to all panels.
We analyzed RNA expression levels of several endosperm cell type markers in mre1/+ and mre3/+ mutant seeds (Figure 6). Both Betl2 and Meg1 are specific to BETL cells, while Esr1 is specific for ESR cells. The Rgh3 gene encodes the maize ZRSR2 RNA splicing factor and shows constant expression for the region of the messenger RNA (mRNA) amplified (Fouquet et al. 2011). For mre3/+, Betl2 and Meg1 have large reductions in expression, while Esr1 is significantly reduced albeit to a lesser extent with ∼75% the level of normal kernels (Figure 6A). These data are consistent with a primary mre3 defect in BETL differentiation. In mre1/+ kernels, Betl2, Meg1, and Esr1 all have fourfold or greater reductions, which are consistent with developmental delay of all mre1 endosperm cell types (Figure 6B).
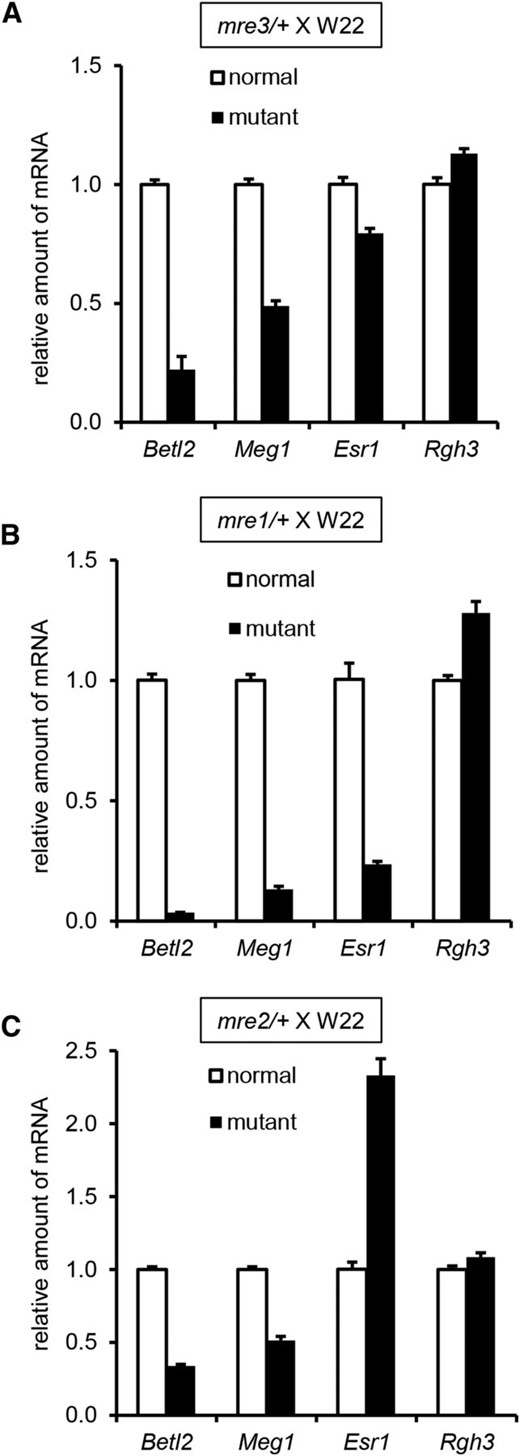
Quantitative RT-PCR of endosperm cell type marker genes in mre mutants. Mutant and normal sibling kernels were selected from mre/+ × W22 crosses at 14 DAP in the fall season for (A) mre3, (B) mre1, and (C) mre2. RNA was extracted from the lower half of the kernels. Values for the y-axis are arbitrary units of expression level relative to Ubiquitin. Error bars indicate standard error of three biological replicates.
Ectopic endosperm cell differentiation in mre2 and pre*-949
Endosperm cell type marker gene expression in mre2/+ kernels showed reductions in Betl2 and Meg1, but more than twofold increased Esr1 expression (Figure 6C). These results indicate that mre2 confers defects in BETL development and has ectopic Esr1 expression. Longitudinal sections of developing mre2/+ kernels showed multiple cell differentiation defects (Figure 7, A–H). In normal seeds, the exterior edge of the endosperm has an epidermal layer and six to eight starchy endosperm cells with progressive cell expansion toward the center of the endosperm (Figure 7A). The mre2/+ mutants greatly expanded starchy endosperm cells are found within two to three layers of the endosperm epidermal layer (Figure 7E). Starch granules are larger in the mre2/+ starchy endosperm cells, including in central regions of the endosperm (Figure 7, B and F). In the BETL region, mre2/+ does not develop BETL cells and cells immediately interior to the epidermal layer of the endosperm accumulate starch granules, indicating a starchy endosperm cell fate (Figure 7, C and G). Near the embryo, mre2/+ endosperm cells were smaller and without starch granules (Figure 7, D and H). Combined with Esr1 expression data, it is likely that mre2 causes a greater number of ESR cells to differentiate in the endosperm.
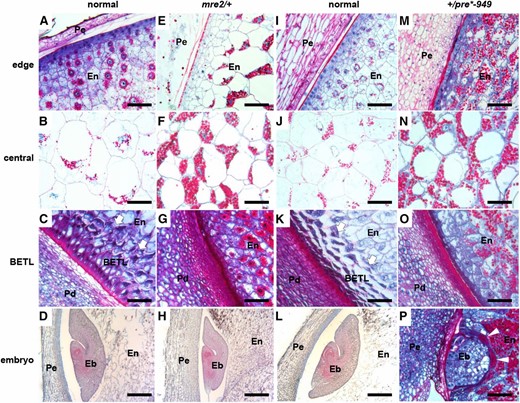
Kernel development defects in mre2 and pre*-949. Longitudinal sections of normal siblings (A–D and I–L), mre2/+ (E–H), and +/pre*-949 (M–P) kernels. Endosperm and the +/pre*-949 embryo (P) sections are stained with Schiff’s reagent and aniline blue-black. Bar, 0.1 mm in panels A-C, E–G, I–K, and M–P. All other embryos (D, H, and L) are stained with safranin and Fast Green. Bar, 0.5 mm in panels D,H, and L. (A, E, I, and M) Outer edge of the cellular endosperm (En) and maternal pericarp (Pe). (B, F, J, and N) Central starchy endosperm. (C, G, K, and O) Basal endosperm showing the maternal pedicel (Pd), the BETL (arrows), and internal endosperm (En). (D, H, L, and P) Maternal pericarp (Pe), embryo (Eb), and endosperm (En). (A–H) All sections for mre2/+ and normal siblings are from 16 DAP kernels in the fall growing season. (I–P) All sections for +/pre*-949 and normal siblings are from 19 DAP kernels in the fall growing season.
Surprisingly, sections of +/pre*-949 mutant kernels showed similar endosperm development defects as in mre2. The +/pre*-949 mutants had expanded starchy endosperm cells with starch granules within one to three layers of the endosperm epidermis (Figure 7, I and M). Starch granules are significantly larger in mutants in the central starchy endosperm (Figure 7, J and N). Moreover, +/pre*-949 kernels had defective BETL development with the internal cells differentiating into starchy endosperm like in mre2/+ mutants (Figure 7, K and O).
However, +/pre*-949 and mre2/+ show contrasting phenotypes in the ESR region. The +/pre*-949 ESR differentiates into starchy endosperm and accumulates large starch granules around the embryo, which is arrested at the globular stage (Figure 7, L and P). Mutant mre2/+ embryos are smaller but normal in morphology with an enlarged ESR domain (Figure 7, D and H). The ESR expresses numerous small peptides of the CLE gene family, which are likely involved in cell-to-cell signaling (Opsahl-Ferstad et al. 1997; Bonello et al. 2002; Balandin et al. 2005). Moreover, ESR cell differentiation defects are associated with embryo development defects in the maize rgh3 mutant (Fouquet et al. 2011). In Arabidopsis, the EMBRYO SURROUNDING FACTOR1 (ESF1) gene family is required for normal embryo development and is expressed in the micropylar endosperm (Costa et al. 2014). Endosperm expression of ESF1 promotes suspensor cell growth and normal basal development in the embryo proper, indicating an important role for ESR-like endosperm domains in angiosperm embryo development. Thus, it is likely that ectopic starchy cell differentiation in +/pre*-949 kernels leads to aborted embryo development. However, the expansion of the ESR in mre2/+ kernels does not appear to alter embryo developmental patterning. These data suggest that a minimum number of ESR cells is necessary to promote embryo development, but that excess ESR is not inhibitory to normal embryo development.
Conclusions
Our screen for mre and pre mutants has revealed that many parent-of-origin-effect loci show reduced penetrance of defective kernel phenotypes. These results help explain the low number of mutant isolates segregating for 50% defective kernels in large-scale genetic screens (Neuffer and Sheridan 1980; McCarty et al. 2005). Phenotyping of reciprocal crosses with inbred lines appears to be a robust method to identify parent-of-origin-effect kernel mutants in maize.
The mre and pre endosperm defects suggest several developmental mechanisms that can give rise to parent-of-origin kernel defects. Defective or delayed BETL cell differentiation was observed in all mutants. The BETL transfers nutrients to the developing seed, and transfer cell defects are likely to limit grain fill. BETL defects appear to be the primary cause of reduced grain fill in mre3 and the bsl1 loci (Gutierrez-Marcos et al. 2006). A more general delay in endosperm differentiation was found for mre1, which is similar to the stt1 locus and the recessive rgh3 locus (Fouquet et al. 2011; Phillips and Evans 2011). By contrast, multiple endosperm cell differentiation defects were found in mre2 and pre*-949, with pre*-949 illustrating the importance of the ESR for maize embryo development. Even though mre3 and mre1 have some similarity to bsl1 and stt1, these new loci show no bias in transmission. These data indicate that the female gametophyte is fully functional in the mre loci. We believe the most parsimonious explanation for the maternal effects of mre1, mre2, and mre3 is that these mutants encode imprinted, maternally expressed genes. However, no known MEGs overlap with the map locations of these loci. Alternatively, the mre gene products may be stored in the female gametophyte for later seed development functions, or the mre endosperm phenotypes result from interactions between the mre female gametophyte and mre/+ endosperm. Molecular cloning of the mre loci would resolve these models.
Acknowledgments
We thank Wei Wu and Mitzi Wilkening at the Iowa State University Genomic Technologies Facility for genotyping services. This work is supported by National Science Foundation (awards IOS-1031416 and MCB-1412218) and the National Institute of Food and Agriculture (awards 2010-04228 and 2011-67013-30032).
Note added in proof: See Chettoor et al. 2016 (pp. 233–248) in this issue, for a related work.
Footnotes
Supplemental material is available online at www.genetics.org/lookup/suppl/doi:10.1534/genetics.116.191775/-/DC1.
Communicating editor: N. M. Springer
