


Abstract
Dis3 encodes a conserved RNase that degrades or processes all RNA species via an N-terminal PilT N terminus (PIN) domain and C-terminal RNB domain that harbor, respectively, endonuclease activity and 3′–5′ exonuclease activity. In Schizosaccharomyces pombe, dis3 mutations cause chromosome missegregation and failure in mitosis, suggesting dis3 promotes cell division. In humans, apparently hypomorphic dis3 mutations are found recurrently in multiple myeloma, suggesting dis3 opposes cell division. Except for the observation that RNAi-mediated depletion of dis3 function drives larval arrest and reduces tissue growth in Drosophila, the role of dis3 has not been rigorously explored in higher eukaryotic systems. Using the Drosophila system and newly generated dis3 null alleles, we find that absence of dis3 activity inhibits cell division. We uncover a conserved CDK1 phosphorylation site that when phosphorylated inhibits Dis3’s exonuclease, but not endonuclease, activity. Leveraging this information, we show that Dis3’s exonuclease function is required for mitotic cell division: in its absence, cells are delayed in mitosis and exhibit aneuploidy and overcondensed chromosomes. In contrast, we find that modest reduction of dis3 function enhances cell proliferation in the presence of elevated Ras activity, apparently by accelerating cells through G2/M even though each insult by itself delays G2/M. Additionally, we find that dis3 and ras genetically interact in worms and that dis3 can enhance cell proliferation under growth stimulatory conditions in murine B cells. Thus, reduction, but not absence, of dis3 activity can enhance cell proliferation in higher organisms.
DIS3 was initially identified in Schizosaccharomyces pombe through a genetic screen for genes required for sister chromatid segregation at mitosis (Ohkura et al. 1988). Dis3 belongs to the RNase II family of proteins found in bacteria, archaea, and eukaryotes; this protein family is defined by the presence of a highly conserved RNAse II (RNB) domain (Arraiano et al. 2010). The RNB domain degrades single-stranded RNA in a highly processive 3′ to 5′ manner. Dis3 also harbors an N-terminal PilT N terminus (PIN) domain that possesses RNA endonuclease activity (Lebreton et al. 2008). Dis3 appears to act as the principle catalytic subunit of the RNA exosome, a large multisubunit protein complex that can degrade and/or process all classes of RNA (Kinoshita et al. 1991; Mitchell et al. 1997; Dziembowski et al. 2007; Lebreton et al. 2008; Tomecki et al. 2010). Emerging work indicates that noncoding RNAs and RNA processing enzymes, like the RNA exosome, regulate centromere and kinetochore formation and function (Volpe et al. 2002; Topp et al. 2004; Verdel et al. 2004; Buhler et al. 2007; Murakami et al. 2007; Wong et al. 2007; Folco et al. 2008; Chan et al. 2012; Rosic et al. 2014).
In S. pombe, the dis3-54 cold-sensitive mutation reduces RNA exonuclease activity and leads to overcondensed chromosomes that distribute unequally at mitosis, eventually leading to failure or lethality in mitosis (Ohkura et al. 1988); elimination of dis3 activity is incompatible with cell growth in S. pombe (Kinoshita et al. 1991). Genetic and biochemical studies of dis3 in vertebrate cells support these findings: reduction of Dis3 exonuclease function retards cell growth; elimination of Dis3 function appears incompatible with cell growth (Tomecki et al. 2014). Except for the observation that RNAi-mediated depletion of dis3 function leads to early larval arrest and reduces tissue growth in Drosophila (Hou et al. 2012; Towler et al., 2015), the role of dis3 has not been rigorously explored in higher eukaryotic model systems.
Two other genes—dis1 and dis2—were identified alongside dis3 in the genetic screen in S. pombe for sister chromatid segregation defects (Ohkura et al. 1988). dis1 encodes the founding member of the TOG1/XMAP215 family of microtubule-associated proteins (Nabeshima et al. 1995). dis2 encodes a catalytic subunit of type I protein phosphatases (PP1) (Ohkura et al. 1989). In yeast and flies, loss-of-function mutations in dis1 (mini-spindles in flies) and dis2 (PP1-87b in flies) lead to overcondensed chromosomes that distribute unequally among daughter cells at mitosis and result ultimately in a failure or block in mitosis (Ohkura et al. 1988; Axton et al. 1990; Cullen et al. 1999).
In contrast, other studies hint that reduction of dis2 or dis3 activity may, in certain contexts, enhance cell division. In cycling Xenopus embryo extracts, pharmacological inhibition of PP1 activity triggers premature mitotic entry (Walker et al. 1992). In multiple myeloma, a malignancy of plasma B cells, whole genome sequencing approaches uncover dis3 as one of the most frequently mutated genes in this cancer (Chapman et al. 2011; Walker et al. 2012; Lohr et al. 2014). Essentially all multiple myeloma-specific dis3 mutations are missense mutations that cluster in its RNB domain and appear to reduce but not eliminate dis3 function in the tumor cells: dis3 mutations that are associated with loss of heterozygosity appear to simply reduce Dis3 exonuclease activity, whereas those mutations found associated with a wild-type copy of dis3 in the tumor appear to largely eliminate exonuclease activity for the variant allele product (Chapman et al. 2011; Walker et al. 2012; Lohr et al. 2014; Tomecki et al. 2014). Within multiple myeloma tumors, dis3 mutations have been found simultaneously clonal with activating mutations in k-ras (Lohr et al. 2014). However, no direct experimental evidence has linked loss or reduction of dis3 function to enhanced cell proliferation.
The Ras–ERK pathway drives cells through the G1–S cell cycle transition, by promoting cell growth (Prober and Edgar 2000), and cyclin-dependent kinase I (CDK1), the master regulator of mitosis, triggers mitosis and its associated events via the concerted phosphorylation of a battery of downstream targets (Nigg 2001). But on its own, activation of the Ras–ERK pathway is insufficient to deregulate cell proliferation: in otherwise normal cells, constitutive ras activation, via forced expression of rasV12, an activated form of ras, drives cell growth, accelerating cells through G1–S, but leaves cell-doubling times relatively unchanged, resulting in enlarged cells that stack up in the G2 phase of the cell cycle (Prober and Edgar 2000). Except for the trend in multiple myeloma for mutations in dis3 to co-occur with activating mutations in k-ras, no genetic interaction has been found between dis3 and the Ras–ERK pathway.
Beginning with the Drosophila system, we find that the ablation of dis3 activity or specifically of dis3’s exonuclease activity is incompatible with cell division, leading to a variety of mitotic defects. Conversely, we find that reduction of dis3 activity can enhance cell proliferation when paired with elevated ras activity. Extending our findings through the use of the worm and mouse systems, we find that the ras–dis3 genetic interaction is evolutionarily conserved, and that dis3 reduction can, in the presence of growth-stimulating conditions, enhance the proliferation of murine B cells, the relevant cancerous cell type in multiple myeloma.
Materials and Methods
Fly strains and transgenes
Wild type is w1118. The following stocks were provided by the Bloomington Drosophila Stock Center: UAS-Rasv12, UAS-RasDN, UAS-RasWT, UAS-RafF179, UAS-RafDN, grk3, dis3P, sbr RNAi (HMS02414), 3L3R FRT (w[1118];P{w[+mW.hs]=FRT(w[hs])}2A P{ry[+t7.2]=neoFRT}82B), tubP-gal4 (III), act5C gal4 (II), MS1096-GAL4, and Df(3R)BSC638 and the FUCCI reporter w; KrIf-1/CyO; UAS-CFP.E2f UAS-Venus.NLS.CycB/TM6B Tb. dis3 RNAi (KK101473) and rop-1 RNAi (KK104790) were obtained from the Vienna Drosophila Resource Center. The grk2B line was provided by Paul Macdonald and dpp-gal4, UAS-GFP, and MARCM 82B (hsflp, UAS GFP; tubP-gal4; FRT 82B tub gal80/SM6a-TM6b), by Greg Longmore.
Rescue experiments were carried out using the GAL4/UAS system (Brand and Perrimon 1993). dis3 alleles were isolated by EMS mutagenesis of 3L3R flies and screened for lines that failed to complement the dis3 deficiency, Df(3R)BSC638. A complementation group containing dis3 alleles was identified and sequencing identified the causative lesion in each dis3 allele (see Figure 1 legend). Mosaic analysis with a repressible cell marker (MARCM) clones were generated by heat shocking larvae for 1 hr at 37° and fixing wing discs from wandering third instar larvae after 48 hr. dis3P is an enhancer/promoter (EP) element insertion (Rorth 1996) that contains the GAL4 responsive UAS sequences in its 5′ UTR, and which can be used to drive dis3 expression under GAL4 control. Actin-GAL4 mediated expression of dis3 in flies transheterozygous for dis3P and Df(3R)BSC638, dis31, or dis32 rescue the observed overgrowth phenotype of posterior follicle cells. The chromosome carrying dis3P is homozygous lethal, but dis3G5039 over Df(3R)BSC638 is viable. Thus, the dis3P chromosome appears to carry an associated lethal mutation.
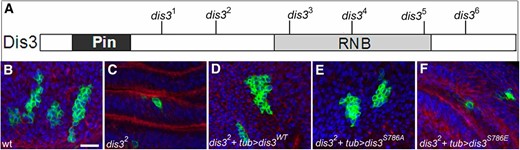
dis3 is required for cell proliferation. (A) Schematic representation of Dis3 protein showing relevant domains and locations of the six newly generated alleles (black lines). (B–F) Forty-eight-hour-old MARCM clones (green) of indicated genotype in wing discs stained for microfilaments (red) and DNA (blue). (B) Wild type: hsflp, UAS-GFP, tub-gal4/+; FRT82B tub-gal80/FRT82B. (C) dis32: hsflp, UAS-GFP, tub-gal4/+; FRT82B tub-gal80/FRT82b dis32. (D) dis32 + tub > dis3WT: UAS-dis3WT/hsflp, UAS-GFP, tub-gal4; FRT82B tub-gal80/FRT82B dis32. (E) dis32 + tub > dis3S786A. (F) dis32 + tub > dis3S786E are identical to dis32 + tub > dis3WT except that dis3S786A and dis3S786E take the place of dis3WT. Bar, 50 µm in B (A) The molecular nature of the dis3 alleles is as follows: dis31 (C866T and Q252X), dis32 (G1255A and W360X), dis33 (C1624T and C483X), dis34 (T2043A and L623X), dis35 (C2591T and P787L), and dis36 (G2861A; disrupts splice site at amino acid 858).
UAS transgenes were generated by amplifying region 6–3066 of the dis3 cDNA, SD10981 (accession AY052150.1) and directionally cloning into the NotI and XbaI sites of pUASp-ATT (Becalska and Gavis 2010). PCR-based mutagenesis was used to create phosphomimetic S786E (TCG > GAG) and nonphosphorylateable S786A (TCG > GCC) forms of the dis3 transgene. dis3 transgenes were inserted into the attp40 landing site on 2L (Genetic Services).
Antibody production, immunostaining, and neuroblast squashes
The N-terminal 500 amino acids of Dis3 were expressed as a his-tagged fusion protein, purified, and used to immunize guinea pigs and rabbits (Pocono Rabbit Farm and Laboratory). Purified Dis3 fusion protein was cross-linked to cyanogen bromide sepharose resin and used for affinity purification of anti-Dis3 antibodies as described in Arur and Schedl (2014). For immunostaining, tissues were dissected in PBS, fixed in 3.7% formaldehyde in PBS, washed in PBS 0.1% Tween, blocked with 1% BSA in PBS 0.1% Tween, and incubated with primary antibodies and Alexa-Fluor-conjugated secondary antibodies (Life Technologies). Immunofluorescence was performed as described using the following antibodies: rabbit anti-dpERK (Cell Signaling), guinea pig anti-Dpn (1/1000), mouse anti-tubulin (1/50, E7, Developmental Studies Hybridoma Bank), and rabbit antiphospho-(Ser10)-histone 3 (1:4000). DAPI and rhodamine phalloidin were used to stain DNA and microfilaments.
Orcein staining of third instar larval neuroblasts was performed as in Fanti and Pimpinelli (2004). The degree of chromosome condensation was scored in hypotonically treated brains, while aneuploidy was scored in hypotonic- and colchicine-treated brains.
Measurements of imaginal disc area were performed by selecting wandering third instar larvae with everted spiracles, sorting for sex, and fixing imaginal discs via standard methods. Area measurements were performed using ImageJ. We note that imaginal discs that coexpressed dis3 RNAi and rasv12 transgenes exhibited increased folding relative to all other genotypes; thus measurements of tissue size in this background likely underestimate the effect of dis3 and rasv12 on tissue growth and size.
Exonucleolytic and encoducleolytic RNA assays
Dis3 RNA exonuclease assays were adapted from Mamolen et al. (2011) and performed in quadruplicate. Maltose binding protein (MBP) or N-terminal MBP fusions of full-length Dis3, Dis3S786A (TCG > GCC), Dis3S786E (TCG > GAG), and Dis3P787L (CCC > CTC) were expressed in Escherichia coli and purified on amylose resin. A 96-nt RNA substrate was generated by T7 transcription of NotI digested pBS SK. Purified proteins were diluted to 60 nM concentration in 10 mM Tris, pH 8.0, 75 mM KCl, and 40 μM MgCl2 containing 3 ng/µl RNA. This mix was incubated at 37° until the indicated time points before aliquots were taken and added to formamide loading buffer. RNAs were run on 2% agarose gels before visualization. Quantitation was performed using ImageJ.
Dis3 RNA endonuclease assays were performed in quadruplicate essentially as described in Lebreton et al. (2008). Briefly, to generate a circular RNA substrate, a 461-nt fragment was PCR amplified with T7 promoter on the 5′ end and SP6 promoter on the 3′ end. The PCR product was gel purified, and 1 μg of purified DNA template was used in an in vitro transcription reaction with T7 RNA polymerase. The in vitro transcription reaction was performed for 1 hr at 37°. At the end of the reaction, 10 units of DNAseI treatment was performed to eliminate the DNA template, and the single-strand RNA was purified via standard methods. A total of 5 μg of linear purified RNA was then treated with 1 unit of T4 RNA ligase, 10% PEG, and 100 nM ATP in 1× ligase buffer overnight at 15°. The circular RNA was then gel purified and eluted in DEPC water. The RNA was quantified by spectrophotometer before analysis. Each experimental replicate was performed using freshly generated and circularized single-strand RNA.
To assess the endonuclease assay of each form of Dis3, purified proteins were diluted to 60 nM concentration in 10 mM Tri, pH 8.0, 75 mM KCl, and 40 µM MnCl2 containing about 4 µg/µl circularized RNA. This mix was incubated at 37° for 1 hr before aliquots were taken and added to formamide loading buffer. RNAs were run on 7% native polyacrylamide gels before visualization. Quantitation was performed using a spectrophotometer.
In vitro CDK1 kinase assays and mass spectrometry analysis
Recombinant 6× HIS-tagged wild-type Drosophila Dis3 protein was made by cloning a PCR product corresponding to amino acids 451–982 of the wild-type protein into the pTrcHis Topo vector (cat. no. K4410-01). Recombinant 6× HIS-tagged, full-length forms of Caenorhabditis elegans Dis3WT and Dis3S791A were created in a similar manner. Clones were verified by sequencing for orientation and sequence integrity. Proteins were expressed using BL21(DE3) (Sigma) cells, at 20° using 1 mM isopropyl β-D-1-thiogalactopyranoside for 16 hr. Proteins were purified using Ni-NTA agarose or glutathione sepharose. The amount of purified protein was estimated by conducting bicinchoninic acid assay (BCA)-based protein assays and comparing band intensities of purified protein samples with BSA dilution series standards on a Coomassie-stained gel following 10% SDS–PAGE.
In vitro kinase assays were carried out as described previously (Arur et al. 2009) using purified CDK1/cyclinA2 kinase (Promega; V2961). Briefly, for each protein, a standard 25-μl reaction containing 100 ng of purified protein, 50 μM cold ATP, and 1 μM [32P]γATP (6000 Ci/mmol; PerkinElmer) was performed. SDS–PAGE and autoradiography were used to establish that the intact fusion protein contained most of the incorporated 32P.
The paired in vitro kinase assays and phosphopeptide analysis were performed as detailed above with the following modifications. A standard 25-μl reaction contained 500 ng of purified protein, 100 μM cold ATP (Sigma), 1× kinase buffer, and 5 units of active CDK1/cyclinA2 enzyme. Reactions were terminated after 15 min at 30°, at which time ATP incorporation was linear with respect to time. The phosphorylated protein was bound to an Ni-NTA column and washed with 1× kinase buffer. The protein was then eluted with 100 μl 250 mM imidazole and dialyzed into PBS overnight at 4°. The dialyzed protein was shipped to the Harvard University’s Taplin Biological Mass Spectrometry Facility for phosphopeptide analysis.
Image acquisition and preparation details
Imaging of orcein-stained neuroblasts was performed at room temperature on a Zeiss axioplan 2 microscope fitted with an Olympus DP71 camera using a ×63 apochromat oil immersion lens with a numerical aperature (N.A.) of 1.4. DP image acquisition software was used to acquire images. All other imaging was performed on a Zeiss LSM700 confocal microscope using ×63 apochromat oil immersion (N.A. 1.4), ×40 Neofluor oil immersion (N.A. 1.3), and ×10 Neofluor air (N.A. 0.3) lenses. Tissue was mounted in 70% glycerol containing 0.3× PBS and 2% propyl gallate. Images were acquired using ZEN 2009 software (Zeiss) exported as TIFF images and brightness and contrast were adjusted using Adobe Photoshop. All images are single confocal slices except Figure 4C, which is a maximum projection of a confocal Z-stack (performed using ZEN 2009 software).
RNAi-interference experiments in the C. elegans germ line
A dis-3 RNAi clone was generated by amplification of 1 kb of the open reading frame starting from ATG and inserted into the pPD129.36 RNAi vector. The clone was sequence verified before analysis. When adult C. elegans were grown on dis-3 RNAi plates, the resulting progeny died during early larval stages. Thus RNAi analysis was performed with L1 larvae grown on RNAi plates and analyzed 24 hr past the L4 larval stage. All RNAi experiments were performed in the rrf-1 background. RRF-1 is a soma-specific RNA-dependent RNA polymerase that is necessary for the RISC complex to function in the soma. In the absence of rrf-1, RNAi is elicited in the germ line but not in most somatic tissues, thus the function of genes can be assayed during adult germ line development.
Mouse strains
All experiments involving animals were performed according to protocols approved by the Washington University School of Medicine Animal Studies Committee. C57BL/KalwRij AID-Cre;LSL-KrasG12D/+ and AID-Cre;LSL-Kras+/+ transgenic mice were generated by backcrossing AID-Cre knock-in mice and LSL-KrasG12D mice onto the C57BL/KaLwRij background for at least 10 generations, then breeding the backcrossed strains together. The ROSA26-EYFP allele was removed from AID-Cre mice over the course of backcrossing. For genotyping, DNA was isolated from tail snips using DNeasy Blood and Tissue kit (Qiagen).
Plasmid constructs
Lentiviral pLKO.1-puro vectors containing short hairpin RNAs (shRNAs) targeting murine Dis3 (RNAi Consortium clone IDs: TRCN0000120742 and TRCN0000120744, referred to as shDis30.1 and shDis30.2, respectively) were purchased from Sigma-Aldrich.
Viral production and transduction experiments
Recombinant lentiviruses were produced by transient cotransfection of 293T cells with shRNA constructs along with packaging plasmid psPAX2 and envelope plasmid pMD2.G using Lipofectamine 3000 (Invitrogen). Viral supernatants were harvested 48 hr post-transfection and concentrated using Retro-X Concentrator (Clontech). Titers were determined by transducing NIH/3T3 cells with serial dilutions of concentrated supernatant and selecting with puromycin. All transduction experiments were performed in the presence of 10 μg/ml polybrene.
Murine B cell growth assay
Spleens were harvested from mice and single-cell suspensions generated by passing tissue through 70-μm cell strainers (Corning). Red blood cells were removed by brief treatment with hypotonic lysis buffer (Sigma-Aldrich). Splenocytes were washed once in staining buffer (0.5% BSA and 2 mM EDTA in PBS), then naive B cells were isolated by immunomagnetic depletion using anti-CD43 microbeads and LD columns (Miltenyi Biotec). CD43− B cells were then cultured for 24 hr in stimulation media consisting of RPMI 1640 media (ATCC), 10% FBS (Hyclone), 50 μM β-mercaptoethanol (Sigma-Aldrich), 1% penicillin–streptomycin (Corning), 10 μg/ml LPS (Sigma-Aldrich), and 20 ng/ml IL-4 (R&D Systems), before transduction with lentiviral shRNAs. Transduced B cells were plated at 50,000 cells in 400 μl of stimulation media per well of 48-well plates (day 0). Cell numbers were then assessed on successive days using a Neubauer hemocytometer and Trypan blue staining.
RNA isolation and quantitative real-time PCR
RNA was isolated using the RNeasy Plus or miRNeasy kit (Qiagen) and quantified on an H4 Synergy microplate reader (Biotek). RNA was then reverse transcribed with iScript RT Supermix (Bio-Rad). cDNA input was standardized and quantitative PCR (qPCR) reactions were performed with Taqman Fast Advanced Master Mix (Applied Biosystems). Taqman probes (Applied Biosystems) were as follows: Dis3 (Mm01224318_m1), Actb (Mm00607939_s1), 18S (Mm03928990_g1), and Ywhaz (Mm01158416_g1). All real-time (RT)-qPCR reactions were performed on a CFX96 Connect Real-Time PCR System (Bio-Rad). Target gene expression levels were normalized to averaged Actb, 18S, and Ywhaz expression levels and fold change was determined with the ddCt method.
SDS–PAGE and immunoblotting
Cells were lysed in ice-cold 1× RIPA lysis buffer (Millipore, 50 mM Tris-HCl, pH 7.4, 150 mM NaCl, 0.25% deoxycholic acid, 1% NP-40, 1 mM EDTA), containing 1× Halt Protease and Phosphatase Inhibitor Cocktail (Pierce) on ice for 30 min. Lysates were clarified by centrifugation and protein content measured using the BCA Protein Assay kit (Pierce). A total of 40 μg of protein was resolved on 4–20% TGX gels (Bio-Rad) and transferred onto PVDF membranes (Bio-Rad). Membranes were blocked in Tris-buffered saline containing 0.1% Tween 20 (TBST) with 5% BSA added, before incubation overnight at 4° with primary antibodies against DIS3 (Proteintech). The membranes were then washed with TBST and incubated with the appropriate horseradish peroxidase (HRP)-conjugated secondary antibody for 1 hr at room temperature. Results were visualized with SuperSignal West Dura Extended Duration Substrate (Pierce) and imaged on a ChemiDoc XRS system (Bio-Rad).
Data availability
The authors state that all data necessary for confirming the conclusions presented in the article are represented fully within the article.
Results
Abrogation of Dis3 activity is incompatible with cell division
To discern the null phenotype of dis3 in flies, we used an EMS-based noncomplementation screen to generate six new dis3 alleles: dis31–dis36, four of which encode premature stop codons (Figure 1A and legend). All six alleles are homozygous lethal and exhibit indistinguishable phenotypes in trans to each other or a deficiency of the region—larvae reach the second larval instar stage, persist at this stage for up to 8 days, and die, similar to what has been observed for RNAi-mediated depletion of dis3 function (Hou et al. 2012; Towler et al., 2015). All six alleles then behave like null or strong hypomorphic alleles of dis3, and dis3 is an essential gene with its maternal stores apparently sufficient to direct embryonic and larval development to the second larval instar stage.
To assess the effect of ablation of dis3 function on cell division, we used the MARCM system to induce mitotic cell clones homozygous mutant for dis31 or dis32, the two dis3 alleles with the earliest premature stop codons, in second instar larvae, and counted the number of cells per clone 48 hr later (Figure 1, B–E; Table 1). Control wild-type clones contained 18.8 ± 8.8 cells per clone, while dis31 or dis32 mutant clones contained 2.0 ± 1.1 or 1.9 ± 0.8 cells per clone, respectively, with this phenotype fully rescued by expression of a wild-type dis3 transgene. Apoptosis does not account for the small size of dis3 mutant clones, as expression of the baculovirus cell death inhibitor P35 did not increase cell number of dis3 mutant clones (Table 1). During the 48-hr time window, wild-type cells then underwent on average four cell doublings, and cells homozygous mutant for dis31 or dis32 underwent one cell doubling. Based on the maternal perdurance of dis3 gene function, we infer that perdurance of Dis3 protein within mutant clones allows for one cell division and that abrogation of dis3 function inhibits or blocks cell growth and/or division.
Dis3 function is required for cell division
| Genotype of MARCM clones | Cells/clone | n |
|---|---|---|
| WT | 18.8 ± 8.8 | 15 |
| dis31 | 2.0 ± 1.1 | 17 |
| dis32 | 1.9 ± 0.8 | 15 |
| dis32 + tub > dis3WT | 17.2 ± 12.0 | 22 |
| dis32 + tub > dis3S786A | 16.8 ± 9.4 | 12 |
| dis32 + tub > dis3S786E | 3.4 ± 2.1 | 24 |
| dis32 + tub > P35 | 2.6 ± 1.3 | 31 |
wt, FRT2A, FRT82D; ±, standard deviation.
| Genotype of MARCM clones | Cells/clone | n |
|---|---|---|
| WT | 18.8 ± 8.8 | 15 |
| dis31 | 2.0 ± 1.1 | 17 |
| dis32 | 1.9 ± 0.8 | 15 |
| dis32 + tub > dis3WT | 17.2 ± 12.0 | 22 |
| dis32 + tub > dis3S786A | 16.8 ± 9.4 | 12 |
| dis32 + tub > dis3S786E | 3.4 ± 2.1 | 24 |
| dis32 + tub > P35 | 2.6 ± 1.3 | 31 |
wt, FRT2A, FRT82D; ±, standard deviation.
CDK1-mediated phosphorylation of Dis3 inhibits its exonuclease activity
dis3 was initially identified alongside dis1 and dis2 in a screen for sister chromatid segregation defects in S. pombe (Ohkura et al. 1988). dis1 encodes a TOG1/XMAP215 family of microtubule-associated proteins; dis2 encodes a catalytic subunit of type I protein phosphatases (PP1) (Ohkura et al. 1989; Nabeshima et al. 1995). In yeast and mammalian cells, loss-of-function mutations in dis1 and dis2 delay or block mitosis (Ohkura et al. 1988; Fernandez et al. 1992; Gergely et al. 2003), phenotypes similar to what we observed for dis3. Dis1 and Dis2 are also phosphorylated by CDK1 during mitosis and localize to the centromere (Yamano et al. 1994; Nabeshima et al. 1995; Kwon et al. 1997; Trinkle-Mulcahy et al. 2003; Aoki et al. 2006). Thus, we asked whether CDK1 can phosphorylate Dis3. Dis3 contains a conserved, consensus CDK1 phosphorylation sites (S/T-P-x-K/R), S786 in flies, nestled within a stretch of 12 amino acids within the exonuclease active site perfectly conserved between yeast and humans (Figure 2A). Using a purified, C-terminal form of wild-type Drosophila Dis3, we combined in vitro kinase assays, mass spectrometry analysis, and phosphopeptide analysis to identify S786 as the major site phosphorylated by active CDK1:cyclinA2, with 18.2% of total peptides containing phospho-S786 (Figure 2B; Supplemental Material, Figure S1). Similar in vitro kinase assays verified that CDK1 phosphorylates C. elegans Dis3 on the cognate phosphorylation site (S791; Figure 2B). Thus, the ability of CDK1 to phosphorylate Dis3 in its exonuclease domain appears conserved evolutionarily.
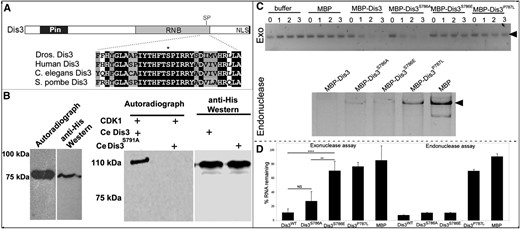
CDK1 phosphorylates Dis3 in vitro and inhibits its exonuclease activity. (A) Schematic representation of Dis3 with relevant protein domains indicated. Alignment of a portion of the catalytic region of Dis3’s RNA exonuclease domain with the predicted CDK1 phosphorylation site (SP) marked by *. (B) In vitro kinase assays showing that CDK1 phosphorylates a 75-kDa C-terminal form of Drosophila Dis3 (left) and a full-length 110-kDa form of C. elegans Dis3WT but not Dis3S791A (right); in both panels, the anti-His Western blot shows protein loading of the 75-kDa C-terminal form of Drosophila Dis3, and the 110-kDa full-length forms of C. elegans Dis3. All assays were repeated at least three times. (C, top) Exonuclease activity of indicated forms of full-length Drosophila Dis3 acting on a 96-bp RNA substrate (arrowhead) as a function of time (in hours). Exonuclease assays were performed in the presence of buffer alone, maltose binding protein (MBP), or MBP fusions of the indicated forms of Dis3. (Bottom) Endonuclease activity of indicated forms of Dis3 acting on a circular 461-bp RNA molecule (arrowhead). (D) A graph quantifying three independent exonuclease assays and four independent endonuclease assays (bottom). Error bars indicate 95% confidence intervals. ** P < 0.01; ****P < 0.0001.
Next, we assessed the effect of phosphorylation on Dis3 exonuclease and endonuclease activity in vitro, using four full-length, recombinant forms of Dis3, each fused N-terminally to maltose binding protein—a wild-type form, a nonphosphorylatable form in which we mutated S786 to A, a phosphomimetic form in which we mutated S786 to E, and a form that contained the Dis3 P787L mutation (the mutation in dis35) in the phosphoacceptor site of Dis3 (Figure 2C). To measure exonuclease activity, we assayed the ability of each form of Dis3 to degrade a linear 96-nucleotide RNA molecule in the presence of Mg++, which is required for optimal exonuclease activity, but not Mn++, which is required for optimal endonuclease activity (Schaeffer et al. 2009). To measure endonuclease activity, which is encoded by the N-terminal PIN domain, we assayed the ability of each form of Dis3 to degrade a circular 461-nucleotide RNA molecule in the presence of Mn++, but not Mg++. The wild-type and nonphosphorylatable forms of Dis3 possessed significant RNA exonuclease activity, but the phosphomimetic and P787L forms largely lacked such activity (Figure 2, C and D). In contrast, all Dis3 forms except Dis3P787L retained significant RNA endonuclease activity (Figure 2, C and D). We infer that CDK1-mediated phosphorylation of Dis3 on S786 inhibits its RNA exonuclease, but not endonuclease, activity and that the P787L mutations alter both activities, likely because it disrupts overall protein structure.
Next, we sought to test the specific functional requirement of Dis3’s exonuclease activity in vivo. Here, we generated three UAS-linked dis3 transgenes (wild type, nonphosphorylatable, and phosphomimetic) and assessed the ability of each to rescue the lack of cell division observed in dis3 mutant MARCM clones and the larval lethal phenotype of flies that lack zygotic dis3 function. Expression of the wild-type or nonphosphorylatable, but not the phosphomimetic, dis3 transgene rescued the cell division phenotype of dis3 mutant clones (Figure 1, D–F; Table 1; see Figure S1 for relative expression of each transgene). Likewise, ubiquitous expression of the wild-type or nonphosphorylatable dis3 transgene rescued the lethal phenotype of dis31/2 larvae, producing morphologically normal adult flies at normal developmental timing (Figure 3, A–D and N). Expression of the phosphomimetic dis3 transgene in the dis31/2 mutant background rescued larval development to the late wandering third larval instar stage, but larvae took 7–12 extra days to reach this stage and died at or shortly after it (Figure 3, E and N). Dissection of these larvae revealed that their imaginal tissues, which grow via mitotic cell cycles, were either lacking (imaginal discs) or reduced in size (brains and ventral nerve cord) (compare Figure 3I to Figure 3, F–H), but that their larval tissues, such as salivary glands, which grow via endoreduplication, were of grossly normal size and morphology (compare Figure 3M to Figure 3, J–L). This phenotypic syndrome in which late larval/early pupal lethality is coupled to missing imaginal discs and reduced central nervous system size, but normal larval structures, is characteristic of mutations in essential mitotic functions (Gatti and Baker 1989). The ability of the phosphomimetic dis3 transgene to rescue endocycles and larval development, at least to late larval stages, but its inability to rescue the mitotic cell division and the growth of imaginal tissues, strongly support a model for a mitotic function of Dis3’s exonuclease activity.
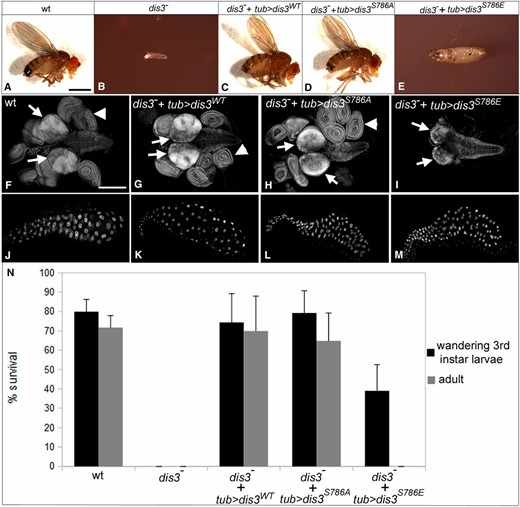
Dis3 phosphorylation inhibits Dis3 function in vivo. (A–E) Terminal phenotype of flies of indicated genotype. (F–I) Images of the larval brain/CNS (arrows) and imaginal disc complexes (arrowheads) and (J–M) salivary glands from third instar larvae of indicated genotype. (N) Graph of percent survival of flies of indicated genotype to wandering late third instar stage (black) or adulthood (gray). In A–I, wild type: FRT2A FRT82B; dis3−: dis31/dis32; dis3− + tub > dis3WT: UAS-dis3WT/+; tub-gal4 dis31/dis32; dis3− + tub > dis3S786A: UAS-dis3S786A/+, tub-gal4 dis31/dis32; and dis3− + tub > dis3S786E: UAS-dis3S786E/+; tub-gal4 dis31/dis32. Error bars indicate 95% confidence intervals. Bars, 1 mm in A–E and 200 µm in F–M.
Inhibition of Dis3 exonuclease activity leads to mitotic defects
The apparent defects in the mitotic cell cycle in larvae that lack dis3’s exonuclease function led us to examine the role of dis3 exonuclease activity in mitosis. Initially, we assessed the morphology of the mitotic spindle in dividing neuroblasts of wild-type third instar larvae and of third instar larvae homozygous mutant for dis3 that expressed the wild-type, nonphosphorylatable, or phosphomimetic dis3 transgene under the control of Tubulin-GAL4. All mitotic neuroblasts in wild-type (n = 30) or dis3 mutant larvae rescued by the wild-type dis3 transgene (n = 24) and all but one in dis3 mutant larvae rescued by the nonphosphorylatable transgene (n = 44) displayed normal mitotic spindles that spanned essentially the full width of the cell (Figure 4, A and B). In contrast, in dis3 mutant larvae rescued by the phosphomimetic transgene, 24% of mitotic neuroblasts (n = 8/34) exhibited defective mitotic spindles that were multipolar (12%; Figure 4C), disorganized (9%), or short (3%). Mitotic spindles were also shorter in dis31/2 mutant larvae, than in wild type (4.2 μm vs. 5.4 μm; n = 13; P < 0.003) and failed to span the full width of the cell 70% of the time (Figure 4D). We infer that dis3 exonuclease activity is required for normal mitotic spindle formation.
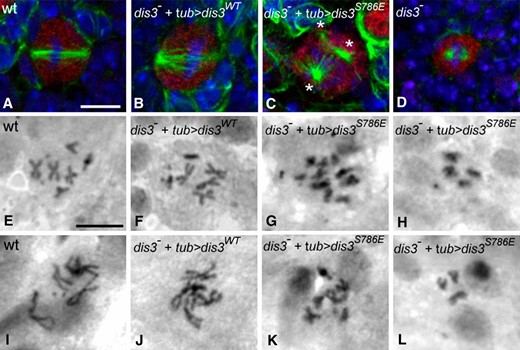
Loss of Dis3 exonuclease activity causes mitotic defects and excessive chromosome condensation. (A–D) Larvae of the indicated genotype labeled for neuroblasts (red), microtubules (green), and DNA (blue). (C) Inhibition of Dis3 exonuclease activity induces mitotic defects, such as multipolar spindles: * indicates three microtubule organizing centers. (D) dis31/2 larvae possess shortened mitotic spindles. (E–L) Orcein staining of chromosomes in (E–H) hypotonic- and colchicine-treated or (I–L) only hypotonic-treated neuroblasts of indicated genotypes. Genotypes are as detailed in Figure 3. Bar, 5 µm.
Consistent with mitotic defects, using aceto-orcein to stain chromosomes in mitotic neuroblasts in squashed preparations of late third instar larval brains, we found that 5% of mitotic neuroblasts exhibited obvious aneuploidy in dis3 mutant larvae rescued with the phosphomimetic dis3 transgene compared to 0%, 0.1%, and 0.2% of mitotic neuroblasts exhibiting this phenotype in wild-type larvae or dis3 mutant larvae rescued with the wild-type or nonphosphorylatable dis3 transgene (Table 2; Figure 4, E–H). In addition, 44.0% of mitotic neuroblasts displayed overcondensed chromosomes in dis3 mutant larvae rescued with the phosphomimetic transgene compared to 0, 0.5, and 1.3% of mitotic neuroblasts exhibiting this phenotype in wild-type larvae or dis3 mutant larvae rescued with the wild-type or nonphosphorylatable dis3 transgene (Table 2; Figure 4, I–L). Overcondensed chromosomes are commonly seen when cells are blocked in mitosis, as chromosome condensation occurs during the arrest. Consistent with this, a significantly higher fraction of larval brain neuroblasts labeled positive for the mitotic marker phosphohistone H3 in dis3 mutant larvae rescued with the phosphomimetic transgene relative to wild-type larvae or dis3 mutant larvae rescued with the wild-type or nonphosphorylatable transgene (Table 2). The high degree of chromosome condensation and high mitotic index of cells that lack dis3 exonuclease activity suggest that these cells are blocked or delayed in mitosis and that dis3’s exonuclease activity is required for mitotic exit.
Dis3 RNA exonuclease activity is required for normal mitosis
| Genotype | Aneuploidy (n) | Overcondensed chromosomes (n) | Mitotic index (n) |
|---|---|---|---|
| Wild-type | 0% (820) | 0% (450) | 14.1% (265/1878) |
| dis3− + dis3wta | 0.1% (1/927) | 0.5% (2/414) | 20.9% (280/1337) |
| dis3− + dis3S786Eb | 5.0% (8/160) | 44.0% (73/166) | 26.8% (398/1484) |
| dis3− + dis3S786A | 0.2% (2/819) | 1.3% (6/463) | 18.8% (314/1671) |
| P < 1 × 10⁻⁵c | P < 0.1 × 10⁻¹⁰c | dP < 0.0005 |
dis31/2 mutant larvae that express the wild-type dis3 transgene.
dis31/2 mutant larvae that express the phosphomimetic dis3 transgene.
Fisher’s exact test: comparing dis3− + dis3wt to dis3− + dis3S786E.
Chi-square test: comparing dis3− + dis3wt to dis3− + dis3S786E.
| Genotype | Aneuploidy (n) | Overcondensed chromosomes (n) | Mitotic index (n) |
|---|---|---|---|
| Wild-type | 0% (820) | 0% (450) | 14.1% (265/1878) |
| dis3− + dis3wta | 0.1% (1/927) | 0.5% (2/414) | 20.9% (280/1337) |
| dis3− + dis3S786Eb | 5.0% (8/160) | 44.0% (73/166) | 26.8% (398/1484) |
| dis3− + dis3S786A | 0.2% (2/819) | 1.3% (6/463) | 18.8% (314/1671) |
| P < 1 × 10⁻⁵c | P < 0.1 × 10⁻¹⁰c | dP < 0.0005 |
dis31/2 mutant larvae that express the wild-type dis3 transgene.
dis31/2 mutant larvae that express the phosphomimetic dis3 transgene.
Fisher’s exact test: comparing dis3− + dis3wt to dis3− + dis3S786E.
Chi-square test: comparing dis3− + dis3wt to dis3− + dis3S786E.
Reduction of dis3 activity deregulates proliferation in a Ras–ERK signaling-dependent manner
Elimination of dis3 function in yeast, flies, and vertebrate cells appears to reduce cell growth and division (Ohkura et al. 1988; Kiss and Andrulis 2010; Tomecki et al. 2014; and this article), but de novo, tumor-specific, apparently hypomorphic mutations in dis3 are found recurrently in multiple myeloma (Chapman et al. 2011; Walker et al. 2012; Lohr et al. 2014), a cancer of plasma B cells, suggesting that dis3 promotes progression of this cancer. To explore this possibility, we examined the phenotype of flies transheterozygous for dis31, dis32, or a deficiency of the region and dis3G5039, a P-element insertion of the P[EP] type (Rorth 1996) in dis3’s 5′ UTR, here referred to as dis3P. Flies of these genotypes are viable, largely infertile, morphologically normal (except for small bristles and occasional crumpled wings), and exhibit a ∼63% reduction in Dis3 protein levels (Figure S2A). Detailed analysis of oogenesis in these flies revealed that 65–74% of stage 5–6 egg chambers displayed excess posterior follicle cells (Figure 5, A and B; Figure S2, B and C; Table 3). Expression of the wild-type dis3 gene in these dis3 hypomorphic backgrounds rescued this phenotype (Figure S2D; Table 3). Thus, reduction of dis3 activity yields excess posterior follicle cells. Loss of epithelial polarity, via mutations in genes such as discs large, can cause follicle cell overproliferation (Goode and Perrimon 1997), but follicle cell polarity is grossly normal in these dis3 hypomorphic backgrounds (Figure S3), suggesting that reduction of dis3 activity drives overproliferation through a distinct mechanism.
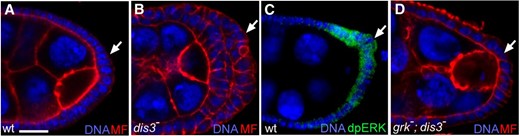
Reduction of Dis3 function promotes tissue growth. (A–D) High magnification views of the posterior portion of Drosophila egg chambers from wild-type (A and C), dis3P/Df(3R)BSC638 mutant (B), and grk2B/grk3; dis3P/dis32 mutant (D) females stained for DNA (blue; B–E), microfilaments (red; A, B, and D), and dpERK (green; C). Arrows point to posterior follicle cells. Bar, 10 μm.
Reduction of dis3 activity induces ras-dependent overproliferation in the ovary
| Genotype | % egg chambers with posterior overproliferation | n |
|---|---|---|
| WT | 0 | 100 |
| dis3G5039/Df(3R)BSC638 | 74 | 68 |
| dis3G5039/dis31 | 70 | 46 |
| dis3G5039/dis32 | 65 | 101 |
| grk2B/grk3; dis3G5039/dis32 | 6a | 94 |
| actin gal4/+; dis3G5039/dis31 | 0b | 50 |
| Genotype | % egg chambers with posterior overproliferation | n |
|---|---|---|
| WT | 0 | 100 |
| dis3G5039/Df(3R)BSC638 | 74 | 68 |
| dis3G5039/dis31 | 70 | 46 |
| dis3G5039/dis32 | 65 | 101 |
| grk2B/grk3; dis3G5039/dis32 | 6a | 94 |
| actin gal4/+; dis3G5039/dis31 | 0b | 50 |
Fisher’s exact test: P < 1 × 10⁻¹⁸ comparing grk2B /grk3; dis3G5039/dis32 to dis3G5039/dis32.
Fisher’s exact test: P < 1 × 10⁻¹⁵ comparing actin gal4/+; dis3G5039/dis31 to dis3G5039/dis31.
| Genotype | % egg chambers with posterior overproliferation | n |
|---|---|---|
| WT | 0 | 100 |
| dis3G5039/Df(3R)BSC638 | 74 | 68 |
| dis3G5039/dis31 | 70 | 46 |
| dis3G5039/dis32 | 65 | 101 |
| grk2B/grk3; dis3G5039/dis32 | 6a | 94 |
| actin gal4/+; dis3G5039/dis31 | 0b | 50 |
| Genotype | % egg chambers with posterior overproliferation | n |
|---|---|---|
| WT | 0 | 100 |
| dis3G5039/Df(3R)BSC638 | 74 | 68 |
| dis3G5039/dis31 | 70 | 46 |
| dis3G5039/dis32 | 65 | 101 |
| grk2B/grk3; dis3G5039/dis32 | 6a | 94 |
| actin gal4/+; dis3G5039/dis31 | 0b | 50 |
Fisher’s exact test: P < 1 × 10⁻¹⁸ comparing grk2B /grk3; dis3G5039/dis32 to dis3G5039/dis32.
Fisher’s exact test: P < 1 × 10⁻¹⁵ comparing actin gal4/+; dis3G5039/dis31 to dis3G5039/dis31.
During oogenesis, Gurken, an EGF-ligand, signals via the EGF–Ras–ERK pathway to specify posterior follicle cell fate (Neuman-Silberberg and Schüpbach 1993; Nilson and Schüpbach 1999), an event marked by accumulation of the active, diphosphorylated form of ERK in posterior follicle cells (Figure 5C) (Gabay et al. 1997). The Ras–ERK pathway promotes cell proliferation in many contexts (e.g., Murphy and Blenis 2006). Thus, we asked whether posterior follicle cell overgrowth in dis3 hypomorphic backgrounds depended on gurken function: Reducing gurken function in otherwise dis3P/dis3null flies suppressed follicle cell overgrowth essentially to wild type (Figure 5D; Table 3). The observed overgrowth of follicle cells then requires gurken function and that of the Ras–ERK pathway. In dis3 single mutants, although posterior follicle cell number is increased, the levels of active diphosphorylated ERK in those posterior follicle cells that abut the oocyte, the source of the Gurken signal, appear qualitatively similar (Figure S2, E and F). Thus, dis3 appears to act downstream of or in parallel to ERK to inhibit the ability of posterior follicle cells to divide in response to Ras–ERK pathway activity.
To test whether attenuating dis3 activity and elevating Ras–ERK pathway activity can drive tissue overgrowth in other contexts, we used the GAL4/UAS system and the dpp-GAL4 and 1096-GAL4 driver lines to deplete dis3 function and/or elevate Ras–ERK activity in restricted sets of cells in developing eye and wing imaginal discs (marked by coactivation of the UAS-GFP transgene; Figure 6; Figure S4). To reduce dis3 function, we drove expression of a UAS-linked dis3-RNAi transgene; to elevate Ras–ERK pathway activity, we drove expression of UAS-linked transgenes of rasV12 or rafF179—constitutively active forms of ras and raf. Expression of the dis3-RNAi transgene by itself had no gross effect on the size or shape of eye or wing imaginal discs or of the size of GFP+ tissue (Figure 6, B and I; Figure S4). Expression of either the rasV12 or rafF179 transgene led to an increase in the size of GFP+ tissue (Figure 6, C, E, and I; Figure S4). Coexpression of the dis3 RNAi transgene with rasV12 or the rafF179 elicited a significant increase in the size of GFP+ tissue relative to that observed upon expression of rasV12 or rafF179 alone (Figure 6, D, F, and I; Figure S4). In contrast, coexpression of the dis3-RNAi transgene with either wild-type or dominant-negative versions of ras or raf failed to elicit overgrowth of GFP+ tissue (Figure 6I; Figure S4). Similarly, coexpression of rasV12 with RNAi constructs for two RNA metabolism genes—the RNA export factor short bristles (sbr) or the Drosophila ortholog of the Rop-1 RNA binding protein (CG10803)—had no effect on the size of GFP+ tissue above that seen for rasV12 alone (Figure 6, G–I; Figure S4). Thus, we observed enhanced tissue growth in multiple developmental contexts specifically in genetic combinations marked by reduced dis3 activity and elevated ras or raf activity.
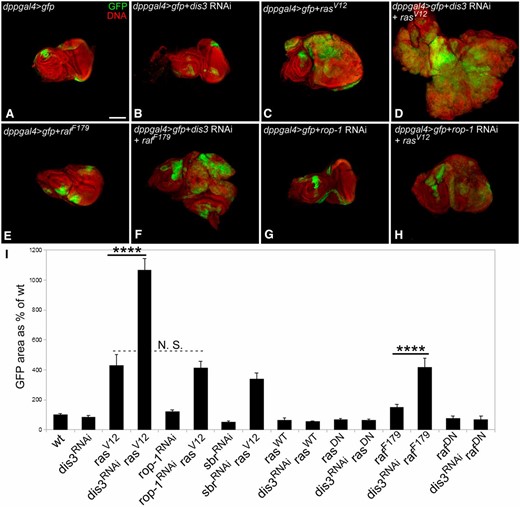
Dis3 and the Ras–ERK pathway genetically interact to drive tissue overgrowth. (A–H) Low magnification views of eye-antennal imaginal discs in which GFP (green) and the indicated UAS-linked transgenes (e.g., dis3RNAi) were driven under the control of dpp-GAL4. DNA is shown in red. Bar, 100 µm. (I) Graph showing the total area of GFP-expressing cells in eye imaginal discs in which the indicated transgenes and GFP were driven by dpp-GAL4 relative to the total area of GFP+ tissue in eye-antennal imaginal discs of dpp-GAL4/UAS-GFP flies. rasDN: ras dominant negative; rafDN: raf dominant negative. ****P-value < 1 × 10⁻¹⁰; N.S., not significant. Quantification assays were performed on eye-antennal discs taken from female larvae. N ≥ 7 for each genotype in I. Error bars indicate 95% confidence intervals.
We next used the Fly-FUCCI system (Zielke et al. 2014) to measure the proportion of cells in G1, S, or G2/M in wild-type wings and in wings with reduced dis3 activity, elevated Ras activity, or both (Figure 7; Table S1). As shown previously (Prober and Edgar 2000), elevating Ras activity accelerates cells through G1/S and they stack up in G2/M, resulting in a decreased fraction of cells in G1 and an increased fraction of cells in G2/M relative to wild type. Depletion of dis3 activity alone also led to a clear increased fraction of cells in G2/M. But, simultaneously reducing dis3 activity and elevating Ras activity dramatically decreased the fraction of cells in G2/M and increased the fraction of cells in S phase relative to either single mutant or wild type (Table S1). We infer that simultaneously reducing dis3 activity and elevating Ras activity drives cells more quickly through G2/M even though either genetic insult on its own causes cells to accumulate in G2/M.
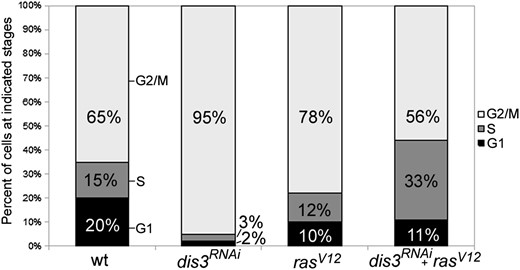
dis3 and ras cooperate to accelerate cells through the G2/M phase. Graph shows the relative percentage of cells of the indicated genotype in the G1, S, and G2/M phases of the cell cycle. All analysis was conducted on wing imaginal discs obtained from late wandering third instar larvae heterozygous for MS1096-GAL4, UAS-CFP::E2F, UAS-VenusNLS::CycB, and the indicated UAS-linked dis3RNAi and/or rasV12 transgenes.
dis3 genetic interacts with ras in worms
To test if the genetic interaction between dis3 and ras is conserved, we turned to the C. elegans and mouse systems. In C. elegans, the Ras–ERK pathway regulates oocyte number and size: reduced let-60/ras activity results in fewer, larger oocytes; increased activity results in more, smaller oocytes (Lee et al. 2007). To determine if dis3 genetically interacts with the Ras–ERK pathway during C. elegans oogenesis, we took advantage of the let-60ga89 temperature-sensitive gain-of-function allele. At permissive temperature with and without control RNAi-treatment, the germ lines of worms that carry let-60ga89 exhibit elevated levels of dpERK in the germline, but yield a morphologically wild-type linear row of five oocytes at 24 hr past the last larval stage (Figure 8A) (Lee et al. 2007). Germ line-specific depletion of dis3 activity in wild-type worms also resulted in a morphologically wild-type linear row of five oocytes at this stage (Figure 8A). In contrast, when we carried out germ-line-specific depletion of dis3 activity at the permissive temperature in worms that carried the let-60ga89 allele, we observed a disorganized cluster of 14–20 oocytes in the germ line (Figure 8A, arrowheads). This phenotype is normally only observed in let-60ga89 worms raised at restrictive temperature, suggesting that reduction of dis3 activity and elevation of let-60/ras activity genetically interact in worms to regulate oocyte number and size, as they do in flies to regulate cell division.
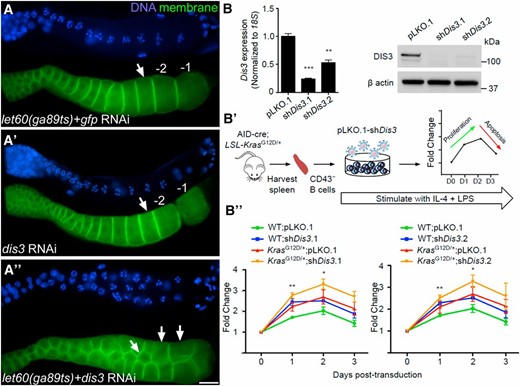
Reduction of dis3 function enhances cell proliferation in mice. (A) dis3 and ras interact in the C. elegans germ line. Proximal region of C. elegans germ lines of indicated genotypes labeled for DNA (blue) and cell membranes (green). (A) Attenuated germ-line-specific RNAi of dis3 in an rrf-1pk1417 background yields oocytes (arrow) of wild-type size and morphology; the rrf-1 mutant prevents RNAi in the soma but not the germ line (Sijen et al. 2001). (A′) At permissive temperature, germ lines of let-60/rasga89ts worms also exhibit wild-type oocyte size and morphology. (A′′) At permissive temperature, reduction of dis3 function in the let-60/rasga89ts background leads to a small oocyte phenotype. Bar, 20 μm. (B) dis3 knockdown drives hyper-proliferation of murine splenic naive B cells. (B) Validation of shRNAs targeting murine Dis3 mRNA by qPCR and immunoblot of DIS3 in Arf−/− mouse embryonic fibroblasts transduced with empty pLKO.1 or one of two shDis3 constructs. 18S was used for qPCR normalization, and β-actin as a loading control for immunoblots. (B′) Outline of experimental approach. CD43− splenic naive B cells were isolated from KaLwRij AID-Cre; LSL-KrasG12D/+ or AID-Cre; LSL-Kras+/+ spleens and stimulated with IL-4 and LPS for 24 hr. Cells were then transduced and cell numbers counted on successive days. (B′′) Growth curves of AID-Cre; LSL-Kras+/+ and AID-Cre; LSL-KrasG12D/+ CD43− splenic B cells transduced with empty pLKO.1 or one of two shDis3 constructs (n = 3). Asterisks in B′′ correspond to Dis3 knockdown in Kras+/+ cells vs. empty vector control in the same background. Error bars indicate SEM. *P < 0.05, **P < 0.005, ***P < 0.0005, using Student’s t-test.
Reduction of dis3 function enhances murine B cell proliferation under growth stimulatory conditions
In humans, mutations in dis3 are found recurrently in multiple myeloma, a tumor of plasma B cells. In vitro studies of the most common dis3 mutations in multiple myeloma appear to reduce but not eliminate dis3 function (Tomecki et al. 2014). Thus, we sought to test whether reducing dis3 function increased proliferation in a relevant B cell context in the presence of proliferative signals and increased ERK activation. We validated a panel of shRNAs targeting murine Dis3 for robust knockdown of messenger RNA (mRNA) and protein (Figure 8B) and then tested the effect of dis3 knockdown on naive B cell proliferation following LPS and IL-4 stimulation, which trigger the normally quiescent B cells to divide and undergo class switch recombination. For constitutive Ras signaling, naive B cells were isolated from C57BL/KaLwRij AID-Cre;LSL-Kras+/+ and AID-Cre;LSL-KrasG12D/+ mice. These mice harbor the oncogenic KrasG12D allele silenced by a “lox-stop-lox” cassette, which is removed by Cre-mediated recombination in B cells undergoing class switch recombination. When we infected Kras+/+ B cells with lentiviruses expressing dis3 shRNAs and monitored cell proliferation, we observed a significant increase in B cell growth relative to empty-vector transduced cells (Figure 8B). When we depleted dis3 function in KrasG12D/+-expressing B cells, we also observed an increase in B cell growth relative to either KrasG12D/+-expressing cells or dis3-depleted cells alone, but this increase did not reach statistical significance (Figure 8B). We infer that under specific growth stimulatory conditions reduction of dis3 can enhance cell proliferation from flies to mice.
Discussion
Dis3’s apparent role in multiple myeloma has been confounding. It is one of the most frequently mutated genes in multiple myeloma, and these mutations appear to reduce Dis3 activity (Chapman et al. 2011; Walker et al. 2012; Lohr et al. 2014). But, reduction of dis3 function in yeast leads to a failure or delay in mitosis (Ohkura et al. 1988; Kinoshita et al. 1991), and studies in vertebrate cell lines using the multiple myeloma-specific Dis3 mutations indicate they reduce, rather than enhance, cell growth and proliferation (Tomecki et al. 2014). Our work in flies extends these findings: elimination or strong reduction of dis3 function or specifically of its exonuclease activity inhibits mitotic cell division. On the other hand, mild reduction of dis3 function enhances cell proliferation in the presence of elevated Ras–ERK signaling activity in some tissues. Through pilot studies in worms and mice, we confirmed that dis3 and ras interact in worms and that reduction of dis3 function can enhance cell proliferation in murine plasma B cells, a cell type directly relevant to multiple myeloma, at least under growth stimulatory conditions. Thus, our work provides clear experimental evidence that reduction, not elimination, of dis3 function can, in specific contexts, enhance cell proliferation.
Clearly, dis3 function must exceed some threshold for cells to divide, a characteristic of many genes. But, how might reduction of dis3 function enhance cell proliferation? Here, we draw a parallel to dis2/PP1, a gene that displays similar cell cycle phenotypes to dis3 in S. pombe and flies (Ohkura et al. 1988; Axton et al. 1990). During mitosis, Dis2/PP1 activity is thought to prevent chromosome separation until all chromosome pairs are bioriented on the mitotic spindle (Vanoosthuyse and Hardwick 2009; Meadows et al., 2011); once this criterion is met, its activity is thought to be directly inhibited by CDK1-mediated phosphorylation (Yamano et al. 1994; Kwon et al. 1997; Trinkle-Mulcahy et al. 2003), and chromosome separation and anaphase commence. Thus, Dis2 activity must be on and then off at sequential stages of the cell cycle for the cell to cycle normally. Pharmacological inhibition of PP1 in cycling Xenopus embryo extracts has been shown to trigger premature mitotic entry (Walker et al. 1992). We speculate that, like Dis2, the activity of Dis3 is regulated during the cell cycle, with our work raising, but not definitely answering, the contention that CDK1 turns Dis3 activity off during mitosis. Our FUCCI data support a role for dis3 in delaying progress through G2/M at least in the presence of elevated Ras activity, which by itself accelerates cells through G1–S, causing them to stack up in G2/M. As observed for Dis2/PP1, diminution of dis3 activity might then trigger premature mitotic entry at least under specific growth stimulatory conditions. In support of this idea, Dis3 associates with Ran and RCC1 (Noguchi et al. 1996), and mutations in each gene have been shown to trigger premature mitotic entry in yeast (Matsumoto and Beach 1991). As RCC1 associates with chromatin, recent work by Eberle et al. (2015) and prior work in yeast that identify a function for dis3 in heterochromatic gene silencing (Murakami et al. 2007) hint that dis3 could regulate cell cycle progression via an epigenetic mechanism. Significant work is needed to clarify how Dis3 regulates cell cycle progression, but we note that the combination of elevated Ras activity and reduced dis3 activity may allow cells to accelerate through both G1–S and G2–M transitions, providing a recipe, or at least predisposition, for deregulated cell and tissue growth.
Dis3’s exonuclease, not endonuclease, activity appears critical for its cell cycle function. In flies, Dis3’s exonuclease activity is required for mitotic cells to grow and divide (but not for endoreduplicative cells to grow). In humans, most multiple myeloma-specific mutations in dis3 cluster in its exonuclease domain and appear to reduce, but not eliminate, Dis3 exonuclease activity (Chapman et al. 2011; Walker et al. 2012; Lohr et al. 2014; Tomecki et al. 2014). Thus, Dis3 likely mediates its effects on cell division via exonucleolytic degradation or modification of specific RNA species that regulate cell cycle progression. Clearly, Dis3 could control the cell cycle by targeting individual mRNAs or micro RNAs (miRNAs). In support of this idea, in human myeloma cell lines and mouse NIH3T3 cells, reduction of dis3 activity appears to decrease let-7 miRNA expression, causing increased expression of let-7 target genes, including ras and myc (Segalla et al. 2015). In fly wing imaginal discs, knockdown of dis3 mRNA modestly decreases let-7 miRNA expression (Towler et al. 2015), but in our hands reducing let-7 activity by itself in the fly ovary, via expression of a let-7 miRNA sponge, did not recapitulate the posterior follicle cell overproliferation phenotype observed in dis3 hypomorphic backgrounds (M. J. Snee and J. B. Skeath, unpublished observations). An alternative, nonmutually exclusive model is that dis3 might regulate cell division epigenetically. In yeast, Dis3 has been shown to associate with centromeric-repeat DNA, promote heterochromatin silencing at centromeres, and inhibit accumulation of noncoding centromeric repeat RNAs (Murakami et al. 2007; Bernard et al. 2010). Moreover, small centromeric RNAs have been shown to regulate centromere formation and function in human cells and maize (Topp et al. 2004; Wong et al. 2007). Additional experimental data are needed to support either model with future work focusing on the identification of RNAs bound by Dis3 and the elucidation of the function of these RNAs or their encoded products on cell cycle progression.
Acknowledgments
We thank Doug Chalker, Sally Elgin, Tim Schedl, and Susan Dutcher for helpful discussions and/or critical review of the manuscript and Trudi Schüpbach, Lori Wallrath, Sally Elgin, Paul Macdonald, Greg Longmore, Kathy Matthews, Kevin Cook, the Iowa Developmental Studies Hybridoma Bank (Eunice Kennedy Shriver National Institute of Child Health and Human Development), and the Bloomington Stock Center for reagents and/or fly strains. This research was funded by grants from the National Institutes of Health (NIH) (GM98200) and the American Cancer Society (RSG-14-044-01-DDC) to S.A., an NIH grant (R01CA175349) to M.H.T., and a National Science Foundation grant (IOS-0744261) and an NIH grant (NS036570) to J.B.S. The funders had no role in study design, data collection and analysis, decision to publish, or preparation of the manuscript.
Footnotes
Communicating editor: D. I. Greenstein
Supplemental material is available online at www.genetics.org/lookup/suppl/doi:10.1534/genetics.116.187930/-/DC1.
