


Abstract
One of the central questions in evolutionary genetics is how much of the genome is involved in the early stages of divergence between populations, causing them to be reproductively isolated. In this article, we investigate genomic differentiation in a pair of closely related field crickets (Gryllus firmus and G. pennsylvanicus). These two species are the result of allopatric divergence and now interact along an extensive hybrid zone in eastern North America. Genes encoding seminal fluid proteins (SFPs) are often divergent between species, and it has been hypothesized that these proteins may play a key role in the origin and maintenance of reproductive isolation between diverging lineages. Hence, we chose to scan the accessory gland transcriptome to enable direct comparisons of differentiation for genes known to encode SFPs with differentiation in a much larger set of genes expressed in the same tissue. We have characterized differences in allele frequency between two populations for >6000 SNPs and >26,000 contigs. About 10% of all SNPs showed nearly fixed differences between the two species. Genes encoding SFPs did not have significantly elevated numbers of fixed SNPs per contig, nor did they seem to show larger differences than expected in their average allele frequencies. The distribution of allele frequency differences across the transcriptome is distinctly bimodal, but the relatively high proportion of fixed SNPs does not necessarily imply “ancient” divergence between these two lineages. Further studies of linkage disequilibrium and introgression across the hybrid zone are needed to direct our attention to those genome regions that are important for reproductive isolation.
THE study of speciation, defined as the origin of intrinsic barriers to gene exchange (Mayr 1942; Harrison 1998; Coyne and Orr 2004), relies on comparisons of phenotypes and genotypes among diverging populations, strains, subspecies, or closely related species. In recently diverged taxa, observed differences in genotypes or phenotypes are likely to be associated with the origin of reproductive barriers and less likely to be differences that have accumulated subsequent to initial divergence. As Templeton (1981) emphasized, our ultimate goal is to understand the genetics of speciation, not simply the genetics of species differences.
It is now widely recognized that the amount of divergence between populations or species will vary across the genome due to selective and random lineage sorting from polymorphic ancestral populations and differential introgression when diverging taxa hybridize where their distributions overlap (Harrison 1991; Wu 2001; Turner et al. 2005; Nosil et al. 2009). Barton and Hewitt (1981) explicitly argued that gene exchange between hybridizing taxa will depend on genome region. Differential introgression has been widely discussed and documented in the hybrid zone literature (Harrison 1990; Rieseberg et al. 1999; Payseur 2010), where species boundaries have been described as semipermeable. Chromosome regions that harbor genes that contribute to reproductive isolation or local adaptation will have reduced levels of gene flow.
The notion that genomes should be viewed as mosaics of different evolutionary histories also emerges from observations of discordance among individual gene genealogies for closely related groups of species (Beltran et al. 2002; Machado and Hey 2003; Dopman et al. 2005; Putnam et al. 2007; Geraldes et al. 2008; White et al. 2009; Carneiro et al. 2010). Some loci reveal species to be reciprocally monophyletic or exclusive; at other loci, haplotypes do not sort by species and may even be shared across species. Genome scans of allele frequencies for microsatellite loci, AFLPs, or SNPs also suggest substantial heterogeneity in amounts of differentiation with “FST outliers” marking regions that have become (or have remained) differentiated (Emelianov et al. 2004; Grahame et al. 2006; Via and West 2008; Wood et al. 2008). These observations have given rise to a diversity of terms that refer to the fact that genome divergence is heterogeneous and that we can exploit this heterogeneity to identify gene regions that contribute to reproductive isolation and/or have experienced a recent selective sweep. Increasingly sophisticated molecular tools and the ease with which we can generate massive amounts of sequence data make it far easier to scan the genome (or parts of the genome with reduced complexity) and search for regions that exhibit fixed differences or major shifts in allele frequencies between recently diverged taxa.
An alternative to the genome-scan approach is to identify candidate genes/proteins that might account for phenotypic differences responsible for reproductive barriers. Considerable attention has recently focused on the evolution of seminal fluid proteins (SFPs) in a wide variety of taxa (Dorus et al. 2004; Clark et al. 2006; Walters and Harrison 2010; Walters and Harrison 2011). In insects, male accessory glands are the site of synthesis and secretion of SFPs that are transferred from male to female during copulation (Wolfner 1997; Gillott 2003). Evolutionary genetic analyses have revealed that, although most of these proteins are subject to selective constraints, many are rapidly evolving, partly as the result of differential selection pressures (Andrés et al. 2006; Dean et al. 2008, 2009; Ramm et al. 2009; Walters and Harrison 2010, 2011). Although the functional and evolutionary consequences of this rapid divergence are not fully understood, experimental work suggests that SFPs may play a key role in reproductive isolation between diverging lineages (Andrés and Arnqvist 2001; Turner and Hoekstra 2008; Marshall et al. 2011). Thus, a priori, we might expect genes encoding SFPs to show elevated rates of molecular evolution and greater divergence between closely related species.
Here we combine the candidate gene and genome-scan approaches, using high-throughput sequencing to survey the male accessory gland transcriptomes of two closely related species of field crickets that interact in a well-characterized hybrid zone in North America. The two cricket species (Gryllus firmus and Gryllus pennsylvanicus) are estimated to have diverged ∼200,000 years ago (Broughton and Harrison 2003; Maroja et al. 2009). Attempts to identify fixed differences between the species have met with only limited success. Allozyme surveys and sequencing of mitochondrial DNA and nuclear gene introns failed to identify the two species as exclusive groups (Harrison and Arnold 1982; Willett et al. 1997; Broughton and Harrison 2003). However, analysis of anonymous nuclear RFLPs did uncover four apparently diagnostic loci (Harrison and Bogdanowicz 1997). These data suggest that much of the field cricket genome has remained undifferentiated following the origin of reproductive barriers. In contrast, recent proteomic analysis of spermatophore contents identified two SFP genes that exhibit nearly fixed differences and strong evidence that positive selection has been responsible for patterns of differentiation (Andres et al. 2008; Maroja et al. 2009).
In this article, we used both Sanger and 454 sequencing to assemble and characterize the transcriptome of the male cricket accessory gland. To detect SNPs, we then aligned millions of pooled Illumina reads from allopatric populations of each species to the Sanger/454 reference transcriptome. We characterized differences in allele frequency between the two populations for >6000 SNPs and >26,000 contigs and identified a subset of highly differentiated SNPs and contigs showing strong allele frequency differences. Using Sanger sequencing in a larger sample of crickets from the same allopatric populations, we confirmed that a sample of divergent contigs identified from Illumina reads indeed represents sequences that are highly divergent between the two cricket populations. Finally, we compared the patterns of transcriptome differentiation for SFP genes with genes expressed in the male accessory gland that are not SFPs.
Materials and Methods
Cricket samples
All crickets used in this study came from allopatric populations of the two species G. firmus (from Guilford, CT) and G. pennsylvanicus (from Ithaca, NY). Guilford is close to the hybrid zone and may show limited introgression of G. pennsylvanicus alleles. Ithaca is more distant from the hybrid zone and provides essentially “pure” G. pennsylvanicus. Independent samples from these populations were used for constructing each of the libraries described below (Sanger, 454, and Illumina) and for subsequent SNP validation.
Normalized Sanger library
Accessory glands were dissected from 10 anesthetized (chilled) adult male G. firmus (from Guilford, CT). Total RNA was extracted in TRIZOL (Invitrogen). A single pooled RNA sample was constructed using equimolar amounts of total RNA from each male. First-strand cDNA was prepared using the Creator SMART cDNA Synthesis Kit (Clontech). Briefly, complementary DNA (cDNA) was synthesized from the RNA pool, amplified by 11–13 PCR cycles using a 5′ PCR primer (5′-AAGCAGTGGTATCAACGCAGAGT-3′), and normalized with a TRIMMER kit (AXXORA). Normalized cDNA was digested with the restriction enzyme SfiI and ligated to pDNR-Lib for directional cloning. Ligated cDNA was used to transform Electromax DH5-α E cells (Invitrogen). Transformations were spread onto Luria–Bertani plates containing 30 mg/ml chloramphenicol. Colonies were randomly picked into 384-well plates containing 50 µl 0.5× AE buffer (Qiagen) per well. Plates were heated at 96° for 5 min, and 1 µl of supernatant was used as template for PCR with Platinum Taq polymerase (Invitrogen) and M13 primers. PCR products were treated with Exonuclease I (New England Biolabs) and Shrimp Alkaline Phosphatase (GE Healthcare) and sequenced with an M13 primer and BigDye v 3.1 terminators (Applied Biosystems).
Normalized Roche/454 library
To further characterize the accessory gland transcriptome, total RNA from a single Guilford G. firmus male accessory gland was extracted as described above. The concentration and quality of the total RNA was determined using an Agilent Bioanalyzer 2100. One microgram of total RNA was combined with 12 pmol SMART 3′ oligo(dT) primer (5′-AAGCAGTGGTATCAACGCAGAGTATTTTCTTTTTTCTTTTTTVN-3′), 12 pmol SMART 5′ rG primer (5-AAGCAGTGGTATCAACGCAGAGTACGCrGrGrG-3′), and RNase-free water in a 10-µl volume. The sample was heated at 65° for 5 min and placed on ice, and the following was added to the reaction: 2 µl 10× reverse transcriptase buffer, 4 µl 25 mM MgCl2, 2 µl 0.1 M DTT, 1 µl RNaseOUT, and 1 µl SuperScript reverse transcriptase (Invitrogen). The reaction was incubated at 45° for 1 hr, followed by 85° for 5 min. The sample was then diluted 40-fold, and 1 µl was PCR-amplified with Platinum Taq polymerase (Invitrogen) and a SMART IIA PCR primer (5′-AAGCAGTGGTATCAACGCAGAGTA-3′) for 14 cycles. We used the TRIMMER cDNA normalization kit to normalize the cDNA pool, following the manufacturer’s instructions.
Normalized cDNA was nebulized, and fragments were subjected to end repair/adenylation by incubating the cDNA with ATP, dNTPs, T4 polymerase, T4 polynucleotide kinase, and Taq polymerase (New England Biolabs). Samples were incubated at room temperature for 20 min (end repair) and at 72° for 20 min (adenylation of 3′ ends by Taq polymerase). Normalized cDNA (500 ng) was ligated to titanium adapters A and B. Ligation products were diluted 100-fold and amplified with the appropriate PCR primers (see Supporting Information, File S1). PCR products were checked on agarose gels, pooled, purified with a Qiaquick PCR purification kit (Qiagen), and submitted to the Genomics Facility of the Life Sciences Core Laboratory Center at Cornell for quantification, bead titration, and 454 sequencing.
Illumina tag libraries
Total RNA was extracted from the accessory gland of individual crickets as described above and quantified on a Nanodrop ND-1000 spectrophotometer. Equal amounts of total RNA from each cricket were combined in two separate pools, representing 15 G. firmus adult males (from Guilford, CT) and 15 G. pennsylvanicus adult males (from Ithaca, NY). First-strand synthesis, PCR amplification, and normalization of cDNA for each pool was carried out as described above for 454 sequencing. The two pools of normalized cDNA were then submitted to the Genomics Facility at the Cornell Life Sciences Core Laboratories Center for nebulization, end repair, and construction/sequencing of Illumina paired-end fragments (2 × 86 bp). Each species pool of cDNA was run on a single channel on a Solexa Genome Analyzer IIx.
Transcriptome assembly and annotation
Initial quality check of the 454 sequences was performed using Newbler (Margulies et al. 2005). Sanger and 454 reads were combined in a de novo assembly with NGen v2 (Lasergene 8.1.1, DNASTAR). Reads were end-trimmed (window length: five nucleotides with a minimum quality of 20) and scanned/trimmed for the plasmid pDNR-Lib and 454 adapters (mer length = 9, minimum matches = 3, trim length = 20, trim to end = 25). We used assembly parameters that are similar to those reported in other transcriptome assemblies (e.g., Vera et al. 2008; Renaut et al. 2010), including an estimate of 100× fixed coverage, an estimated transcriptome length of 20 Mb, gap penalty = 25, match size = 19, mismatch penalty = 25, and minimum match percent = 85. Both unassembled (single-read) and multi-read contigs (i.e., transcripts) were saved to a SeqmanPro file. The resulting fasta file was then used as a reference transcriptome for alignment of Illumina reads generated from pools of G. firmus and G. pennsylvanicus adult male accessory gland cDNAs. Functional annotation was performed using BLAST2GO using BLASTX and the default parameters.
SNP discovery
We screened the accessory gland transcriptome for SNPs using NextGene v1.99 (Softgenetics) in a series of sequential steps. First, we converted raw Illumina tags to fasta files (median score threshold ≥20, maximum number of uncalled bases ≤3, called base number for each read ≥25, trim or reject read when ≥3 bases with score ≤16). Second, the converted reads were sequentially trimmed by the following sequences: SMART 5′ rG primer, SMART PCR primer IIA, and the 3′ half of SMART PCR primer IIA. Third, the trimmed reads of the G. firmus and G. pennsylvanicus pools were independently aligned to the reference transcriptome using one round of condensation and one round of alignment (unambiguous mapping, matching requirement ≥12 bases, ≥90% identity, mutation filter ≤5, SNP allele >1 count, coverage >20, forward/reverse balance ≤0.05, and a read library size range of 50–300 bases). Fourth, resulting alignments were compared and screened for SNPs using the variant comparison tool. In our SNP analyses, we included only single-base substitutions. We excluded deletions/insertions and multiple base substitutions.
Transcriptome scan
The estimated SNP frequency differences are likely to depend on the set of bioinformatics parameters that we used to analyze our data; coverage and base quality scores are of particular importance. Therefore, we did test for the robustness of our results by varying parameter combinations and comparing the resulting data using permutation analyses (2 × 10³ simulations) as implemented in R v2.11.1(R Development Core Team 2010). Specifically, we tested if either increasing the quality base threshold (≥15 vs. ≥12) or reducing the coverage (≥30× vs. ≥40×) had a significant effect on our results.
For each contig, we also estimated the number of amino acid replacement SNPs per nonsynonymous site (pN) relative to the number of silent SNPs per synonymous site (pS). This index is equivalent to ω (dN/dS) ratios and, therefore, provides insight into the evolutionary forces driving molecular divergence between closely related lineages. We first generated all possible ORFs (minimum length: 200 nucleotides) using Getorf (European Molecular Biology Open Software) and kept the longest ORF of each contig as the most probable coding region of the gene. Then, we used a maximum-likelihood method to estimate pN/pS using PAML 4.2 (runmode = 0, CodonFreq = 2, model = 2) (Yang 2007). Putative mitochondrial and nuclear contigs were run separately using icode = 4 and 0, respectively. All analyses were carried out using R v2.11.1 and dnds,R, a specific code kindly provided by Sébastien Renaut (see Renaut et al. 2010). Mean pN/pS values were estimated by resampling (Bustamante et al. 2002), excluding those contigs with pS = 0 and infinite pN/pS.
Candidate gene approach
In animals with internal fertilization, a subset of genes encoding SFPs are rapidly evolving and often positively selected; they represent potential candidate barrier genes. We might then expect elevated allele frequency differences in genes encoding seminal fluid proteins. To test this hypothesis, we identified high-quality SNPs by aligning the Illumina tags to a reference set of 70 previously described SFPs (Andrés et al. 2006, 2008), keeping the same parameters used in our transcriptome scan. Using permutation analyses (R v2.11.1; R Development Core Team 2010), we first compared between SFPs and a subset of genes that, based on BLAST results, do not encode SFPs. However, because SFPs often rapidly evolve and their functions are not necessarily determined, it is possible that some fraction of the accessory gland contigs represent SFPs even if they are not currently annotated. To minimize this potential bias, we extended our analysis to compare contigs with or without predicted signal peptides (as a proxy for putative SFPs and non-SFPs, respectively). The significance of all permutation analyses was assessed using 2 × 10³ simulations.
Intraspecific polymorphism
To estimate the levels of intraspecific variation, we screened the transcriptome of each species for homologous sites exhibiting sequence variation. As above, we applied a stringent SNP definition and considered only those variable sites with a quality score ≥12 and MAF of 1%. Then, for each contig, we estimated the average number of nucleotide differences (π). Correlational analyses between polymorphism and divergence were carried out using Spearman’s ρ. Significance of permutation analyses was assessed as above. All statistical analyses were performed using R v2.11.1 (R Development Core Team 2010).
SNP validation and gene genealogies
To validate our transcriptome assembly and SNP identification methods, we used Sanger sequencing to characterize variation and divergence for a subset of contigs (n = 10) that showed at least three fixed SNPs and high interspecific allelic divergence values ( ranging from 0.85 to 1). We used a new panel of 32 crickets, 16 each from our two focal populations (G. firmus: Guilford, CT; G. pennsylvanicus: Ithaca, NY). Collectively, the contigs that we targeted contained a total of 60 putative SNPs. Selecting these highly divergent contigs allowed us to validate putative regions of genomic differentiation between the two crickets. In addition, we generated gene genealogies for this subset of genes and compared them with the genealogies of two highly differentiated SFP genes (AG-0005F and AG-0334P) that show almost exclusive relationships between the two species (Andrés et al. 2008; Maroja et al. 2009).
Predicted SNPs for the 10 loci were validated through PCR amplification and Sanger sequencing (primer sequences and conditions available upon request). Resulting amplicons were sequenced on a 3130xl DNA analyzer (Applied Biosystems) using BigDye v3.1 terminators. Haplotypes were reconstructed using Phase (Stephens et al. 2001) implemented in arlequin v3.5 (Schneider et al. 2000). For each contig, the optimal substitution model was determined using hierarchical likelihood-ratio test searches implemented in jmodeltest v0.1.1 (Posada 2008). Gene genealogies were reconstructed using the neighbor-joining (NJ) algorithm in paup v4.0 (Swofford 2003). We calculated nodal support using 1000 heuristic nonparametric bootstrap replicates.
Results
Transcriptome assembly and annotation
We have taken advantage of both Sanger sequencing and 454 sequencing technologies to characterize the transcriptome of the male accessory glands in two Gryllus species. After quality control, the resulting library contains 5.1 × 10⁵ sequences, 9.2 × 10⁶ nucleotides, 26,565 unique contigs (mean length 434 bp), and an average coverage of 4×. Although our transcriptome assembly may contain information on alternatively spliced variants (contig isoforms), we did not include this information in our assembly. Therefore, all contigs represent the longest isoforms. Illumina reads mapped to a subset of ∼15,000 contigs (average coverage: G. firmus: 40×, G. pennsylvanicus: 41×), half of them (n = 7,931) showing similarities with either functionally annotated genes or other insect genomes and ESTs (TBLASTX, e ≤ 10−5; Table S1). A significant fraction of these contigs (∼30%, 4635/15,000) have a predicted signal peptide, and as expected, some of them (n = 126) represent 42 previously described Gryllus SFPs. Almost 60% of the annotated genes (4669/7931) show strong similarities to other known genes and do not seem to be components of the seminal fluid (TBLASTX, e ≤ 10−10).
Frequency differences between G. firmus and G. pennsylvanicus
To identify SNPs, we mapped 7.6 million and 7.3 million high-quality Illumina reads for G. firmus and G. pennsylvanicus, respectively, onto the reference transcriptome. If a substantial number of the predicted SNPs were the result of random sequencing and assembly errors, a transition:transversion ratio of 1:2 would be expected. However, the observed transition:transversion ratio for our dataset is 1.55:1, suggesting that most of the SNPs are not false positives. A total of 9731 SNPs met our criteria for inferring allele frequencies. The distribution of the allele frequency divergence values for these SNPs is shown in Figure 1A. Many SNPs show low allelic divergence values (D < 0.2), but 11.6% (n = 1133) of the inferred SNPs are highly differentiated (D ≥ 0.98) between the two species. Thus, the distribution of allele frequency differences is distinctly bimodal. The distribution of the highly differentiated SNPs also varies among loci, with few contigs showing an accumulation of differentiated sites (Figure 1B).
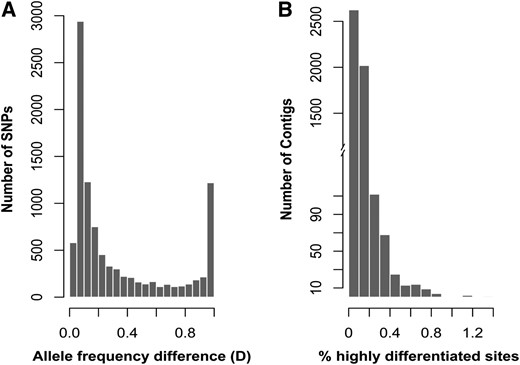
(A) Frequency distribution of the interspecific differentiation index (D) for each of the 9731 predicted SNPs in G. firmus and G. pennsylvanicus. For any given SNP, D represents allele frequency differences between the two species (see Materials and Methods). (B) Frequency distribution of the number of highly differentiated SNPs (D ≥ 0.98) per contig.
The mean allele frequency divergence value () for the 1175 contigs that have that have ≥3 SNPs (see Materials and Methods) ranged from 0.041 to 1, and ∼4% of these contigs showed an average allele frequency difference () of at least 0.98 (Figure 2, Table S2). Several of these highly divergent contigs show significant similarities with currently annotated genes (Table 1), including some genes encoded in the mitochondrial genome.
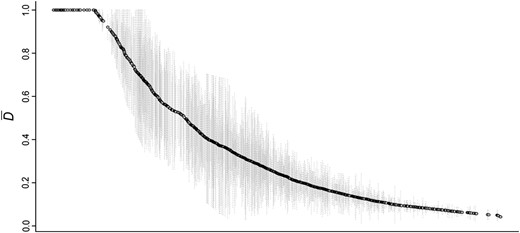
Ranked distribution of the mean interspecific differentiation index () between G. firmus and G. pennsylvanicus for each of the 1157 contigs that showed high coverage (≥20×) and at least three SNPs (see Materials and Methods). Lightly shaded vertical lines represent the standard error.
Annotation of most divergent contigs between G. firmus and G. pennsylvanicus [i.e., those showing interspecific differentiation index () > 0.98]
| SNPs | ||||
|---|---|---|---|---|
| Contig | Total | Per site | pN/pS | TBLASTX similarity |
| 70 | 10 | 0.0056 | ∞ | Cytochrome b |
| 310 | 9 | 0.0082 | 0.348 | NADH dehydrogenase subunit 2 (ND2) |
| 454 | 6 | 0.0073 | — | Teleogryllus emma mitochondrion |
| 755 | 6 | 0.0026 | 0.612 | NS |
| 618 | 5 | 0.0037 | ∞ | Conserved protein (similar to cyclin-D1-binding protein 1) |
| 1341 | 5 | 0.0044 | 0.076 | Citrate lyase β-like protein |
| 1699 | 5 | 0.0018 | — | Similar to Tribolium castaneum ADP ribosylation factor |
| 1774 | 5 | 0.0040 | 0 | NS |
| 1903 | 5 | 0.0026 | 0.090 | NS |
| 1978 | 5 | 0.0075 | ∞ | Similar to conserved hypothetical protein |
| 5368 | 5 | 0.0068 | 0.411 | NS |
| 1309 | 4 | 0.0023 | 0 | Similar to T. castaneum B52 CG10851-PA |
| 1412 | 4 | 0.0041 | — | Insect conserved protein |
| 1721 | 4 | 0.0061 | 0 | Similar to Gryllus bimaculatus mRNA, GBcontig28218 |
| 5711 | 4 | 0.0053 | 0.878 | GalNAc transferase 6-like |
| 7164 | 4 | 0.0065 | — | NS |
| 14713 | 4 | 0.0092 | — | NS |
| 87 | 3 | 0.0021 | 0 | Similar to G. bimaculatus mRNA, GBcontig31800 |
| 580 | 3 | 0.0037 | — | Similar to Nasonia vitripennis p15-2a protein |
| 937 | 3 | 0.0021 | ∞ | Dynactin subunit 4 (Dctn4) |
| 963 | 3 | 0.0038 | — | Similar to growth hormone-inducible soluble protein |
| 1101 | 3 | 0.0017 | 0.130 | NS |
| 1275 | 3 | 0.0021 | ∞ | Protease regulatory subunit S10B |
| 1306 | 3 | 0.0045 | — | Similar to translocase of outer membrane 7 |
| 1374 | 3 | 0.0033 | ∞ | Conserved protein: unknown |
| 1415 | 3 | 0.0023 | — | Myosin essential light chain |
| 1513 | 3 | 0.0026 | ∞ | UBX domain-containing protein |
| 1667 | 3 | 0.0033 | — | Similar to G. bimaculatus mRNA, GBcontig12028 |
| 2182 | 3 | 0.0023 | — | Histone h2a |
| 2658 | 3 | 0.0022 | 0.562 | NS |
| 3084 | 3 | 0.0019 | — | Similar to Glossina morsitans mRNA |
| 3432 | 3 | 0.0053 | ∞ | Similar to DnaJ (Hsp40) |
| 3566 | 3 | 0.0036 | — | NS |
| 3758 | 3 | 0.0026 | ∞ | NADH dehydrogenase. Mitochondrial |
| 3843 | 3 | 0.0017 | 0 | Translation initiation factor 4 gamma |
| 4655 | 3 | 0.0037 | 0.148 | Conserved protein: unknown |
| 5777 | 3 | 0.0015 | ∞ | Similar to transport and Golgi organization 1 (Tango1) |
| 6030 | 3 | 0.0035 | 0.147 | Ethanolaminephosphotransferase |
| 8373 | 3 | 0.0044 | ∞ | Asparagine synthetase |
| 9851 | 3 | 0.0050 | 0 | NS |
| 14741 | 3 | 0.0115 | 0.570 | Similar to eritrophin-like protein 1 |
| 6271 | 3 | 0.0114 | — | NS |
| 6026 | 3 | 0.0035 | — | ω-Amidase (NIT2-B) |
| 4450 | 3 | 0.0035 | — | Similar to G. bimaculatus mRNA, GBcontig24459 |
| 861 | 4 | 0.0042 | 0.143 | Ribulose-5-phosphate-3-epimerase mRNA |
Contigs in boldface type correspond to mitochondrial loci. NS, nonsignificant (E-value > 10−3) similarity.
| SNPs | ||||
|---|---|---|---|---|
| Contig | Total | Per site | pN/pS | TBLASTX similarity |
| 70 | 10 | 0.0056 | ∞ | Cytochrome b |
| 310 | 9 | 0.0082 | 0.348 | NADH dehydrogenase subunit 2 (ND2) |
| 454 | 6 | 0.0073 | — | Teleogryllus emma mitochondrion |
| 755 | 6 | 0.0026 | 0.612 | NS |
| 618 | 5 | 0.0037 | ∞ | Conserved protein (similar to cyclin-D1-binding protein 1) |
| 1341 | 5 | 0.0044 | 0.076 | Citrate lyase β-like protein |
| 1699 | 5 | 0.0018 | — | Similar to Tribolium castaneum ADP ribosylation factor |
| 1774 | 5 | 0.0040 | 0 | NS |
| 1903 | 5 | 0.0026 | 0.090 | NS |
| 1978 | 5 | 0.0075 | ∞ | Similar to conserved hypothetical protein |
| 5368 | 5 | 0.0068 | 0.411 | NS |
| 1309 | 4 | 0.0023 | 0 | Similar to T. castaneum B52 CG10851-PA |
| 1412 | 4 | 0.0041 | — | Insect conserved protein |
| 1721 | 4 | 0.0061 | 0 | Similar to Gryllus bimaculatus mRNA, GBcontig28218 |
| 5711 | 4 | 0.0053 | 0.878 | GalNAc transferase 6-like |
| 7164 | 4 | 0.0065 | — | NS |
| 14713 | 4 | 0.0092 | — | NS |
| 87 | 3 | 0.0021 | 0 | Similar to G. bimaculatus mRNA, GBcontig31800 |
| 580 | 3 | 0.0037 | — | Similar to Nasonia vitripennis p15-2a protein |
| 937 | 3 | 0.0021 | ∞ | Dynactin subunit 4 (Dctn4) |
| 963 | 3 | 0.0038 | — | Similar to growth hormone-inducible soluble protein |
| 1101 | 3 | 0.0017 | 0.130 | NS |
| 1275 | 3 | 0.0021 | ∞ | Protease regulatory subunit S10B |
| 1306 | 3 | 0.0045 | — | Similar to translocase of outer membrane 7 |
| 1374 | 3 | 0.0033 | ∞ | Conserved protein: unknown |
| 1415 | 3 | 0.0023 | — | Myosin essential light chain |
| 1513 | 3 | 0.0026 | ∞ | UBX domain-containing protein |
| 1667 | 3 | 0.0033 | — | Similar to G. bimaculatus mRNA, GBcontig12028 |
| 2182 | 3 | 0.0023 | — | Histone h2a |
| 2658 | 3 | 0.0022 | 0.562 | NS |
| 3084 | 3 | 0.0019 | — | Similar to Glossina morsitans mRNA |
| 3432 | 3 | 0.0053 | ∞ | Similar to DnaJ (Hsp40) |
| 3566 | 3 | 0.0036 | — | NS |
| 3758 | 3 | 0.0026 | ∞ | NADH dehydrogenase. Mitochondrial |
| 3843 | 3 | 0.0017 | 0 | Translation initiation factor 4 gamma |
| 4655 | 3 | 0.0037 | 0.148 | Conserved protein: unknown |
| 5777 | 3 | 0.0015 | ∞ | Similar to transport and Golgi organization 1 (Tango1) |
| 6030 | 3 | 0.0035 | 0.147 | Ethanolaminephosphotransferase |
| 8373 | 3 | 0.0044 | ∞ | Asparagine synthetase |
| 9851 | 3 | 0.0050 | 0 | NS |
| 14741 | 3 | 0.0115 | 0.570 | Similar to eritrophin-like protein 1 |
| 6271 | 3 | 0.0114 | — | NS |
| 6026 | 3 | 0.0035 | — | ω-Amidase (NIT2-B) |
| 4450 | 3 | 0.0035 | — | Similar to G. bimaculatus mRNA, GBcontig24459 |
| 861 | 4 | 0.0042 | 0.143 | Ribulose-5-phosphate-3-epimerase mRNA |
Contigs in boldface type correspond to mitochondrial loci. NS, nonsignificant (E-value > 10−3) similarity.
Increasing the SNP calling stringency from 92 to 95 had a drastic effect on SNP discovery, reducing the total number of predicted SNPs (9731 vs. 5207, P < 0.0001) and our estimates of SNPs/site (0.0063 vs. 0.0034, P < 0.0001) by almost half. However, this had only a limited impact on the distribution of SNP frequency differences (File S2). Similarly, decreasing the coverage stringency by 10× significantly increased the number of predicted SNPs (P < 0.0001), but this difference also seems to have had little impact on our divergence estimates.
Variation in selective constraints across the accessory gland transcriptome
Across the transcriptome, we found an average of 1.7 nonsynonymous SNPs per 1000 nonsynonymous site SNPs and 5 synonymous SNPs per 1000 synonymous sites. The estimates of pN/pS range from 0 (only synonymous polymorphic sites present) to infinite (only nonsynonymous polymorphic sites present). For the subset of contigs showing at least one synonymous SNP, the overall pN/pS obtained by resampling contigs is 0.105 (95% CI: 0.076–0.135), a value similar to the one obtained for the subset of highly divergent genes (those with ≥ 0.98) (permutation test P = 0.51). However, the inferred proportion of highly divergent contigs showing only nonsynomymous variation is higher for the subset of highly divergent contigs than for the rest of the transcriptome (permutation test P = 0.046).
Candidate gene approach
We have previously identified Gryllus SFPs by proteomic analysis (Andrés et al. 2006; J. Andrés, S. Bogdanowicz, and R. Harrison, unpublished data). Therefore, we were able to compare the average allele frequency differences () between SFPs (n= 28) and the between “housekeeping” genes (n = 1621) that met our functional annotation, quality, and coverage criteria (n= 1621) (see Materials and Methods). Although some of the SFP genes showed fixed differences between the two species, on average, these genes did not seem to show larger shifts in their average allele frequencies (SFPs = 0.336, housekeeping = 0.416, P = 0.069). Similar results were obtain by comparing either SFP encoding genes to the subset of “housekeeping” genes with a predicted signal peptide (n = 231, SFPs = 0.336, housekeeping_signal = 0.402, P = 0.158) or annotated contigs that lack a predicted signal peptide (n = 1130) with those that have it (n = 491, signal = 0.381, no signal = 0.386, P = 0.754). Table 2 summarizes the values of D and the numbers of fixed SNPs for SFP genes that we have characterized. Only two of these genes have > 0.95.
Mean interspecific differentiation index () for the subset of identified genes encoding seminal fluid proteins
| SFP-gene | Functional homology | Nt | Nfix | |
|---|---|---|---|---|
| AG-0202F | Lectin similar | 0.965 | 2 | 2 |
| AG-0383F | Chaperonin | 0.772 | 4 | 3 |
| AG-0501F | Proteasome | 0.689 | 6 | 4 |
| AG-0509F | Proteasome | 0.528 | 1 | 0 |
| AG-0005F | Unknown | 0.447 | 23 | 1 |
| AG-0010F | Serine protease | 0.360 | 4 | 1 |
| AG-0085F | Unknown | 0.277 | 4 | 0 |
| AG-0334P | Unknown | 0.264 | 16 | 3 |
| AG-0115F | Unknown | 0.237 | 48 | 0 |
| AG-0076F | Unknown | 0.214 | 28 | 0 |
| AG-0159F | Serine protease | 0.210 | 32 | 0 |
| AG-0312F | Unknown | 0.203 | 12 | 0 |
| AG-0090F | Unknown | 0.199 | 14 | 0 |
| AG-0517F | Lectin similar | 0.188 | 35 | 0 |
| AG-0001F | Unknown | 0.177 | 9 | 0 |
| AG-0188F | Carboxipeptidase | 0.167 | 1 | 0 |
| AG-0254F | Chemiosensory protein | 0.164 | 3 | 0 |
| AG-0273F | Chymotrypsin | 0.159 | 12 | 0 |
| AG-0315F | Unknown | 0.157 | 40 | 0 |
| AG-0025F | Serine protease | 0.153 | 5 | 0 |
| AG-0055F | Unknown | 0.151 | 13 | 0 |
| AG-0056F | Unknown | 0.137 | 1 | 0 |
| AG-0099F | Unknown | 0.119 | 47 | 0 |
| AG-0042F | Unknown | 0.112 | 8 | 0 |
| AG-0313F | Unknown | 0.107 | 16 | 0 |
| AG-0197P | Unknown | 0.100 | 37 | 0 |
| AG-0020F | Unknown | 0.097 | 2 | 0 |
Nt = total number of SNPs in each gene. Nfix = number of SNPs showing allele frequency differences (D) > 0.9 between G. firmus and G. pennsylvanicus.
| SFP-gene | Functional homology | Nt | Nfix | |
|---|---|---|---|---|
| AG-0202F | Lectin similar | 0.965 | 2 | 2 |
| AG-0383F | Chaperonin | 0.772 | 4 | 3 |
| AG-0501F | Proteasome | 0.689 | 6 | 4 |
| AG-0509F | Proteasome | 0.528 | 1 | 0 |
| AG-0005F | Unknown | 0.447 | 23 | 1 |
| AG-0010F | Serine protease | 0.360 | 4 | 1 |
| AG-0085F | Unknown | 0.277 | 4 | 0 |
| AG-0334P | Unknown | 0.264 | 16 | 3 |
| AG-0115F | Unknown | 0.237 | 48 | 0 |
| AG-0076F | Unknown | 0.214 | 28 | 0 |
| AG-0159F | Serine protease | 0.210 | 32 | 0 |
| AG-0312F | Unknown | 0.203 | 12 | 0 |
| AG-0090F | Unknown | 0.199 | 14 | 0 |
| AG-0517F | Lectin similar | 0.188 | 35 | 0 |
| AG-0001F | Unknown | 0.177 | 9 | 0 |
| AG-0188F | Carboxipeptidase | 0.167 | 1 | 0 |
| AG-0254F | Chemiosensory protein | 0.164 | 3 | 0 |
| AG-0273F | Chymotrypsin | 0.159 | 12 | 0 |
| AG-0315F | Unknown | 0.157 | 40 | 0 |
| AG-0025F | Serine protease | 0.153 | 5 | 0 |
| AG-0055F | Unknown | 0.151 | 13 | 0 |
| AG-0056F | Unknown | 0.137 | 1 | 0 |
| AG-0099F | Unknown | 0.119 | 47 | 0 |
| AG-0042F | Unknown | 0.112 | 8 | 0 |
| AG-0313F | Unknown | 0.107 | 16 | 0 |
| AG-0197P | Unknown | 0.100 | 37 | 0 |
| AG-0020F | Unknown | 0.097 | 2 | 0 |
Nt = total number of SNPs in each gene. Nfix = number of SNPs showing allele frequency differences (D) > 0.9 between G. firmus and G. pennsylvanicus.
Intraspecific polymorphism
We observed 5996 and 5085 polymorphic nucleotides in G. firmus and G. pennsylvanicus, respectively. Polymorphism levels are similar between the two species (πGf = 1.38 × 10⁻⁵ πGp = 1.29 × 10⁻⁵, P = 0.761). Indeed, estimates of π for many of the contigs are roughly equal in both species (ρ = 0.48, P < 0.0001). There is considerable variance in polymorphism and divergence across contigs. Figure 3 shows for each species the negative correlation between interspecific divergence estimated as and intraspecific polymorphism (Gf: ρ = −0.23, P < 0.0001; Gp: ρ = −0.34, P < 0.0001). Several contigs show high levels of divergence and low levels of intraspecific polymorphism, a pattern consistent with recent selective sweeps.
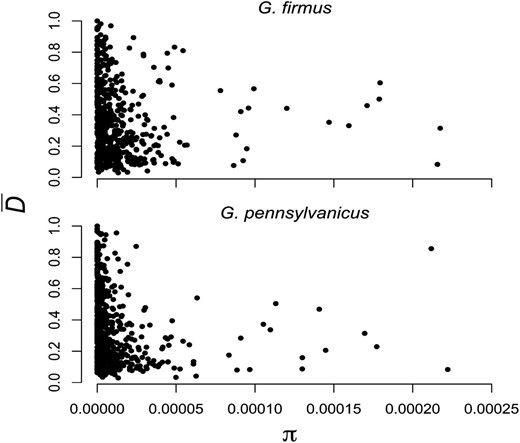
Correlation between polymorphism within species (π) and divergence between G. firmus and G. pennsylvanicus.
SNP validation and gene genealogies
Thirty-two individual crickets (16 each from the two allopatric populations) were Sanger-sequenced for a subset of 10 highly differentiated contigs containing a total of 60 putative SNPs (see Materials and Methods). Of these, 6 SNPs could not be typed because of primer design constraints. All of the remaining predicted SNPs (n = 54) were validated by the amplification and sequencing of PCR products of individual crickets. Allele frequency estimates based on the pooled samples (Illumina tagging) were very similar to those obtained from individual sequencing of the new panel of crickets (Table 3, File S3). Accordingly, the gene genealogies (Figure 4) for these contigs show that observed variation is indeed partitioned among populations (i.e., species). However, contigs 5368, 6023, and 1774 each have one haplotype shared between the two species (Figure 4). Overall, NJ trees for the targeted contigs reveal greater differences than do similar trees for AG-0005F and AG-0334P, the SFP genes that, from previous studies, were found to be the most differentiated between the cricket species.
Comparison of the allele frequency differences, estimated as , between G. firmus and G. pennsylvanicus for a subset of highly differentiated contigs using pooled Illumina tags and individual Sanger sequencing
| Illumina (Nind = 30) | Sanger (Nind = 32) | ||||
|---|---|---|---|---|---|
| Contig | NSNPs | NSNPs | pN/pS | ||
| 5214 | 7 | 0.865 | 5 | 0.829 | ∞ |
| 5368 | 5 | 1 | 5 | 0.969 | 0.411 |
| 1002 | 9 | 0.855 | 6 | 0.911 | 0.141 |
| 6023 | 7 | 0.867 | 7 | 0.848 | — |
| 142 | 9 | 0.897 | 7 | 0.853 | 0.237 |
| 7153 | 9 | 0.899 | 8 | 0.823 | 0.096 |
| 14741 | 3 | 1 | 3 | 0.979 | 0.570 |
| 4655 | 3 | 1 | 3 | 0.990 | 0.148 |
| 1774 | 5 | 1 | 5 | 0.969 | 0 |
| 1231 | 5 | 0.816 | 4 | 0.969 | 0.917 |
Also see Materials and Methods. For each experiment, we independently sampled the same two allopatric populations (Guilford, CT, and Ithaca, NY, respectively). Nind = total number of individuals sequenced in each experiment. NSNPs = number of SNPs typed in each contig.
| Illumina (Nind = 30) | Sanger (Nind = 32) | ||||
|---|---|---|---|---|---|
| Contig | NSNPs | NSNPs | pN/pS | ||
| 5214 | 7 | 0.865 | 5 | 0.829 | ∞ |
| 5368 | 5 | 1 | 5 | 0.969 | 0.411 |
| 1002 | 9 | 0.855 | 6 | 0.911 | 0.141 |
| 6023 | 7 | 0.867 | 7 | 0.848 | — |
| 142 | 9 | 0.897 | 7 | 0.853 | 0.237 |
| 7153 | 9 | 0.899 | 8 | 0.823 | 0.096 |
| 14741 | 3 | 1 | 3 | 0.979 | 0.570 |
| 4655 | 3 | 1 | 3 | 0.990 | 0.148 |
| 1774 | 5 | 1 | 5 | 0.969 | 0 |
| 1231 | 5 | 0.816 | 4 | 0.969 | 0.917 |
Also see Materials and Methods. For each experiment, we independently sampled the same two allopatric populations (Guilford, CT, and Ithaca, NY, respectively). Nind = total number of individuals sequenced in each experiment. NSNPs = number of SNPs typed in each contig.
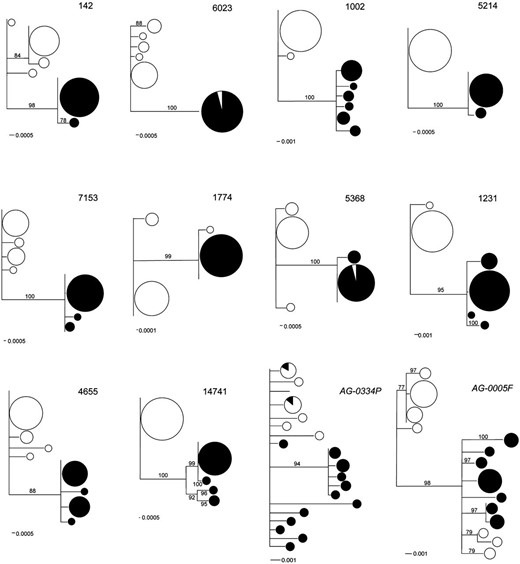
DNA gene genealogies for a subset of 10 highly differentiated contigs and two seminal fluid protein genes (AG-0005F and AG-0334P). G. firmus is represented by open circles and G. pennsylvanicus by solid circles. Size of symbols is proportional to the frequency of the haplotype. Numbers on the branches represent bootstrap support values >75%.
Discussion
Genetic mosaics, transcriptome scans, and patterns of differentiation
During the process of speciation, the degree of differentiation between diverging lineages will vary across the genome, which is therefore a mosaic of different evolutionary histories (Harrison 1991; Rieseberg et al. 1999; Wu 2001; Turner et al. 2005; Nosil et al. 2009). During the early stages of differentiation in allopatry, chromosome regions harboring genes that contribute to local adaptation will diverge most rapidly. In secondary contact (or in cases of divergence with gene flow), chromosome regions that contain genes that contribute to reproductive isolation will have reduced levels of gene flow. These insights provide the foundation for a growing list of population genomics studies that aim to identify genomic regions contributing to reproductive isolation (e.g., Nosil et al. 2008; Manel et al. 2009; Schwarz et al. 2009; Apple et al. 2010; Galindo et al. 2010; Michel et al. 2010; Renaut et al. 2010; Fan et al. 2012; Nadeau et al. 2012).
Next-generation sequencing has made it possible to effectively scan the genome for specific genes (or gene regions) that exhibit low gene flow (i.e., fixed differences or major shifts in allele frequencies) between recently diverged taxa. We chose to scan the accessory gland transcriptome of hybridizing field crickets to enable direct comparisons of differentiation for genes known to encode SFPs with differentiation at a much larger set of genes expressed in the same tissue. It has been hypothesized that, in crickets, genes encoding SFPs are likely to contribute to postmating reproductive isolation between closely related species, and we have previously shown (using comparisons of dN and dS) that some SFPs exhibit rapid evolution and evidence of positive selection (Andrés et al. 2006). Results of our transcriptome scan suggest that SNPs fixed between species constitute ∼10% of all identified SNPs and that many contigs contain multiple fixed SNPs. These contigs are as differentiated (or more differentiated) than are AG-0005F and AG-0334P, the two highly divergent cricket SFP-encoding genes characterized previously. In the process of scanning the transcriptome we have revealed evidence of highly divergent SNPs between the two populations in four other SFP genes (some of these with multiple fixed or nearly fixed SNPs; see Table 2). However, on average, SFPs did not seem to have higher rates of divergence than other genes expressed in the accessory gland, a result that may reflect the heterogeneity in evolutionary rates previously observed in SFPs of field crickets (Andrés et al. 2006). Over a decade of research on the evolution of SFPs has emphasized that a subset of SFP genes are among the most rapidly evolving genes and that these divergent genes/proteins contribute to reproductive isolation. However, it must be recognized that relatively few SFP genes accumulate fixed differences and that a significant fraction of SFP genes show evidence of evolutionary constraint (Andrés et al. 2006; Findlay et al. 2008; Dean et al. 2009; Walters and Harrison 2011). Thus, an overall increase of evolutionary rate in SFP genes should not necessarily be expected.
Most of the divergent contigs have no identified homologs or known function, so it is not yet possible to speculate about the ultimate causes or consequences of observed divergence. However, the estimated proportion of loci showing pN/pS ratios consistent with divergent (directional) selection is significantly higher for this subset of contigs than for the rest of the transcriptome, supporting the hypothesis that many of the highly divergent loci are likely to be involved in local adaptation and perhaps in reproductive isolation. Consistently, we found a negative association between intraspecific variation and divergence between species, a pattern similar to that found in Anopheles mosquitoes, where SNPs with FST > 0.6 have significantly reduced polymorphism (Neafsey et al. 2010). This negative correlation is a pattern that might be expected if the accessory gland transcriptome differences between G. firmus and G. pennsylvanicus have mostly been driven by directional selection. However, this correlation should be interpreted with caution. The two species of field crickets exhibit large amounts of shared ancestral polymorphism (Broughton and Harrison 2003). Therefore, the effects of variation in the rate of recombination across the genome might explain the negative correlation if there is a reduction in Ne in low-recombining regions due to background selection.
Does the discovery of substantial differentiation between G. firmus and G. pennsylvanicus imply that our previous assessment of “recent” divergence (estimated at ∼200,000 years) is wrong? The observed distribution of allele frequency differences is distinctly bimodal, and many of the highly differentiated SNPs represent nearly fixed differences between these two species (Figure 1). Unfortunately, it is difficult to compare our results with those from other recent genome scans of strains, races, or closely related species. Most of these studies report FST values and identify FST outliers, but do not provide information on fixed (or nearly fixed) SNPs. There are a few exceptions. Host races of the budmoth show no markers completely fixed for alternative AFLP genotypes (Emelianov et al. 2004). In contrast, genes with fixed amino acid substitutions between forms occur throughout the genome in comparisons of the M and S forms of Anopheles gambiae (Lawniczak et al. 2010). Because we have sampled only single populations of the two cricket species, it is likely that a fraction of the highly divergent SNPs found in our study represent frequency differences between populations rather than frequency differences between species and that our divergence estimate is therefore elevated. However, it is clear that the hybridizing field crickets are not as recently diverged as many insect host races (e.g., budmoth, apple maggot, pea aphid), many of which have been cited as exemplars of ecological speciation and/or sympatric speciation (Emelianov et al. 2004; Via and West 2008; Michel et al. 2010). The observed pattern of trancriptome divergence in crickets is reminiscent of the summary figures showing divergence for allozyme loci in subspecies or semispecies in the Drosophila willistoni group (Ayala et al. 1974; Ayala 1975; Avise 1976) and in Lepomis sunfish (Avise 1994). Both the D. willistoni group and the genus Lepomis provided early model systems for studying genetic differentiation during the process of geographic speciation. Although conspecific populations exhibited allele frequency differences at some loci, only in recognized subspecies or semispecies was there a small proportion of loci with fixed or nearly fixed differences. These loci, it was suggested, were those important for local adaptation (Ayala 1975; Avise 1976). The proportion of loci with fixed differences increased dramatically (to >30% of all loci) when sibling species were compared. Allozyme studies reveal differences in the frequencies of charge-changing amino acid substitutions, a presumably small subset of the differences that we can identify in transcriptome scans. Consistent with this interpretation is the earlier observation that there are no allozyme loci that exhibit fixed differences in allele frequency between G. firmus and G. pennsylvanicus. Although by no means conclusive, these observations are consistent with recent divergence of the two cricket species, at least relative to other model systems for geographic speciation.
Ascertainment bias, mapping bias, and sampling error
Our use of pooled DNA samples for SNP discovery and transcriptome wide scans of allele frequencies could raise questions about ascertainment bias, mapping bias, and sampling error. Because of the relatively high sequencing error associated with high-throughput sequencing, SNP detection has focused on minimizing the false-positive rate by considering only SNPs occurring more than a predefined number of times (e.g., Galindo et al. 2010; Renaut et al. 2010), a SNP-calling criterion that generates a systematic bias by excluding many rare alleles from the data. This, in turn, may lead to biased estimates of several population genetic parameters, potentially compromising the ability to identify outlier loci (see Helyar et al. 2011). Mapping bias can arise from the assembly of tags from one lineage to a reference transcriptome from a different lineage. This bias is likely to be more severe in highly differentiated regions of the genome and in comparisons involving distantly related lineages. Sampling error in pooled samples has two different sources: first, the number of individuals included in the pool and, second, the unequal representation of individual alleles. This second error source arises because of variation in RNA amounts among individuals contributing to the pool and because some alleles are sequenced repeatedly whereas other alleles may not be sequenced at all.
In this article we have attempted to minimize the concerns raised above. First, to reduce ascertainment bias and sampling error, we have identified putative SNPs using a relatively large panel of alleles (2n = 60), and we have considered only those SNPs with high coverage (≥20×). Two recent studies suggest that variation associated with heterogeneity in the probe material (RNA) is not a serious problem and can be kept small by combining relatively large pools (2n >100) with relatively deep (10–60×) sequence coverage (Futschik and Schlotterer 2010; Galindo et al. 2010). Our results strongly suggest that relatively modest coverage (20×) and smaller pools still result in reliable identification of SNPs. In fact, our validation experiment verified 90% of the predicted SNPs, a fraction similar to results from other organisms without a reference genome (e.g., Williams et al. 2010; You et al. 2011). Likewise, we found a strong correspondence between the predicted allele frequencies based on the pooled samples and those obtained from Sanger sequencing of a different sample of crickets. This result is similar to those reported in other SNP discovery experiments with comparable coverage (Van Tassell et al. 2008; Wiedmann et al. 2008).
Second, instead of defining candidate loci by generating an expected neutral distribution of differentiation values and identifying outlier loci (see Butlin et al. 2008), we have defined candidate loci as those that show a high proportion of fixed (or almost) fixed SNPs between species. This approach is similar to that of studies in which candidate genes are defined as those that reveal closely related taxa to be reciprocally monophyletic or exclusive groups (e.g., Dopman et al. 2005; Andrés et al. 2008). By using D and we avoid any potential biases associated with the estimation of “neutral” distributions.
However, it is also important to recognize that (the average divergence across a contig) may not be a reliable indicator of functional differences. Some contigs have several fixed differences, but also many sites that are segregating within species-specific allelic classes. In these cases, can be low, but haplotypes in the two species may be functionally distinct. Both AG-0005F and AG-0334P might fall into this category. In addition, some fixed differences detected by traditional Sanger sequencing do not show up as fixed SNPs in the Illumina reads because the relevant sites fall below our thresholds for coverage or sequence quality. Thus the numbers of fixed SNPs for AG-0005F and AG-0334P reported in Table 3 are less than the numbers that we know to be present from earlier Sanger sequencing (Andrés et al. 2008). Moreover, the significance of fixed SNPs is still uncertain because fixation may be a consequence of linkage to a different causative locus. Follow-up studies and a detailed linkage map are therefore critical to establishing the possible link between functional divergence and elevated values.
Finally, mapping bias does not seem to be important in our study. Although G. pennsylvanicus shows lower levels of intraspecific polymorphisms as expected if there were reduced ability to map G. pennsylvanicus sequences onto a G. firmus reference, this result is also consistent with the θ values previously estimated using nuclear introns (Broughton and Harrison 2003). Moreover, the total number of G. firmus reads mapped onto the reference is only 4% higher than the number of mapped G. pennsylvanicus tags, suggesting only a small bias, if any.
Importance of fixed SNPs
In the study of speciation, a focus on recently diverged taxa is important. This partly explains the current attention devoted to recently diverged (still diverging) sympatric populations or ecotypes, in which rapid adaptive divergence occurs in the face of gene flow. In this article, we have examined genomic divergence between a pair of species that are the result of a more “conventional” model of allopatric divergence, a model that may represent a majority of speciation events across all animal taxa. As discussed above, the discovery of many fixed SNPs does not necessarily imply “ancient” divergence, and the hybrid zone between G. firmus and G. pennsylvanicus remains an important model to study the origins of reproductive isolation. Hybrid zones that result from allopatric divergence and secondary contact (a majority of hybrid zone systems; see Barton and Hewitt 1985) provide unique insights into the mechanistic and genetic basis of reproductive isolation. These zones represent many generations of hybridization and recombination between differentiated populations and therefore patterns of introgression across hybrid zones and patterns of linkage disequilibrium within hybrid zones direct our attention to genome regions that are important for reproductive isolation or regions that have recently experienced selection. The fixed SNPs that we have discovered will allow careful dissection of patterns of introgression and linkage disequilibrium within the field cricket hybrid zone (see Teeter et al. 2008, 2010; Gompert and Buerkle 2009; Payseur 2010). This will bring us a step closer to our ultimate goal of identifying the differences in genotypes or phenotypes that are more likely associated with the origin of reproductive barriers and less likely to have accumulated subsequent to initial divergence.
Acknowledgments
We thank members of the Harrison lab for comments on an earlier version of this article. An anonymous reviewer and David Begun provided important feedback that resulted in greater clarity and improved analyses. This work was supported by National Science Foundation grant DEB-0639904 to R.G.H.
Literature Cited
Footnotes
Communicating editor: D. Begun
Author notes
Supporting information is available online at http://www.genetics.org/lookup/suppl/doi:10.1534/genetics.112.142299/-/DC1.
