


Abstract
Inorganic arsenic (As) is a toxic xenobiotic and carcinogen associated with severe health conditions. The urban population from the Atacama Desert in northern Chile was exposed to extremely high As levels (up to 600 µg/l) in drinking water between 1958 and 1971, leading to increased incidence of urinary bladder cancer (BC), skin cancer, kidney cancer, and coronary thrombosis decades later. Besides, the Andean Native-American ancestors of the Atacama population were previously exposed for millennia to elevated As levels in water (∼120 µg/l) for at least 5,000 years, suggesting adaptation to this selective pressure. Here, we performed two genome-wide selection tests—PBSn1 and an ancestry-enrichment test—in an admixed population from Atacama, to identify adaptation signatures to As exposure acquired before and after admixture with Europeans, respectively. The top second variant selected by PBSn1 was associated with LCE4A-C1orf68, a gene that may be involved in the immune barrier of the epithelium during BC. We performed association tests between the top PBSn1 hits and BC occurrence in our population. The strongest association (P = 0.012) was achieved by the LCE4A-C1orf68 variant. The ancestry-enrichment test detected highly significant signals (P = 1.3 × 10⁻⁹) mapping MAK16, a gene with important roles in ribosome biogenesis during the G1 phase of the cell cycle. Our results contribute to a better understanding of the genetic factors involved in adaptation to the pathophysiological consequences of As exposure.
Introduction
Inorganic arsenic (As) is a toxic xenobiotic and carcinogen associated with the occurrence of severe health conditions, including increased mortality in early life, cardiovascular and liver toxicity, and cancer (Schlebusch et al. 2015). One of the cancers with the higher risk due to chronic As exposure is urinary bladder cancer (BC) (Chen et al. 2005; Chung et al. 2013; Saint-Jacques et al. 2018). Several factors seem to contribute to As-induced carcinogenesis, including epigenetic alterations, impairment of DNA-repair and oxidative stress (Huang et al. 2004; Chung et al. 2013; Sinha et al. 2013). Also, As induces cell-cycle arrest by suppressing cell-cycle checkpoint proteins (Flora 2011). Although some epigenetic factors (i.e., methylation of genes) have been significantly associated with As-induced BC (Chen et al. 2007; Yang et al. 2014), the contribution of genetic polymorphisms to this condition is less understood. One study found that a locus in the As-detoxification pathway enzyme GSTM1 is significantly associated with an increased BC risk in an As-exposed cohort from Taiwan. This observation suggests individual genetic susceptibility to BC related to As exposure (Chung et al. 2013).
In nature, As is produced by volcanic activity and is usually deposited in nearby rivers and lakes. In Andean regions, some rivers show high As levels in water. One of them is the Loa River, the only water supplier of the Antofagasta region of northern Chile, located in the hyperarid Atacama Desert. The Loa and its tributaries have As concentrations of 100–1,000 µg/l (Romero et al. 2003). Several native Andean populations have lived across the Loa basin for at least 12,000 years (Latorre et al. 2013; Falabella et al. 2017). This suggests an early human consumption of high As levels in water. In fact, 5,000–7,000-year-old mummies showing high As levels in their bodies have been found in the Atacama Desert (Byrne et al. 2010; Yáñez et al. 2015). Arguably, such populations adapted to this selective pressure, leaving genetic adaptation signatures in their genomes and in the genomes of their modern admixed descendants. Indeed, adaptive genetic loci in the key As-metabolizing enzyme AS3MT were found in populations with high Native-American ancestry from northern Chile (Apata et al. 2017) and Argentina (Eichstaedt et al. 2015; Schlebusch et al. 2015) historically exposed to As. However, it is unknown which are the organ and tissue systems over which genes such as AS3MT are acting to increase evolutionary fitness. In 1958, As concentrations in drinking water in Antofagasta—the largest city of the Atacama Desert—increased from 117 to 600 µg/l after the incorporation of two As-rich rivers as water sources. Thereafter, this population was exposed to significantly elevated As levels until 1971, when the first water treatment plant began its operations. Afterward, the installation of cleaner water sources led to As concentrations <10 µg/l during the last decade (Smith et al. 2018) (fig. 1). As a consequence, BC incidence and BC-specific mortality rates increased dramatically in this population since the 1970s and have remained high during the last years (Fernandez et al. 2012). In fact, BC incidence in this region was 4.1 times higher among men (20.6 vs. 5.0/100,000) and 4.3 times higher among women (8.1 vs. 1.9/100,000) than that of a comparable region within Chile during 2008–2010 (Espinoza et al. 2017; Galaz et al. 2017). However, these differences are significantly smaller than those observed in other populations with similar levels of As exposure (>100 µg/l), such as Taiwan. Here, BC incidence in affected regions was 7.9 times higher among men (26.06 vs. 3.31/100,000) and 18.0 times higher among women (21.10 vs. 1.17/100,000) when compared with that of the rest of the country in 1981–1985 (Chiang et al. 1993). There are no further studies comparing BC incidence rates between exposed and nonexposed populations, in part because few populations worldwide have been exposed to high As levels in water (Christoforidou et al. 2013).
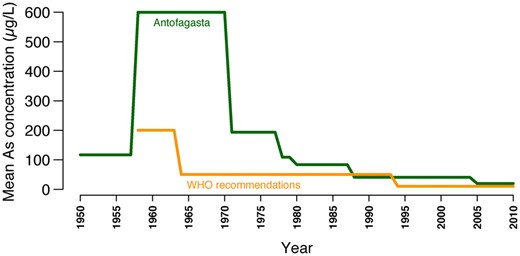
—Mean As concentrations in water in Antofagasta between 1950 and 2010. These measurements were compared with the WHO recommendations for As concentration in drinking water. Adapted from Fernandez et al. (2012), Elsevier, @ Copyright 2012.
BC incidence in South America is the lowest in males and the second lowest in females when compared across ten world regions (supplementary fig. 1, Supplementary Material online) (Ferlay and Ervik 2018). Because BC heritability is estimated to be ∼31% (Lichtenstein et al. 2000) and most South American countries have high Native-American genetic ancestry proportions, Native-American genetic variants may in part underlie this lower BC incidence.
In the present study, we searched for Native-American genetic signatures of adaptation to As exposure in admixed people from Atacama, by performing three approaches. First, we implemented the PBSn1 test of positive selection. PBSn1 is a normalized version of Population Branch Statistic (PBS) (Crawford et al. 2017), which has strong power to detect recent selective sweeps acting mostly on standing variation (Yi et al. 2010). We used this test to detect adaptive loci in local people acquired between the split time of their ancestors from Mesoamericans ∼12,000 years ago (ya) (Harris et al. 2018) and before admixture with Europeans. Second, we performed associations between putative loci selected by PBSn1 and the occurrence of BC in the Atacama cohort. This approach is suitable to elucidate function when sample sizes are small (Ilardo et al. 2018) and has proven successful in identifying loci underlying important physiological adaptations in Tibetans (Yi et al. 2010), Inuit (Fumagalli et al. 2015), and “Sea Nomads” of Southeast Asia (Ilardo et al. 2018). Third, we implemented an ancestry-enrichment test (Bryc et al. 2010; Bhatia et al. 2014), which captures a different kind of positive selection; namely, admixture-facilitated adaptation acting through gene flow (Jeong et al. 2014). We used this test to detect adaptation in local people acquired after admixture with Europeans.
By properly correcting for admixture, PBSn1 identified putative selected variants acquired by the Native-American ancestors of the Atacama population. The top second locus was associated with LCE4A-C1orf68, a gene involved in the barrier function of the epithelium that may play a role in immune defense during BC. The strongest association between loci selected by PBSn1 and BC was achieved by the aforementioned LCE4A-C1orf68 variant (P = 0.012). The ancestry-enrichment test detected several significant single-nucleotide polymorphisms (SNPs) in the whole cohort. Among them, some were also significantly enriched for Native-American ancestry in controls but not in cases, suggesting that postadmixture adaptation to As had an impact on the urinary bladder. Among those, the most significant variants (P = 1.3 × 10⁻⁹) mapped the genes MAK16 and FUT10, which are in high linkage disequilibrium (LD) with TTI2. MAK16 encodes a ribosomal protein with an important role in ribosome biogenesis during the cell cycle (Wickner 1988; Kater et al. 2017), whereas FUT10 and TTI2 are also related to the cell cycle.
In summary, our results suggest that different evolutionary mechanisms may be involved in adaptation to As in admixed populations with Native-American ancestry historically exposed to high As levels.
Materials and Methods
Study Subjects
Subjects were invited to participate after signing an informed consent. Cases were recruited among patients treated for primary BC between 2013 and 2015 at the state-owned Hospital Regional de Antofagasta, which is the regional referral center for all major health problems occurring in northern Chile. The study was approved by the Ethics Committee of the Faculty of Medicine from Clínica Alemana Universidad del Desarrollo in Santiago. Based on this approval, it was subsequently authorized for execution by local authorities of the Hospital Regional de Antofagasta. Control subjects were individuals with no prior history of genitourinary malignancies. They were enrolled at the outpatient center of the same hospital and matched to the case patients by age (∼5 years) and sex. Epidemiologic and clinical data (demographics, smoking history, medical history, and occupational risk factors associated with exposure to aromatic amines [ORFs]) were collected during an in-person interview by trained nurses using a validated questionnaire. A blood sample was obtained at the same time. Smoking status was assigned according to current WHO-classification, with never smokers defined as individuals who had smoked none or <100 cigarettes during lifetime, and ever smokers as individuals who had smoked ≥100 cigarettes during lifetime.
Statistical significance between cases and controls of the following host characteristics was measured with the χ2 test of independence: sex, ORFs, mining workers, and smoking status. Differences in age between cases and controls were evaluated using a two-tailed t-test. P < 0.05 was considered significant. Supplementary table 1, Supplementary Material online, shows statistical results for these comparisons. Mining workers and the remaining occupational risk factors considered together were considered as two separate categories.
Sample Collection and Genotyping
Genomic DNA was purified from whole blood samples with the Blood Genomic DNA kit (Axygen, Corning, NY), and quantified using the Qubit dsDNA HS Assay (Life Technologies, Carlsbad, CA). All DNA samples analyzed passed the required quality controls for concentration, purity, and integrity. Genotyping was performed using the Affymetrix Human SNP 6.0 array (Affymetrix, Santa Clara, CA). Fluorescence was acquired on an Affymetrix Array Scanner 3000 7G, and quality control checks for each experiment were performed using the Affymetrix GeneChip Command Console 4.1.2 (AGCC) software. All identified variants were subjected to an additional gender-based control using the Genotyping ConsoleTM 4.0 (GTC) software, to verify the match between informed and genotyped gender.
APT version 1.15.1 and GCO2PLINK softwares were used to generate files with the entire genotyping and phenotype information and data were further analyzed with PLINK. SNPs that failed the filters for individual calling rate (mind <90%), marker calling rate (geno <90%), minor allele frequency (MAF ≤ 0.01), and/or Hardy–Weinberg equilibrium (>0.00001) were excluded from the analyses. All individuals were unrelated. After application of all filters, the initial number of 934,967 SNPs was reduced to 772,277.
Local and Global Ancestry Inference
For the estimation of local and global ancestry in the Atacama cohort, we used LAMP-LD, which requires samples from the parental populations (Baran et al. 2012). We used reference panels for Native-American (n = 88), European (n = 911), and African (n = 229) populations (see supplementary table 3, Supplementary Material online, for details of the populations used in this study). Using an in-house Python script, the mean local ancestry was calculated for every SNP.
Association between Genetic Variants and BC
PBSn1 Test of Positive Selection
Here, and fATA represent the allele frequency at a locus in ATA before and after admixture, respectively. fSPN represent the allele frequency at the same locus in Spaniards from POPRES (supplementary table 3, Supplementary Material online), a proxy population for the 16th century Spanish population that admixed with Native Americans. α represents the proportion of ancestry derived from Spaniards at that locus and was inferred with LAMP-LD as explained before.
Estimation of the Distribution of Maximum PBSn1 Values
To estimate the distribution of the maximum value of a sample of PBSn1, we generated a random sample of 1,000 values from the full set of 402,287 valid PBSn1 values. From this sample, we estimated the maximum value and the mean value. We repeated this 1,000 times to obtain 1,000 mean values and 1,000 maximum values. The estimates of the distribution of each of the 1,000 samples are shown in supplementary figure 2, Supplementary Material online. We fitted a generalized extreme value distribution to the maximums using the R package extRemes. With this cumulative distribution, we obtained that the probability of observing a value ≥0.34 (the value of the tenth highest score on PBSn1) is 0.014. The probability of observing a value of PBSn1 ≥ 0.45 (the highest PBSn1 value) is 0.0034. Supplementary figure 3, Supplementary Material online, shows the estimate of the distribution.
Estimation of Background Selection
We obtained background selection (BGS) coefficients (B) for each variant rate (McVicker et al. 2009). B indicates a reduction of the effective population size (Ne) at neutral sites as a function of their recombination distance from conserved and exomic loci, the strength of purifying selection at these loci, and the deleterious mutation rate (McVicker et al. 2009; Torres et al. 2018). Positions for B were lifted over from hg18 to hg19 using the UCSC liftOver tool.
Overlap between Loci Selected by PBSn1 and Low BC Association P Values
One thousand random samples of P values of size n = 100 were generated. P values from the samples of 100 were matched to have “similar” characteristics in recombination rate and derive allele frequency from the SNPs with the highest 100th scores on PBSn1. We defined “similar” as the intervals defined by 5% of values above and below the observed ones in recombination rate and derived allele frequency. The randomization test described in the Results section was performed using R scripts. The means of BC association P values from the random and PBSn1 selected loci were compared using a Welch two sample one-tailed t-test. A P value <0.05 was considered significant.
Deviations from Mean Genome-Wide Local Ancestry
Variant Annotations
All variant annotations used in this study correspond to the GRCh37 (hg19) assembly. They include the Sequence Ontology (SO) consequence type, Gencode biotypes and Ensembl feature types and were retrieved using the web tool VEP from Ensembl (McLaren et al. 2016). Each variant was classified into one of the following SO consequence types: intron, intron/noncoding transcript, noncoding transcript exon/noncoding transcript, missense, synonymous, 3 prime UTR, 5 prime UTR and intron/NMD transcript, intergenic, regulatory region, and downstream-gene and upstream-gene variants. Upstream and downstream variants were defined as those variants located 10-kb upstream or downstream of the gene, respectively. Intergenic variants were defined as those located >10-kb upstream or downstream of the closest gene.
Results
Detection of Preadmixture Native-American Adaptation Signals to As Exposure
PBSn1 captures SNPs where allele frequencies are especially differentiated in a focal population when compared with two other populations (Yi et al. 2010; Crawford et al. 2017). We used this test to detect highly differentiated loci in the Andean ancestors of the admixed Atacama people (the focal population). We chose a mix of native individuals from Mesoamerican populations (Bigham et al. 2010) as a second related population in order to capture differentiated adaptation signatures in the Atacama people that occurred after their divergence from Mesoamericans ∼12,000 ya (Harris et al. 2018). We chose a mix of native individuals from East Asia as the third population, which represents a proxy of the first humans who migrated from northeast Siberia to the American continent through Beringia at least ∼23,000 ya (Nielsen et al. 2007). The allele frequencies in the admixed Atacama people were corrected for admixture with Europeans similarly as described previously (Huerta-Sánchez et al. 2013), using modern Spaniards as a proxy for the European ancestral population of the Atacama people. This pseudounadmixed population is called “Atacamas” from now on. Genome-wide genetic differentiation was very low between Atacamas and Mesoamericans (FST = 0.026), higher between Mesoamericans and East Asians (FST = 0.094) and the highest between Atacamas and East Asians (FST = 0.111), indicating that FST-based tests like PBSn1 have good power to capture positive selection signals (Crawford et al. 2017). The top ten SNPs with the highest PBSn1 scores are shown in table 1. We refer hereafter to these variants as “selected.” Figure 2A shows the PBSn1 scores across the genome, highlighting genes associated with selected variants. The strongest signals are mentioned in the Discussion section. Figure 2B shows the PBSn1 scores distribution, which exhibits a positive long tail, highlighting genes associated with the two strongest hits.
Top Variants Selected by PBSn1
| Chr | SNP ID | fATA | fMA | fEAS | PBSn1 | B | Gene | Conseq. | (KB) | |
|---|---|---|---|---|---|---|---|---|---|---|
| 3 | rs2276440 | 0.454 | 0.910 | 0.012 | 0.076 | 0.4551 | 0.949 | AP002806.1 | DS | 9.8 |
| 1 | rs11205084 | 0.413 | 0.903 | 0.051 | 0.123 | 0.4096 | 0.778 | LCE4A | US | 7.6 |
| 9 | rs1329776 | 0.5 | 0.896 | 0.051 | 0.123 | 0.4035 | 0.891 | TRPM3 | IN | 0 |
| 5 | rs17586072 | 0.429 | 0.958 | 0.205 | 0.128 | 0.3952 | 0.888 | RP11-114J13.1 | IN-NC | 0 |
| 1 | rs3002116 | 0.527 | 0.819 | 0.013 | 0.057 | 0.3873 | 0.594 | XPR1 | IN | 0 |
| 12 | rs17419697 | 0.5 | 0.238 | 0.988 | 0.998 | 0.3768 | 0.797 | VWF | IN | 0 |
| 17 | rs3095168 | 0.546 | 0.087 | 0.795 | 0.921 | 0.3707 | 0.666 | CENPV | US | 3.3 |
| 11 | rs17112293 | 0.391 | 0.857 | 0.205 | 0.117 | 0.3545 | 0.850 | ARHGAP20 | IG | 414 |
| 7 | rs10234832 | 0.470 | 0.905 | 0.294 | 0.005 | 0.3464 | 0.733 | AC005154.6 | NC | 0 |
| 1 | rs10924824 | 0.664 | 0.978 | 0.308 | 0.252 | 0.3342 | 0.858 | SCCPDH | DS | 0.3 |
Note.—Chr, chromosome; fATA and , derived allele frequency in the admixed and pseudounadmixed populations from Atacama, respectively. fMA and fEAS, derived allele frequency in Mesoamericans and East Asians, respectively; PBSn1, score; B, background selection coefficient; Conseq., SO consequence type. Abbreviations: DS, downstream; US, upstream; IN, intron; IN-NC, intron/noncoding transcript; IG, intergenic; NC, noncoding transcript. KB: kb from transcript.
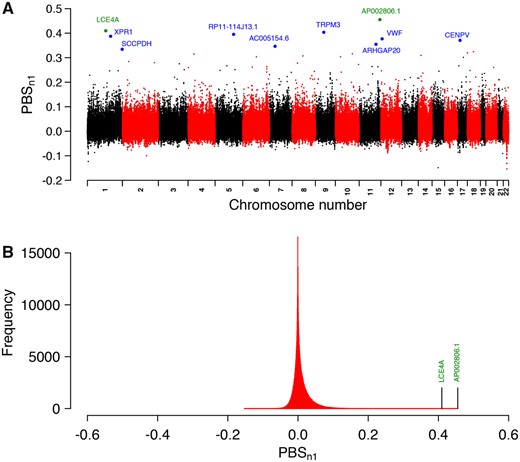
—PBSn1 scores across the genome. (A) Manhattan plot showing the PBSn1 scores along autosomic chromosomes. Blue and green dots represent selected variants with their associated genes. Green dots represent the two strongest hits. (B) Distribution of PBSn1 scores. Marked positions correspond to genes associated with the two strongest hits.
To assess how unlikely is to obtain the top PBSn1 scores, we estimated the distribution of the maximum of a sample based on the full set of PBSn1 measurements and extreme value theory (see a detailed description of the test in the Materials and Methods section). We obtained that the probability of observing a value ≥0.34 (the value of the tenth highest PBSn1 score) is 0.014. The probability of observing a value of PBSn1 ≥ 0.45 (the highest PBSn1 value) is 0.0034. Supplementary figures 2 and 3, Supplementary Material online, show the distribution plots.
In order to evaluate whether accelerated allele frequency differentiation of selected variants is due to BGS (Cruickshank and Hahn 2014), we obtained BGS coefficients (B) for selected variants. B values represent the reduction of neutral genetic diversity at a particular locus along the genome that is caused by BGS (McVicker et al. 2009). B ranges from 0 to 1, with B = 0 indicating an almost complete removal of genetic diversity due to BGS, and B = 1 indicates no effect of BGS on neutral genetic diversity. The mean B score of selected variants was 0.78, and the selected variant with the lowest B score had B = 0.594 (table 1 and supplementary fig. 4, Supplementary Material online). This suggests that high allele frequency differentiation of the selected SNPs is not due to BGS.
Associations between Selected Variants and BC in Subjects Exposed to As
Several organs and biological pathways have been hypothesized to be affected by adaptation to high As levels in humans, including the liver, the cardiovascular system and the respiratory system (Schlebusch et al. 2015). However, hitherto no study has evaluated such hypotheses. We evaluated whether adaptation to As may have affected the urinary bladder. We performed association tests between the ten variants selected by PBSn1 and BC occurrence in this cohort. This approach has proven successful in identifying variants and phenotypes underlying adaptation to extreme environments when sample sizes are small (Yi et al. 2010; Fumagalli et al. 2015; Ilardo et al. 2018), by alleviating the burden of multiple testing used in genome-wide association studies (GWAS) (Ilardo et al. 2018). We compared 92 cases who were treated for primary BC between 2013 and 2015 versus 93 controls with no BC diagnosis in these years. We adjusted for global ancestry, age, sex, and tobacco smoking. Tobacco is the most important risk factor for BC, being responsible for at least 50% of all cases (Freedman et al. 2011). Because ORFs are estimated to account for up to 10% of BC cases (Cumberbatch et al. 2015), we also adjusted the results for subjects who worked in at least one of the following activities: printing, hairdressing, mining, chemical industry, or rubber industry. No significant difference was found for age, sex, smoking status, or ORFs between cases and controls (supplementary table 1, Supplementary Material online). We accounted for multiple testing across selected SNPs by controlling the FWER at level α = 0.05 for a total of ten ordered tests. Here, a decreasing significance threshold was assigned to each selected locus according to their order in the ranking of PBSn1 scores (see Materials and Methods section for a description of the test). Table 2 shows the association P values and corresponding significance thresholds. The strongest association was achieved by the rs11205084 variant of LCE4A-C1orf68 (P = 0.012; significance threshold = 0.0087; table 2).
Association between Loci Selected by PBSn1 and BC Occurrence
| SNP ID | P Value | Significance Threshold |
|---|---|---|
| rs2276440 | 0.060 | 0.01743 |
| rs11205084 | 0.012 | 0.0087 |
| rs1329776 | 0.040 | 0.0058 |
| rs17586072 | 0.901 | 0.0043 |
| rs3002116 | 0.087 | 0.0034 |
| rs17419697 | 0.046 | 0.0029 |
| rs3095168 | 0.313 | 0.0024 |
| rs17112293 | 0.640 | 0.0021 |
| rs10234832 | 0.446 | 0.0019 |
| rs10924824 | 0.140 | 0.0017 |
Note.—Shown are SNP ID, the association P value, and the significant threshold after controlling the FWER. The strongest association is indicated in bold.
In order to assess whether there is enrichment in low association P values for BC among the top loci selected by PBSn1, we compared the distribution of all P values with the distribution of P values obtained from 1) the top 100 SNPs with highest PBSn1 scores and 2) 1,000 random samples of size n = 100. Each of the 1,000 random samples of size n = 100 were obtained by randomly picking P values from SNPs with similar characteristics in recombination rate and derive allele frequency from the top SNPs with highest PBSn1 scores. We explain in detail the sampling procedure in the Materials and Methods section. Figure 3A shows the distribution of P values from the 100 SNPs with highest PBSn1 scores, figure 3B shows the distribution of all P values and figure 3A shows the distribution of P values obtained from the random samples. These figures show an enrichment of small P values among the 100 SNPs with highest PBSn1 scores. We also calculated the mean BC association P value among loci with the top 5, top 10, top 25, top 50, and top 100 PBSn1 scores between the corresponding observed and random sets of P values. We found significant differences between the means of selected and random sets of BC association P values among the top 10, top 50, and top 100 sets of values, but not among the top 5 or top 25 sets of values. Supplementary table 2, Supplementary Material online, shows the summary statistics of the corresponding t-tests.
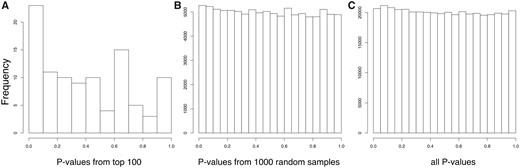
—Distribution of BC association P values among SNPs with highest PBSn1 scores. (A) Histogram showing observed P values for the top 100 PBSn1 SNPs. (B) Histogram of 1,000 random samples of P values of size n = 100. (C) Histogram of all BC association P values from the data set.
Postadmixture Adaptation Facilitated by Native-American Variants
Adaptive selection can act through gene flow between populations after an admixture event has occurred (Jeong et al. 2014). One way to detect it is to identify variants with significant deviations of the mean local ancestry from the genome-wide mean (Bryc et al. 2010; Bhatia et al. 2014; Jeong et al. 2014). In order to address whether the Atacama population inherited Native-American adaptation signals after the admixture between Native Americans and Europeans, we looked for deviations in the Native-American ancestry in the whole cohort. Local ancestry inference was performed with LAMP-LD (Baran et al. 2012), which uses samples from Native Americans, Europeans and Africans as proxies for ancestral populations (Eyheramendy et al. 2015). LAMP-LD identified at each individual in the study population, chromosomic regions with Native-American, European, or African ancestry. In our cohort, LAMP-LD estimated genome-wide local ancestry means of 0.441 (Native American), 0.521 (European), and 0.037 (African). At each SNP, the mean Native-American ancestry was compared with the genome-wide Native-American ancestry mean. Using t-tests, we evaluated the hypotheses H0: μNAT;i = 0:441 versus H1: μNAT;i > 0:441 and H0: μEUR;i = 0:521 versus H1: μEUR;i > 0:521, at each variant i. We detected 1,687 SNPs achieving the significance threshold of 5 × 10⁻⁵ recommended for recently admixed populations (Bhatia et al. 2014). Next, we excluded variants enriched in Native-American ancestry unrelated to the toxic effects As induces in the bladder. Thus, we looked for SNPs with significant Native-American ancestry deviations in the whole cohort as well as in BC controls considered separately, but which did not show significant deviations in BC cases considered separately. In this way, we obtained 188 SNPs. Figure 4A shows the mean local Native-American ancestry across the genome and highlights these 188 SNPs. Supplementary file 1, Supplementary Material online, shows the corresponding P values as well as annotations for these SNPs. Among these 188 variants, the strongest deviation in the Native-American ancestry was equally achieved by 31 SNPs in a region from chromosome 8 encompassing MAK16 and FUT10 genes (P = 1.3 × 10⁻⁹), including a missense variant in MAK16 (supplementary file 1, Supplementary Material online). Supplementary figure 5, Supplementary Material online, shows global ancestry proportions for each individual, estimated using LAMP-LD.
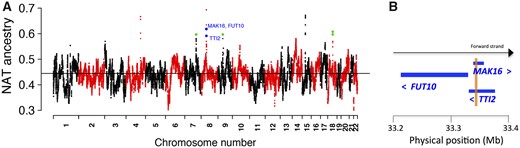
—Mean local Native-American ancestry along the genome. (A) Green dots represent SNPs with significant deviations in the mean local Native-American ancestry over the genome-wide mean in the whole cohort and in controls considered separately, but not in cases considered separately. Blue dots pinpoint the strongest hits (P = 1.3 × 10⁻⁹), which are associated with the MAK16/FUT10/TTI2 gene cluster of chromosome 8. The black horizontal line represents the genome-wide mean of the local Native-American ancestry of the complete cohort. (B) Simple representation of the genetic map of the MAK16/FUT10/TTI2 gene cluster (for a detailed genetic map see supplementary fig. 6, Supplementary Material online). The light brown vertical frame shows the overlapping of regions between MAK16 and TTI2. Blue arrowheads indicate the transcriptional orientation of the genes.
Further, we found that the MAK16 variants were in high LD with multiple variants in FUT10 (r2 = 0.90–0.95) as well as in the TTI2 gene (r2 = 0.9–1) (data queried from Ensembl), indicating that these three genes share a common haplotype. Indeed, exon 10 of MAK16 overlaps exons 6 and 7 of TTI2 (fig. 4B). Supplementary figure 6, Supplementary Material online, shows the detailed genetic map of these genes. We also found that the proteins encoded by MAK16, FUT10, and TTI2 are expressed in several cancer types, including urothelial cancer. Indeed, these proteins showed high/medium expression in 25%, 80%, and 100% of urothelial cancer patients tested, respectively (supplementary fig. 7, Supplementary Material online); data obtained from the Human Protein Atlas (Uhlén et al. 2015).
Discussion
Populations with Andean ancestry have been exposed for millennia to high As levels in water and present genetic signatures of adaptation to As in their genomes. For instance, studies in populations from northern Chile and Argentina found adaptations likely acting by improving the As-detoxifying activity of the AS3MT enzyme (Eichstaedt et al. 2015; Schlebusch et al. 2015; Apata et al. 2017). Some of these studies identified additional candidate genes targeted by As-driven adaptation, but their potential roles in this adaptation is unknown. It is also not known which organs are mostly affected by As toxicity, whose dysfunction arguably decreases fitness in these populations. For instance, it was suggested that adaptation to As could act by targeting the toxic effects it produces in the lung, immune cells, liver, and/or cardiovascular system (Schlebusch et al. 2015). In the present study, we addressed whether adaptation to As exposure could have affected the urinary bladder. To our knowledge, this is the first study that experimentally evaluates the downstream effects of As-driven positive selection on a specific organ or tissue system.
The population from the Atacama Desert in northern Chile is a unique model to study how adaptation to As exposure could have an effect on the urinary bladder. First, their local Native-American ancestors were of Andean ancestry and were exposed to high As levels (∼120 μg/l) for at least 5,000 years (Byrne et al. 2010; Latorre et al. 2013; Yáñez et al. 2015), enabling positive selective sweeps to act over hundreds of generations. Second, this selective pressure substantially increased in magnitude (up to ∼600 μg/l) during 1958–1971 in this population, producing significantly higher BC incidence and BC-specific mortality rates at present when compared with other Chilean regions (Fernandez et al. 2012). Third, we were able to recruit a case–control cohort with As-induced BC that was exposed to As ∼5 decades ago, enabling us to study the effects of adaptation to As over BC, a relatively rare phenotype.
We used the PBSn1 test to identify adaptation signatures underwent by the Andean ancestors of the Atacama people after their split from Mesoamericans ∼12,000 ya (Harris et al. 2018). The top selected locus was rs2276440 and is located 9.8-kb downstream of the AP002806.1 miRNA, whose biological functions have not been described. The second top selected locus was rs11205084, which showed the strongest association with BC occurrence (P = 0.012) among loci selected by PBSn1. This variant is located 7.7-kb upstream of the LCE4A-C1orf68 gene, which is involved in the barrier function of the epithelium (Kumar et al. 2014). Interestingly, urothelial BC originates exclusively in the urothelial epithelium (urothelium) (Chung et al. 2013). LCE4A-C1orf68 is a member of the Late Cornified Envelope (LCE) gene cluster. Of notice, the transcription of some LCE genes is activated by direct binding of p53 protein to LCE enhancers. p53 is one of the most important tumor suppressor genes in human carcinogenesis (Deng et al. 2014). Besides, LCE4A-C1orf68 variants are associated with susceptibility to infectious diseases, such as tuberculosis (Tian et al. 2017) and candidaemia (Kumar et al. 2014), as well as with autoimmune diseases, such as rheumatoid arthritis (Uddin et al. 2011) and psoriasis (Zhang et al. 2009). Moreover, the risk of BC increases significantly after autoimmune diseases, including rheumatoid arthritis and psoriasis (Liu et al. 2013). These observations suggest that LCE4A-C1orf68 might be involved in the immune barrier exerted by the urothelium (Lazzeri 2006) or other relevant epithelial tissues against dysregulated immune factors during carcinogenesis. Among loci selected by PBSn1, we also found a variant mapping the VWF gene (table 1), which is associated with traits of possible importance for As resistance. VWF encodes a key protein involved in coagulation, by facilitating adhesion of platelets to the endothelium of blood vessels. Also, high VWF levels are a well-known risk factor for arterial thrombosis (heart attack) (Sanders et al. 2013). Interestingly, a close relation between As concentration in the heart and coronary thrombosis has been reported in the Antofagasta region of northern Chile (Pizarro et al. 2012). Thus, loci selected by PBSn1 could also underlie adaptation to the detrimental effects As produces in the heart.
Our randomization results on BC association P values among loci detected by PBSn1 (fig. 3) show a clear enrichment in low P values among top PBSn1 loci, suggesting that polygenic adaptation to As affected the function of the urinary bladder in this population. Some of these loci might reflect a pleiotropic effect that resulted from adaptation to other cancers induced by high As exposure, such as lung and kidney cancers (Marshall et al. 2007; Ferreccio et al. 2013; Chen et al. 2018). Besides, we expect that some loci selected by PBSn1 are related to other environmental factors (e.g., local infectious pathogens) that were unique to the ancestral population of Atacamas which split from Mesoamericans ∼12,000 years ago (Ilardo et al. 2018).
The strongest deviations in the mean local Native-American ancestry captured by the ancestry-enrichment test were equally achieved by 31 SNPs in a region from chromosome 8 mapping MAK16 and FUT10 genes (P = 1.3 × 10⁻⁹). These genes are in high LD with TTI2, which shares common exons with MAK16 and was also among the genes selected by the ancestry-enrichment test (supplementary file 1, Supplementary Material online). MAK16 encodes a ribosomal protein with an important function in the biogenesis of eukaryotic ribosomes (Kater et al. 2017). Mutations affecting ribosomal structure and function have a causal relation with the development of many cancers (Pelletier et al. 2018). In particular, mutations in MAK16 induce the arrest of the cell cycle at G1 phase, during which the cell synthesizes mRNA and proteins in preparation for cell division. Remarkably, As exposure also induces the arrest of the cell cycle at G1 and G2M phases (Flora 2011). Several observations also support a likely involvement of FUT10 and TTI2 in cell cycle as well as cancer. FUT10 encodes a fucosyltransferase whose overexpression increases self-renewal of stem cells, whereas its suppression induces the differentiation of these cells (Kumar et al. 2013). Also, fucosylation is suggested to mediate tumor cell adhesion and proliferation in certain cancers (Carrascal et al. 2018). Thus, FUT10 may alter the cell cycle during tumorigenesis. TTI2 encodes a subunit of a master regulator complex of phosphoinositide-3-kinase-related protein kinase abundance and DNA damage response (Langouët et al. 2013). In turn, phosphoinositide-3-kinase-related protein kinases are involved in many signaling pathways, including those controlling cell-cycle progression (Abraham 2001). Taken together, these observations suggest that one or more Native-American variants in this gene cluster may be related with adaptation against As exposure following admixture, possibly by targeting cell-cycle proteins whose dysregulation produces cancer. However, due to the high LD and the fact that our data were from a SNP chip, it is difficult to pinpoint causative SNP(s) driving selection (Fumagalli et al. 2015). Interestingly, the ancestry-enrichment test identified significant variants that have been associated with physiological responses to cigarette smoke, which contains considerable levels of this xenobiotic and is a well-known risk factor for BC (Chung et al. 2013). One of them, rs848353 (P = 8.7 × 10⁻⁸) maps the AC004014.3 gene (supplementary file 1, Supplementary Material online) and has been associated by GWAS with nicotine dependence, number of cigarettes smoked per day and heaviness of smoking in East Asians (Yoon et al. 2012). The ancestry-enrichment test identified another variant, rs984655 (P = 2.8 × 10⁻⁸), located in the TPMTP1 gene (supplementary file 1, Supplementary Material online). Loci in this gene have been GWAS-associated with impaired pulmonary function in smokers (Lutz et al. 2015). The observation that variants detected by the ancestry-enrichment test map genes previously associated with physiological responses to cigarette smoke suggests postadmixture adaptation to As exposure.
We did not find an overlap between the hits detected by PBSn1 and the ancestry-enrichment test. This is not surprising, because these tests detect different kinds of adaptation signatures. PBSn1 is more suitable for detecting (preadmixture) adaptation driven by selective sweeps when selection is acting on standing variation (Yi et al. 2010). On the other hand, the ancestry-enrichment test detects postadmixture adaptation facilitated by gene flow, which is an evolutionary force different than selective sweeps acting on standing variation, and which closely resembles adaptive introgression (Bhatia et al. 2014; Jeong et al. 2014). Further, admixture with Europeans strongly modified—mostly decreased—the frequency of the Native-American adaptive alleles, as shown in table 1 (columns fATA and ). Arguably, if the same levels of As exposure are maintained over the admixed population, it would take several generations for that allele to arise into high frequency again. Among Chileans, admixture took place ∼10 generations ago (Eyheramendy et al. 2015), a relatively short time for adaptive alleles to recover the frequencies of the pseudounadmixed population. Future demographic inference analyses would be needed to test this hypothesis. These observations suggest that different sets of genes may play a role in adaptation to As depending on the genetic mechanisms behind the adaptation forces detected by the two tests.
The main native population from northern Chile is Aymara. However, until the annexation of a big part of the Atacama Desert by Chile from Bolivia in 1884 following the Pacific War, the major native populations in the Antofagasta region were Atacameño. Thereafter, continuous admixture events resulted in a present-day population in this region having ∼46% Native-American, ∼50% European, and ∼4% African ancestry (Eyheramendy et al. 2015). The lack of published genomes from extinct native populations from Atacama makes it difficult to identify the source population of the adaptation signatures selected in our cohort. A further constraint is that genetic adaptation to As in a population can exhibit significant subpopulation differences. For instance, an Aymara population from northern Chile historically exposed to high As levels in water has adaptive genetic variants in the As-related AS3MT gene. In contrast, a closely located and related population unexposed to As lacked these adaptations (Apata et al. 2017). It is likely that the most recent native ancestors of the modern Atacama population ultimately inherited As-related adaptation variants from an ancient Andean population ancestral to As-resistant populations from Chile and Argentina (Apata et al. 2017). In addition, the admixed Atacama population might have undergone further As-related adaptations due to the high As levels present in water (117–600 μg/l, in contrast to the 10 μg/l currently recommended by WHO for drinking water (Fernandez et al. 2012) before the incorporation of cleaner water sources in 1971 (fig. 1).
In summary, the results of this study contribute to a better understanding of the genetic factors underlying physiological adaptation in populations with Native-American ancestry historically exposed to As in water.
Data Access
The data generated in this study can be found in the following link: http://200.54.225.60/∼boris/mfernandez.
Supplementary Material
Supplementary data are available at Genome Biology and Evolution online.
Acknowledgments
This work was supported by the Fondo Nacional de Desarrollo Científico y Tecnológico “FONDECYT” (3170038 to L.V., 1120987 to M.I.F., and 1160833 to S.E.). S.E. was additionally supported by the Instituto Milenio de Investigación sobre los Fundamentos de los Datos (Iniciativa Científica Milenio). L.V. thanks Rasmus Nielsen for reading the manuscript, for providing intellectual input and for hosting him from August 2018 to January 2019 at the Center for Theoretical Evolutionary Genomics, UC Berkeley. L.V. thanks Vladimir Shchur from the Tikhonov Moscow Institute of Electronics and Mathematics, Russia, for helpful discussions. S.E. thanks Mark Shriver for sharing the Native-American panel. Conflicts of interest: The authors declare no conflicts of interest.
Author Contributions
L.V. and S.E. conceived and designed the positive selection screens. M.I.F. conceived the genotype–phenotype associations and supervised the underlying work. M.I.F., C.V., and K.E. designed and performed experiments underlying the associations. L.V., M.I.F., C.V., A.Z., and S.E. analyzed and interpreted the data. M.I.F., C.V., K.E., P.V., and E.C. acquired the data. M.I.F. obtained funding. L.V. wrote the manuscript, with input and critical revision for important intellectual content from M.I.F, S.E, C.V., and A.Z.
