


Abstract
Aegilops tauschii is the donor of the D subgenome of hexaploid wheat and a valuable genetic resource for wheat improvement. Several reference-quality genome sequences have been reported for A. tauschii accession AL8/78. A new genome sequence assembly (Aet v6.0) built from long Pacific Biosciences HiFi reads and employing an optical genome map constructed with a new technology is reported here for this accession. The N50 contig length of 31.81 Mb greatly exceeded that of the previous AL8/78 genome sequence assembly (Aet v5.0). Of 1,254 super-scaffolds, 92, comprising 98% of the total super-scaffold length, were anchored on a high-resolution genetic map, and pseudomolecules were assembled. The number of gaps in the pseudomolecules was reduced from 52,910 in Aet v5.0 to 351 in Aet v6.0. Gene models were transferred from the Aet v5.0 assembly into the Aet v6.0 assembly. A total of 40,447 putative orthologous gene pairs were identified between the Aet v6.0 and Chinese Spring wheat IWGSC RefSer v2.1 D-subgenome pseudomolecules. Orthologous gene pairs were used to compare the structure of the A. tauschii and wheat D-subgenome pseudomolecules. A total of 223 structural differences were identified. They included 44 large differences in sequence orientation and 25 differences in sequence location. A technique for discriminating between assembly errors and real structural variation between closely related genomes is suggested.
Introduction
Aegilops tauschii (2n = 2x = 14, genomes DD) is the donor of the D subgenome of hexaploid wheat (Triticum aestivum, 2n = 6x = 42, subgenomes AABBDD) (Kihara 1944; McFadden and Sears 1946). The species consists of 2 major phylogenetic lineages, designated as 1 and 2 (Wang et al. 2013), and 1 minor lineage, designated as 3 (Gaurav et al. 2021). The bulk of the wheat D subgenome was contributed by lineage 2 in northwestern Caspian Iran (Wang et al. 2013) and a small portion of it was introgressed from lineage 3 (Gaurav et al. 2021) and lineage 1 (Wang et al. 2013; Cavalet-Giorsa et al. 2024).
Aegilops tauschii is distributed from East Turkey to China and West Pakistan (Van Slageren 1994) and is adapted to a diversity of environments across its wide geographic range. The incorporation of the A. tauschii genome into hexaploid wheat increased wheat stress tolerance and environmental adaptability (Dubcovsky and Dvorak 2007). Aegilops tauschii remains an important genetic resource for wheat breeding, primarily for disease resistance (Gill et al. 1986; Raupp et al. 1993; Cox et al. 1994; Periyannan et al. 2013; Gaurav et al. 2021; Kou et al. 2023; Cavalet-Giorsa et al. 2024). Synthetic wheat produced by hybridization of tetraploid wheat with A. tauschii is an important source of new variation for broadening genetic diversity of the wheat D subgenome (Yang et al. 2009; Ogbonnaya et al. 2013; Li et al. 2014; Das et al. 2016; Cox et al. 2017; Rosyara et al. 2019; Wan et al. 2023).
The overall structure of A. tauschii chromosomes approximates the 7 chromosomes of the hypothetical progenitor of the tribe Triticeae (Luo et al. 2009). The A. tauschii genome is, therefore, a logical reference in analyses of chromosome structure and gene orthology in the tribe and the grass family (Luo et al. 2017; Sun et al. 2017; Dvorak et al. 2018).
For these basic and applied reasons, it is important that the genome sequence of A. tauschii keeps pace with advances in genome sequencing technology. That is particularly true as the A. tauschii genome is large (>4.2 Gb) and contains as much as 84.4% of repeated nucleotide sequences (Luo et al. 2017). As most of the A. tauschii repeated nucleotide sequences evolved recently (Dai et al. 2018), the A. tauschii genome contains many homogeneous repeated sequence families (Luo et al. 2017; Dai et al. 2018). Due to the large size of the genome and excessive homogeneity of repeated sequence families, the assembly of the A. tauschii genome sequence has been a challenging endeavor.
Two reference-quality genome sequences have been reported for A. tauschii acc. AL8/78 (lineage 2, Armenia) (Luo et al. 2017; Zhao et al. 2017). The genome sequence reported by Zhao et al. (2017) was assembled on a contractual basis by NRGene Inc. from short, whole-genome shotgun (WGS) Illumina reads. A sequence reported by Luo et al. (2017) was assembled by a combination of approaches. First, a physical map was built from bacterial artificial chromosomes (BACs) (Luo et al. 2013). The map was used to generate a BAC-by-BAC genome sequence. This sequence was merged with: (1) a sequence built by NRGene Inc. on a separate contractual basis from WGS Illumina reads and (2) mega-reads built from Pacific Biosciences (PacBio) reads by Zimin et al. (2017). The resulting assembly was validated with 3 genome-wide Bionano Genomics (henceforth Bionano) optical maps. This was assembly Aet v4.0 (Luo et al. 2017). The 7 Aet v4.0 pseudomolecules were 4,025 Mb long, while an additional 200 Mb of scaffolds were not assigned to pseudomolecules. Aet v4.0 was later improved by the deployment of additional Bionano optical maps, community annotation, and annotation of small RNAs yielding assembly Aet v5.0 (Wang et al. 2021).
Further improvements of the A. tauschii acc. AL8/78 reference genome sequence, resulting in assembly Aet v6.0, are reported here. This assembly was produced with the PacBio HiFi single-molecule sequencing technology and an optical map constructed with the Bionano direct-label-and-stain (DLS) chemistry.
The first-generation Bionano optical mapping chemistry utilized a single-strand restriction endonuclease to nick DNA, which was followed by enzymatic repairing and labeling of DNA nicks (Hastie et al. 2013; Luo et al. 2017). This chemistry was known as the nick, label, repair, and stain (NLRS) chemistry. Chance clustering of nick sites produced fragile regions in DNA molecules that were prone to breakage during sample preparation, thus limiting the length of optical contigs that could be assembled. In contrast, DLS chemistry labels DLE-1 restriction enzyme recognition sites directly without nicking DNA. This chemistry does not produce these fragile regions, and therefore longer optical contigs can be produced with it.
Here, DLE-1 optical mapping was combined with the long-read, single-molecule PacBio HiFi sequencing technology to produce the Aet v6.0 assembly. This hybrid approach produced scaffolds and super-scaffolds (SSs) with greater contiguity and improved structure compared to those of the prior Aet v5.0 assembly. These scaffolds and SSs were anchored on a high-resolution genetic map of A. tauschii (Luo et al. 2013), and Aet v6.0 pseudomolecules were constructed. Genes annotated in Aet v5.0 were transferred into the Aet v6.0 assembly.
To visualize structural differences between the Aet v5.0 and Aet v6.0 pseudomolecules, the pseudomolecules of the 2 assemblies were compared with a dot plot and also by aligning the pseudomolecules of the 2 assemblies on the DLE-1 optical genome map. As A. tauschii is the progenitor of the D subgenome of bread wheat, gene orthology between Aet v6.0 and the D subgenome of the reference genome sequence for Chinese Spring (CS) wheat, IWGSC RefSeq v2.1 (Zhu et al. 2021), was also assessed. Cultivar CS has served as a reference for wheat genetics since the 1950s and its genome sequence is an important reference for wheat genetics and genomics. Collinearity of orthologous gene pairs along pseudomolecules was used to detect structural differences between the 2 assemblies. Finally, a technique was described and evaluated for differentiating real structural differences from errors in assembly between the A. tauschii acc.AL8/78 genome and the CS wheat D subgenome.
Methods
Pacific Biosciences HiFi sequencing
High-molecular-weight (HMW) DNA was isolated from young leaves of A. tauschii acc. AL8/78 as described earlier (Dvorak et al. 1988). DNA was sheared to fragments between 15 and 20 kb using the Megaruptor 2 (Diagenode, Denville, NJ, USA). HiFi libraries were prepared using the SMRTbell Express Template Prep Kit 2.0 and cleaned with the Enzyme Clean up Kit (Pacific Biosciences, Menlo Park, CA, USA). The libraries were size selected utilizing BluePippin (Sage Sciences, Beverly, MA, USA). HiFi SMRTbell templates longer than 15 kb were collected and cleaned with AMPure PB beads (Pacific Biosciences). Concentration and final size distribution of the libraries were evaluated using a Qubit 1× dsDNA HS Assay Kit (Thermo Fisher, Waltham, MA, USA) and Femto Pulse System (Agilent, Santa Clara, CA, USA), respectively. HiFi libraries with approximate insert sizes of 15 kb were independently sequenced on 2 SMRT cells of a Pacific Biosciences Sequel II instrument (Pacific Biosciences) at the Vincent J. Coates Genomics Sequencing Lab, University of California, Berkeley, and assembled using Hifiasm v0.16.1-r374 with parameters of “-l 0 -f 39” (Cheng et al. 2021) to generate a primary assembly contig graph.
Construction of the DLE-1 optical map
To construct DLE-1 optical map of A. tauschii acc. AL8/78, HMW-DNA was isolated from young leaves following the Bionano Prep Plant Tissue DNA Isolation Base Protocol (Bionano Genomics, San Diego, CA, USA). DNA was labeled with the DLE-1 restriction enzyme and stained according to instructions in the Bionano Prep Direct Label and Stain Kit (Bionano Genomics). Labeled molecules were scanned with the Saphyr system (Bionano Genomics). The consensus optical map was de novo assembled with the Assembler tool in the Bionano Solve v3.2 package using significance cutoffs of P < 1 × 10⁻¹⁰ to generate a draft consensus map (CMAP), P < 1 × 10⁻¹¹ for draft CMAP extension, and P < 1 × 10⁻¹⁵ for final merging of the draft CMAP while choosing the “nonhaplotype”, “noES”, and “noCut” options.
Scaffolding
Scaffolds were assembled with the hybrid scaffold pipeline in the Bionano Solve v3.3 package (Bionano Genomics). The scaffolding process consisted of 5 major steps. (1) In silico DLE-1 restriction maps were generated for the PacBio HiFi sequence assembly. (2) Problematic regions were manually analyzed by altering contig assembly stringency, and by aligning the in silico maps (CMAPs) against the DLE-1 optical map. (3) Hybrid scaffolds consisting of HiFi sequence contigs and DLE-1 optical contigs aligned on each other were generated. If a DLE-1 contig aligned to 2 or more HiFi contigs, the HiFi contigs were oriented and linked. The sizes of gaps between sequence contigs were estimated based on the DLE-1 map. (4) Sequence CMAPs and hybrid scaffolds were aligned. (5) AGP and FASTA files were generated for the hybrid SSs. Conflicts between sequence and optical contigs were manually examined and resolved, which produced the final set of SSs.
Anchoring of super scaffolds on a genetic map
SSs generated with the hybrid scaffolding pipeline were aligned on a high-density SNP-based genetic map built from marker segregation in a biparental AL8/78 × AS75 F2 mapping population (Luo et al. 2013). The map consisted of 7,185 SNP marker loci (Luo et al. 2013). The order and orientation of SSs along each chromosome were determined using a basic local alignment search tool (BLAST). The SSs were aligned using 99% identity with the e-value >10−5. All cases in which 2 SNP markers that were not physically close to each other, but were present in the same SS, or in which SNP markers were located in more than 1 SS, were manually scrutinized.
Pseudomolecule construction, validation, and analysis
SSs ordered on the genetic map were joined with ‘N’ characters while strand orientation of neighboring SSs was considered. This produced Aet v6.0 pseudomolecules.
The following strategy was used to validate and analyze the Aet v6.0 pseudomolecules. Each Aet v6.0 pseudomolecule was in silico digested (Bionano Access Software) to create its consensus DLE-1 restriction map (CMAP) and was then anchored back to the SS CMAP using the RefAligner tool (Bionano Access Software). Also digested in silico were Aet v5.0 pseudomolecules (Wang et al. 2021), and CMAPs were created for them as well. The Aet v5.0 pseudomolecule CMAPs and Aet v6.0 pseudomolecule CMAPs were aligned. The ordering and orientation of alignments were manually inspected to identify problem regions. The Nucmer alignment tool (Marcais et al. 2018) was used to verify the Aet v6.0 and Aet v5.0 assemblies. The output-coordinated files obtained from Nucmer were used to generate a dot plot (Marcais et al. 2018) for the visualization of discrepancies between the 2 assemblies, such as incorrectly placed sequence segments, duplicated or missing segments, and incorrectly oriented sequence segments.
Gene model transfer from Aet v5.0 to Aet v6.0
Genes models were transferred from Aet v5.0 to Aet v6.0 with the Liftoff program (Shumate and Salzberg 2021) using default parameters; liftoff –g.gff3 -o.gff3 -u.txt -copies -chroms.fasta.fa and the Aet v5.0 gene models. Based on their coordinates, the transcript sequences were extracted with the gffread program (Pertea and Pertea 2020), and putative open reading frames of transcripts and corresponding protein sequences were determined with Transdecoder v5.7.0 (https://github.com/TransDecoder/TransDecoder/releases) using the following parameters: -m 30 --retain_pfam_hits –retain_blastp_hits. The classification of transferred genes as high-confidence (HC) and low-confidence (LC) genes [International Wheat Genome Sequencing Consortium (IWGSC) 2014] assigned to the genes in the Aet 5.0 assembly was retained. The predicted protein sequences were mapped against PfamAB.hmm (Mistry et al. 2021) and filtered based on homology modeling, the number of PFAM domains, the number of significant BLAST hits, and the total length of coding sequence (CDS) with start and stop codon. The completeness of gene transfer was evaluated by searches against 4,956 BUSCO genes using BUSCO software (BUSCO 4.1.4) (Manni et al. 2021). For each BUSCO gene absent from Aet v6.0, it was determined if it was also absent in Aet v5.0 (Wang et al. 2021).
Orthologous relationships between Aet v6.0 genes and those of the Chinese Spring D subgenome
A BLAST (Camacho et al. 2009) homology search with the parameter setting -max_target_seqs 3 was performed with the Aet v6.0 genes used as queries and the CS IWGSC RefSeq v2.1 D-subgenome genes (Zhu et al. 2021) as targets. The following data were recorded: top 3 hits including gene name, locations in the CS v2.1 D-subgenome pseudomolecule registry in base pairs (bp), sequence identity in % of bp, CDS length, and the length of alignment of the query/target genes.
The strategy for discovering orthologous genes was derived from the concept of “conserved gene neighborhood” (CGN). CGN was defined as genomic segments containing orthologous genes in a similar collinear order (Kuzniar et al. 2008). This definition was turned around for defining orthologous genes: “A query gene and top BLAST hit gene in a collinear order in a CGN are orthologous.” This definition and its use are illustrated by the following example. Consider the ascending sequence of query genes A B C D E F G along a segment of an Aet v6.0 pseudomolecule. Assume that the top BLAST gene hits along a corresponding segment of a D-subgenome pseudomolecule were in the following ascending order: A B D E F C G. Genes A B D E F G were in a collinear order in the CGN along the segment in Aet v6.0 and CS D subgenome and each of them should be a member of an orthologous gene pair. Genes C were in noncollinear locations and most likely were a product of gene duplication/deletion. Hence, genes C should be a paralogous gene pair.
However, it cannot be excluded for any of the A B D E F G collinear gene pairs that they have not been subjected to a tandem duplication in A. tauschii followed by gene deletions. For example, a tandem duplication of gene E in A. tauschii prior to the origin of hexaploid wheat would produce an in-paralogous tandem gene duplication E1 E2. If E1 was deleted from the A. tauschii chromosome while E2 was deleted from the D-subgenome chromosome, E genes would be out-paralogues E1 and E2 in the 2 pseudomolecules, despite their apparent collinearity in the CGN. A reverse scenario could be visualized for gene C. If gene C was moved to a new position by transposition without a gene duplication, the 2 C genes would be orthologues, despite the CGN being perturbed. For both reasons, absolute orthologous/paralogous gene relationships are difficult to prove. As a recognition of that fact, we will refer to the gene pairs identified by our method as putative orthologous and putative paralogous gene pairs.
A complicating situation was when neighboring Aet v6.0 query genes were duplicated and both hit the same target gene. In such cases, the percent of gene sequence identity and length of query–target alignment were used to infer which of the 2 query genes was a putative orthologue and which was a putative paralogue. Threshold sequence identity of 97.0% was chosen based on mean sequence identity μ = 99.4% between 40,448 putative orthologous gene pairs (Supplementary Table 1), a standard deviation σ = 1.65%, and the level of significance α = 0.01. An orthology/paralogy inference was not made for duplicated query genes below the threshold.
Results and discussion
Assembly
Two Sequel II SMRT cells were sequenced with third-generation PacBio HiFi sequencing technology. A total of 8.05 million high-quality HiFi reads with an average read length of 14.9 kb were obtained and assembled into 1,367 contigs with a maximum length of 131 Mb and an N50 contig length of 31.8 Mb. A sequencing depth of 20× or more is needed for a genome sequence assembly from HiFi reads (Zhang et al. 2023). As the total depth of our HiFi reads was 29.3× genome equivalents, no polishing of the 1,367 contigs was pursued, as would otherwise be needed with a lower depth of HiFi reads (Zhang et al. 2023).
To deploy the Bionano hybrid scaffold pipeline in the assembly, a Bionano DLE-1 optical map for A. tauschii acc. AL8/78 was constructed. A total of 3,670,984 molecules (851.02 Gb) were used to assemble the Bionano optical genome map. A total of 254 contigs of a total length of 4,060.33 Mb and N50 of 45.11 Mb were obtained (Table 1). This contig N50 greatly surpassed the contig N50 of 2.17 Mb obtained with the NLRS chemistry (Luo et al. 2017). The total length of the optical map was close to the genome size reported for AL8/78, 4.22 Gb, based on the total sequence length of the Aet v4.0 assembly (Luo et al. 2017).
Metrics for the genome-wide DLE-1 optical map of Aegilops tauschii acc. AL8/78.
| Metric | |
| Molecules (no.) | 3,670,984 |
| Total length of molecules (Gb) | 851.02 |
| Average length (Kb) | 231.82 |
| Molecule N50 (Kb) | 224.79 |
| Label density (per 100 Kb) | 12.77 |
| Coverage of the reference genome (X) | 208.59 |
| Contigs (no.) | 254 |
| Map total length (Mb) | 4,060.33 |
| Mean contig length (Mb) | 15.98 |
| Contig N50 (Mb) | 45.11 |
| Maximum contig length (Mb) | 153.28 |
Using the Bionano hybrid scaffold pipeline, sequence scaffolds and DLE-1 optical contigs were aligned and neighboring sequence scaffolds were linked. Conflicts were manually resolved. Ultimately, a final set of 1,254 SSs/contigs was produced. Fifty-five contigs were eliminated (52 were mitochondrial DNA contaminations, and 3 were <200 bp long), leaving 1,199 SS/contigs for the construction of pseudomolecules.
To generate pseudomolecules, SSs/contigs were anchored on a high-density, SNP-based genetic map (Luo et al. 2013). Of the 1,199 SSs/contigs, 92 SSs with a combined length of 4,055 Mb, representing 97.99% of the total SSs/contig length, were anchored. The 92 anchored SSs produced 7 Aet v6.0 pseudomolecules (Table 2). The remaining 1,107 SSs/contigs of a combined total length of 67.68 Mb and representing 1.64% of the total assembly length could not be anchored and were excluded from pseudomolecule construction (Table 2).
Anchoring of SSs with SNP markers on the genetic map, thereby producing Aet v6.0 pseudomolecules.
| Pseudomolecule | SSs (no.) | SNPs (no.) | Length (bp) | Ns (no.) |
|---|---|---|---|---|
| Chr1 | 11 | 967 | 507,515,187 | 188,860 |
| Chr2 | 12 | 1,299 | 654,279,071 | 57,881 |
| Chr3 | 16 | 1,097 | 629,928,798 | 213,896 |
| Chr4 | 15 | 786 | 528,822,301 | 104,851 |
| Chr5 | 10 | 1,004 | 584,392,136 | 236,951 |
| Chr6 | 9 | 747 | 497,522,035 | 233,166 |
| Chr7 | 19 | 1,102 | 652,241,641 | 335,886 |
| Total | 92 | 7,002 | 4,054,701,169 | 1,371,491 |
The number of gaps and their combined total length was significantly reduced in the Aet v6.0 pseudomolecules compared to Aet v5.0 pseudomolecules; 351 gaps in Aet 6.0 vs 52,910 in Aet 5.0 (Table 3). Ninety-one of the 351 gaps were of an unknown length. For those, 100 Ns were inserted into the gap to link adjacent SSs. The remaining 260 gaps were of a known length, which ranged from 23 to 65,714 bp and were filled with corresponding numbers of Ns. In total, there were 1.37 million Ns in the pseudomolecules (Table 2).
Comparison of the Aet v5.0 and Aet v6.0 pseudomolecules.
| Pseudomolecule | Assembly | Total length (bp) | Gap length (bp) | Effective length (bp) | Gaps (no.) |
|---|---|---|---|---|---|
| Chr1 | Aet v5.0 | 501,967,303 | 8,406,331 | 493,560,972 | 6,647 |
| Aet v6.0 | 507,515,187 | 188,860 | 507,326,327 | 39 | |
| Chr2 | Aet v5.0 | 650,458,083 | 8,558,830 | 641,899,253 | 8,139 |
| Aet v6.0 | 654,279,071 | 57,881 | 654,221,190 | 36 | |
| Chr3 | Aet v5.0 | 627,456,150 | 9,202,775 | 618,253,375 | 9,437 |
| Aet v6.0 | 629,928,798 | 213,896 | 629,714,902 | 63 | |
| Chr4 | Aet v5.0 | 525,206,139 | 8,086,205 | 517,119,934 | 6,175 |
| Aet v6.0 | 528,822,301 | 104,851 | 528,717,450 | 48 | |
| Chr5 | Aet v5.0 | 576,238,907 | 12,629,354 | 563,609,553 | 7,615 |
| Aet v6.0 | 584,392,136 | 236,951 | 584,155,185 | 51 | |
| Chr6 | Aet v5.0 | 495,363,004 | 7,581,178 | 487,781,826 | 6,199 |
| Aet v6.0 | 497,522,035 | 233,166 | 497,288,869 | 38 | |
| Chr7 | Aet v5.0 | 644,841,383 | 14,867,162 | 629,974,221 | 8,698 |
| Aet v6.0 | 652,241,641 | 335,886 | 651,905,755 | 76 | |
| v6.0-v5.0 | 33,170,200 | −67,960,344 | 101,130,544 | −52,559 | |
| Probability (t-test) | P = 0.23 | P = 0.0001 | P = 0.005 | P = 0.0001 |
Pseudomolecule validation
The Aet v6.0 pseudomolecules were compared with the Aet v5.0 pseudomolecules by a genome-wide dot-plot (Fig. 1). The dot-plot hinted at structural differences between the 2 assemblies within 6 of the 7 pseudomolecules, but no differences among pseudomolecules were apparent (Fig. 1). The differences primarily consisted of the orientation and placement of segments within pseudomolecules.
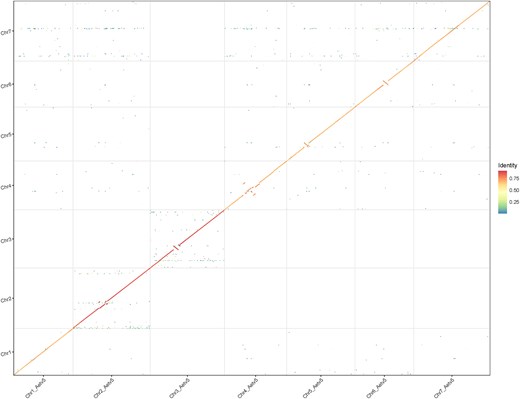
Dot-plot between Aet v5.0 and Aet v6.0 pseudomolecules. The Aet 5.0 pseudomolecules are on the vertical axis and Aet v6.0 pseudomolecules are on the horizontal axis. Note differences in orientation and placement of scaffolds within pseudomolecules for Chr2, Chr3, Chr4, Chr5, and Chr6. Sequence identity scale is on the right.
To visualize differences between homologous Aet v5.0 and Aet v6.0 pseudomolecules in greater detail, in silico DLE-1 digests of homologous pseudomolecules were aligned (Fig. 2). The alignments revealed differences between all 7 pseudomolecule pairs. Small sequence insertions/deletions were apparent in all pseudomolecule pairs, and differences in the orientation or ordering of sequence segments were apparent in the centromeric regions of 6 of the 7 pseudomolecule pairs (Fig. 2).
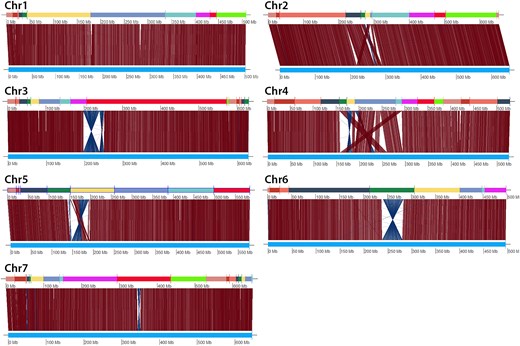
Alignments of corresponding DLE-1 restriction sites between homologous Aet v5.0 and Aet v6.0 pseudomolecules. In each alignment, the sequence of Aet v6.0 SSs is at the top and the Aet v5.0 pseudomolecule is at the bottom. The vertical and/or diagonal lines between these 2 tracks connect the locations of corresponding DLE-1 restriction sites.
The following approach, illustrated with the alignments of pseudomolecules for Chr2 (Fig. 3), was used to determine which of the 2 pseudomolecules was correct. Segments in which Aet v5.0 and Aet v6.0 pseudomolecules differed were aligned on the DLE-1 optical genome map (Fig. 3). A pseudomolecule showing the same structure as the optical map was concluded to be correct. This approach indicated that the differences between the Aet v6.0 and Aet v5.0 pseudomolecules were likely errors in the Aet v5.0 assembly.
![Veracity of differences between Chr2 pseudomolecules in Aet v5.0 and Aet v6.0. a) Dot-plot showing differences in scaffold ordering and orientation between the Aet v5.0 and Aet v6.0 pseudomolecules for Chr2. b) As in Fig. 2, the top track is the sequence of 12 Aet v6.0 SSs (arbitrarily colored) and the bottom track is the Aet v5.0 pseudomolecule. The vertical and/or diagonal lines between these 2 tracks connect the locations of corresponding DLE-1 restriction sites. The alignment of DLE-1 sites confirmed the differences in scaffold ordering and orientation shown by the dot plot a). c, d) In each image, the top track is a representation of the relevant HiFi SSs of Aet v6.0; the middle track with the base-pair register is the HiFi-DLE-1 hybrid scaffold, and the bottom track, in c), or bottom 2 tracks, in d), are the DLE-1 optical scaffolds. Two regions in Aet v6.0 showed reverse orientation compared to Aet v5.0: SC100084 (the fifth SS from the left in the top track in b) and SC171 (the sixth SS from the left in the top track in b)]. c) The SC100084 region, spanning 9,765,966–12,911,409 bp, is oriented in b) in the opposite direction in Aet v5.0 compared to its orientation in Aet v6.0. However, the HiFi-DLS hybrid scaffolds (middle track) are oriented in the same direction as those in SC100084 (top track) and on the optical map (lower track), indicating that the orientation of the region in Aet v6.0 is correct. d) The region spanning 1,504,058–1,509,984 bp in scaffold SC171 (top track) is collinear with HiFi-DLE-1 hybrid scaffold (middle track) and the DLS optical map (lower track), indicating that the orientation of the region in Aet 6.0 is correct.](https://oup.silverchair-cdn.com/oup/backfile/Content_public/Journal/g3journal/15/5/10.1093_g3journal_jkaf042/1/m_jkaf042f3.jpeg?Expires=1749747809&Signature=bdsdawUYQUrcOXCBey0mI~C21WFFmtTiwIh60o0Xa6XAbRatbfuEbtn1E07Ph1NGdSuXP--AgF8qLLo8N1tyrlkSfYUJ31IWWTVtqm20QJ6XknPjKYoxgBn9VBh6v4YTVuhcZEHf71i5hvc7SGJUdyh~BfLQ20rwiQrMV-pdlCQ1e4aB3jW~RQwhSpwslnwILiUQzEykNEIJKL9~-ow7~vfq6xCN3ZBSAZV1ZY7x4W-Fcsn04eoImXOs-SE1oxfc8Ksm5Ghvj7xk45vd2or8b2qHmubiXny~Ud7qfOXC73wgWH~fQE01Vyc-IHEGCBEClwzmUSEqdbPrnT4qHSM2sQ__&Key-Pair-Id=APKAIE5G5CRDK6RD3PGA)
Veracity of differences between Chr2 pseudomolecules in Aet v5.0 and Aet v6.0. a) Dot-plot showing differences in scaffold ordering and orientation between the Aet v5.0 and Aet v6.0 pseudomolecules for Chr2. b) As in Fig. 2, the top track is the sequence of 12 Aet v6.0 SSs (arbitrarily colored) and the bottom track is the Aet v5.0 pseudomolecule. The vertical and/or diagonal lines between these 2 tracks connect the locations of corresponding DLE-1 restriction sites. The alignment of DLE-1 sites confirmed the differences in scaffold ordering and orientation shown by the dot plot a). c, d) In each image, the top track is a representation of the relevant HiFi SSs of Aet v6.0; the middle track with the base-pair register is the HiFi-DLE-1 hybrid scaffold, and the bottom track, in c), or bottom 2 tracks, in d), are the DLE-1 optical scaffolds. Two regions in Aet v6.0 showed reverse orientation compared to Aet v5.0: SC100084 (the fifth SS from the left in the top track in b) and SC171 (the sixth SS from the left in the top track in b)]. c) The SC100084 region, spanning 9,765,966–12,911,409 bp, is oriented in b) in the opposite direction in Aet v5.0 compared to its orientation in Aet v6.0. However, the HiFi-DLS hybrid scaffolds (middle track) are oriented in the same direction as those in SC100084 (top track) and on the optical map (lower track), indicating that the orientation of the region in Aet v6.0 is correct. d) The region spanning 1,504,058–1,509,984 bp in scaffold SC171 (top track) is collinear with HiFi-DLE-1 hybrid scaffold (middle track) and the DLS optical map (lower track), indicating that the orientation of the region in Aet 6.0 is correct.
Gene model transfer from the Aet v5.0 assembly to the Aet v6.0 assembly
A total of 68,383 genes, 32,712 HC and 35,671 LC genes, were transferred from Aet 5.0 into Aet 6.0 (Table 4). There were 173 more HC genes and 232 more LC genes in Aet v6.0 pseudomolecules compared to the Aet v5.0 assembly. While some of these additional genes are genes that were on unassigned scaffolds in Aet v5.0, some may be errors in the gene transfer, which may have generated spurious duplicated genes. A total of 1,920 artifactual duplicated genes in addition to the gene models present in Aet v5.0 were encountered in an earlier draft of gene transfer to Aet v6.0, most of them having the same start and end bp coordinates. Most of these genes were removed, but 115 of such gene pairs that had the same start bp coordinates, but differed in the ending nucleotide and when used as BLAST queries against wheat D subgenome genes IWGSC RefSeq v2.1 hit different target genes were left in the Aet v6.0 gene database (Supplementary Table 1). These spurious duplicated genes were labeled with an exclamation mark in column D of Supplementary Table 1.
The numbers of HC and LC genes in the 7 A. tauschii Aet v6.0 pseudomolecules, the numbers of putative orthologous gene pairs, the numbers of putative paralogues gene pairs, gene pairs for which orthologous/paralogous relationship could not be estimated (uncertain), and numbers of query genes for which target genes were undetected by BLAST in the CS IWGSC RefSeq v2.1 pseudomolecules.
| Chr. | All | Ortholog. | Paralog. | Uncertain | Undetected | |||||
|---|---|---|---|---|---|---|---|---|---|---|
| HC | LC | HC | LC | HC | LC | HC | LC | HC | LC | |
| Chr1 | 4,165 | 4,790 | 3,589 | 1,524 | 428 | 2,434 | 95 | 162 | 53 | 670 |
| Chr2 | 5,543 | 5,831 | 4,883 | 2,019 | 436 | 2,691 | 166 | 337 | 58 | 780 |
| Chr3 | 5,172 | 5,400 | 4,495 | 1,896 | 417 | 2,442 | 170 | 318 | 90 | 744 |
| Chr4 | 3,616 | 3,830 | 3,167 | 1,312 | 293 | 1,842 | 70 | 166 | 86 | 510 |
| Chr5 | 5,219 | 5,277 | 4,677 | 1,804 | 323 | 2,404 | 151 | 333 | 68 | 736 |
| Chr6 | 3,895 | 4,401 | 3,282 | 1,405 | 386 | 2,152 | 85 | 185 | 142 | 559 |
| Chr7 | 5,102 | 6,144 | 4,405 | 1,989 | 466 | 2,918 | 154 | 274 | 77 | 963 |
| Total | 32,712 | 35,671 | 28,498 | 11,949 | 2,749 | 16,883 | 891 | 1,775 | 574 | 5,066 |
| % | 47.8 | 52.2 | 87.1 | 33.5 | 8.4 | 47.3 | 2.7 | 5.0 | 1.7 | 15.5 |
In addition to BLAST searches in Supplementary Table 1, the completeness of gene model transfer was assessed by searches for a set of 4,956 BUSCO genes in Aet v6.0 and Aet v5.0. A total of 4,584 (92.5%) BUSCO genes were found in the Aet v6.0 assembly and 4,592 (92.6%) were in the Aet v5.0 assembly. The close agreement in the detection of BUSCO genes in the 2 assemblies confirmed that gene model transfer from Aet v5.0 to Aet v6.0 was adequate. Nevertheless, de novo reannotation of the Aet v6.0 genome sequence using an approach analogous to that recently applied to the human genome (Varabyou et al. 2023) would be desirable.
Putative orthologous genes in the Aet v6.0 and CS IWGSC RefSeq 2.1 D-subgenome assemblies
We considered it of interest to ask how much agreement was between Aet v6.0 and the most recent sequence assembly of the D subgenome of CS wheat, IWGSC RefSeq v2.1 (Zhu et al. 2021). We employed gene collinearity along pseudomolecules and BLAST searches to identify putative orthologous gene pairs between Aet v6.0 and CS D subgenome as detailed in Methods.
Briefly, each of the 68,383 Aet v6.0 genes (Table 4) was used as a query in BLAST searches against the CS v2.1 D-subgenome gene set. The locations of the top 3 CS target gene hits on D-subgenome pseudomolecules were recorded in a spreadsheet (Supplementary Table 1). Also recorded was percent sequence identity and the length of query/target alignment for each query and target gene pair. If query and top target genes were in a collinear ascending or descending order, they were classified as putative orthologues. If they were noncollinear, they were classified as putative paralogues. If the BLAST search failed to detect any target, such a query gene was classified as undetected in the CS D subgenome (Table 4). If juxtaposed query genes hit the same target gene and both showed sequence identity less or more than 97%, the orthologous/paralogous decision was not made (Table 4).
A total of 28,498 (87%) putative orthologous gene pairs were identified for the 32,712 Aet v6.0 HC genes, but only 11,949 (33.5%) of putative orthologous gene pairs were identified for the 35,671 LC genes (Supplementary Table 1, Table 4) (P < 0.001, paired t-test). A reverse trend was encountered for the putative paralogous gene pairs. A total of 16,883 (47.3%) paralogous gene pairs were encountered for the 35,671 LC Aet v6.0 genes but only 2,749 (8.4%) paralogous gene pairs were encountered for the 32,712 HC Aet v6.0 genes (P < 0.001, paired t-test) (Table 4). For 891 HC and 1,775 LC query genes, an orthologous/paralogous decision was not made (Table 4).
The number of putative orthologous gene pairs found here, 40,447, greatly exceeded 6,449 orthologous gene pairs previously estimated for the same A. tauschii accession and the same wheat cultivar (Sun et al. 2017). While the number of orthologues may be overestimated here, as pointed out in Methods, the difference between the 2 estimates is too large to be attributable only to an overestimation. There would have to be approximately 4 duplication/deletion events of the type described in Methods for every real orthologous gene pair. Fragmented genome sequences or a too-conservative algorithm used by Sun et al. (2017) may have likely caused this large difference.
The average sequence identity for 40,447 putative orthologous gene pairs (Supplementary Table 1) was 99.4% (σ = 1.65%). Of this, the average sequence identity for the HC orthologous genes was 99.6% (σ = 1.2%), and for the LC orthologous genes was 99.3% (σ = 1.3%). The average sequence identity between putative paralogous HC and LC genes was 93.3% (σ = 6.7%) and 95.2% (σ = 4.5%), respectively (Supplementary Table 1).
Collinear putative orthologues were used to identify differences in orientation and locations of sequence segments in Aet v6.0 and CS RefSeq v2.1 assemblies (Table 5). Differences in orientation were allocated into 3 classes based on the number of gene pairs involved (Table 5). Those involving 2 gene pairs were the most common. The second most common type was differences in segment orientation involving 4 or more gene pairs (Table 5).
Structural differences between the Aet v6.0 and CS RefSeq v2.1 pseudomolecules.
| Pseudomolecule | Difference in orientation | Difference in location | |||
|---|---|---|---|---|---|
| 2 genes | 3 genes | >3 genes | Intrachr. | Interchr. | |
| Chr1 | 14 | 2 | 7 | 2 | 1 |
| Chr2 | 31 | 3 | 5 | 4 | 0 |
| Chr3 | 23 | 2 | 8 | 1 | 1 |
| Chr4 | 7 | 4 | 8 | 4 | 2 |
| Chr5 | 22 | 3 | 6 | 0 | 0 |
| Chr6 | 23 | 1 | 4 | 4 | 2 |
| Chr7 | 14 | 5 | 6 | 4 | 0 |
| Total (no) | 134 | 20 | 44 | 19 | 6 |
Differences in segment location were considered only if the segment involved 3 or more collinear orthologous gene pairs. Differences in segment location within a pseudomolecule were more common than those among pseudomolecules (P = 0.026, paired t-test) (Table 5).
Application of BLAST sequence identity in identifying potential errors in an assembly
Collinearity analyses between Aet v6.0 and CS D-subgenome pseudomolecules revealed 6 interchromosomal location differences (labeled red in Supplementary Table 1) and 19 intrachromosomal location differences (labeled blue in Supplementary Table 1) of homologous segments (Supplementary Table 1, Table 5). If a location difference were an assembly error, the Aet and CS segments would be orthologous segments placed in a wrong place in one of the assemblies. If a location difference were real, the segments would likely be paralogous to each other because they were produced by segmental duplication. In the former case, collinear genes along a segment would be putative orthologues, but in the latter case, they would be putative paralogues. The average sequence identity of collinear gene pairs across 5 of the 6 pairs of segments located in different pseudomolecules ranged from 92.0% to 95.7% with a mean of 94.9% (Supplementary Table 1), which was similar to the average sequence identity for paralogous gene pairs. The average sequence identity was 100% across the sixth segment (genes AET4D6G0108200LC to AET4D6G0108300LC, Supplementary Tables 1). Based on the above reasoning this likely was the only assembly error among the 6 segments.
The same rationale was applied to the 19 intrachromosomal segment location differences. They too fell into 2 classes. The mean identity of collinear gene pairs across a segment ranged from 78.8% to 97.1% with a mean of 92.2% for 6 segments but ranged from 98.6% to 99.9%, with a mean of 99.5%, for the remaining 13 segments (P = 0.04, 2-tailed t-test with unequal variance). Based on the same reasoning as above, we suggest that the former 6 segments may have been real intrachromosomal translocations, but the latter 13 segment location differences were assembly errors.
We attempted to apply this approach to the 44 differences in the orientation of segments. The average sequence identity ranged from 100% to 93.7% across the 44 segments with a mean of 98.7% (s = 1.67%). The average sequence identity of collinear genes across a segment failed to show a clear bimodal density distribution, possibly due to the fact that segments differing in orientation (inversions) cannot be paralogous.
However, a comparison of the average sequence identity of collinear genes within a segment with that of flanking segments can potentially be used to discriminate between orientation errors in assembly from real inversions. Inversion polymorphism in a population is in a heterozygous state for a substantial length of time after its origin. During that time, heterozygosity acts as a recombination suppressor and precludes purifying selection from acting against mutations in genes in the segment, leading to faster divergence and lower sequence identity between collinear genes within the segment than genes flanking it.
Consider 2 segments differing by orientation between Aet v6.0 and CS D subgenome on pseudomolecules for Chr3. An inversion starting with A. tauschii gene AET3D6G0489500 (Supplementary Table 1) involved 4 collinear genes with an average identity of 93.6%. Sequence identity of 10 genes on the distal side of the segment was 98.9% (P = 0.05, t-test) and sequence identity on the proximal side of the segment was 99.0% (P = 0.009, t-test). Since the collinear genes in the inverted segment were more diverged than those in the flanking segments, this orientation difference was likely due to a real paracentric inversion. An opposite inference was made for the difference in segment orientation including 21 collinear genes starting with A. tauschii gene AET3D6G0502800 on pseudomolecule Chr3 (Supplementary Table 1). The average identity of the collinear genes was 96.9% and that of flanking 13 and 8 collinear genes was 99.4% (P = 0.06, t-test) and 97.8% (P = 0.59, t-test), respectively. In this case, the divergence of flanking collinear genes between Aet v6.0 and the D subgenomes of CS was similar to that within the segment. The difference in segment orientation between the 2 genomes was likely an assembly error.
These examples illustrate the utility of inferences on putative orthologous relationships for the detection of potential errors in the orientation and location of scaffolds in a genome assembly. This validation would be even more useful if pseudomolecules in one of the compared assemblies were nearly free of major structural errors. The hybrid approach to genome sequence assembly employing the third-generation PacBio HiFi sequencing technology and DLE-1 optical maps produces structurally robust pseudomolecules, which could be used for validation of other assemblies.
Data availability
The Aet v6.0 assembly is available at NCBI under Bioproject PRJNA341983. Gene annotations and optical maps are available at https://doi.org/10.5061/dryad.bvq83bkjg.
Supplemental material available at G3 online.
Funding
This work was supported by the U.S. National Science Foundation grant IOS-2102953.
Author contributions
J.D., M.-C.L., P.E.M, and Y.Q.G. conceived the project. K.R.D. prepared DNAs used for sequencing. N.H. and Y.Q.G. constructed PacBio HiFi sequence libraries. M.-C.L. and L.W. performed HiFi sequence assembly. T.Z. and M.-C.L. constructed Bionano DLS optical maps. M-C.L. performed hybrid scaffolding. R.M.S. and M.-C.L. constructed pseudomolecules. R.M.S. performed BUSCO analysis and gene annotations. J.D. with L.W. performed collinearity analysis and discovery of orthologous genes. R.M.S., M.-C.L., and J.D. wrote the first draft of the paper. All authors edited and approved the final draft.
Literature cited
Author notes
Rukmangada Maratikyathanahalli Srikanta and Le Wang contributed equally to this work.
Conflicts of interest: The author(s) declare no conflict of interest.
