


Abstract
The soybean tentiform leafminer, Macrosaccus morrisella (Fitch) (Lepidoptera: Gracillariidae), is native to North America where it was known to feed on American hogpeanut and slickseed fuzzybean. However, it has recently expanded its host range to include soybean, an important agricultural crop. Here, we report a new, highly contiguous genome for this species with a length of 245 Mb, N50 of 9 Mb, and 96.33% BUSCO completeness. The mitochondrial genome shares only 81% identity to its nearest relative in the NCBI nucleotide database indicating long-standing divergence or sparse sequencing in this clade. To determine whether host plant choice is genetically driven, we sequenced 18 individuals across 3 locations in Minnesota, USA, collected from both American hogpeanut and soybean plants. Genetic variation did not correlate with population structure based on either geography or host plant species (weighted FST estimate: 0.0058). As a secondary measure, we independently assembled complete mitochondrial genomes from all individuals and observed no delineation between host or location. The overall lack of detectable population structure at the nuclear and mitochondrial genome levels suggests a large population with flexible dietary preferences and does not show evidence of genetically driven host preference.
Introduction
Gracillariidae is a diverse family of about 2000 species whose larvae are plant miners, with most species being monophagous (eating a single host species) or oligophagous (eating only a few species) leaf miners (Davis 1987; van Nieukerken et al. 2011; Kawahara et al. 2017; De Prins and De Prins 2024) Gracillariid larvae are hypermetamorphic wherein instars of different developmental stages have distinct sap-feeding and tissue-feeding forms (Davis 1987; De Prins and De Prins 2024). Within this family, Macrosaccus is a relatively small genus of 5 New World species that feed on Fabaceae (Fabales) (Davis and De Prins 2011). The soybean tentiform leafminer, Macrosaccus morrisella (Fitch) (Lepidoptera: Gracillariidae), is native to North America where it was known to feed on American hogpeanut, Amphicarpaea bracteata (L.) Fernald, and slickseed fuzzybean, Strophostyles leiosperma (Torr. and A. Gray) Piper (Fabales: Fabaceae) (Davis and De Prins 2011). These 2 vining legumes occur in forest understories in eastern North America (USDA 2024a). However, M. morrisella was recently discovered feeding on soybean in Quebec, Canada, in 2016 and in Minnesota, USA, in 2021 (Koch et al. 2021). Soybean is a major source of vegetable oil and protein grown on 34,913,000 and 2,300,000 ha in the USA and Canada, respectively (USDA 2024b).
Adults of M. morrisella oviposit on soybean leaves (Menger et al. 2024). The feeding injury (i.e. mines) created by larvae of M. morrisella progress from serpentine mines, to blotch mines to tentiform mines as the larvae develop (Davis and De Prins 2011; Koch et al. 2021; Menger et al. 2024). These mine types are named after the appearance of the damage on the leaf as the miner feeds and the ultimate tentiform structure is created. The larvae pupate inside the mines (Davis and De Prins 2011; Koch et al. 2021). Like other leafminers (Kappel and Proctor 1986; Liu et al. 2015; Ullah et al. 2020), it is believed that the feeding injury from M. morrisella reduces photosynthesis of infested leaves of soybean plants (Koch et al. 2021). Development of M. morrisella from egg to adult requires an accumulation of 425 degree-days above a lower developmental threshold of 8.96°C, which could enable repeated attack of soybean plants by multiple generations of M. morrisella within a single growing season (Ribeiro et al. 2024).
As a new pest, relatively little is known about the biology of M. morrisella. Kogan (1981) stated that an important source of new pests for soybean in North America would be native oligophagous (i.e. legume feeding) insects adapting to soybean, which seems to align well with the appearance of M. morrisella in soybean. Advances in genomics research are facilitating the understanding of insect adaptation to new host plants (Simon et al. 2015). However, despite their biological and economic significance, the genomes have been sequenced from relatively few (only 3) species of Gracillariidae. Here, we provide the first genome sequence for M. morrisella to establish a foundation for examination of its biology and development of more sustainable management programs. In addition, we characterize the genomic variability and association with host plant use.
Materials and methods
Sample collection
To sequence the complete genome of M. morrisella, individuals were obtained from a laboratory colony established in 2022 and maintained over ∼22 generations according to Menger et al. (2024) at the University of Minnesota, Minnesota, USA. In short, this colony was initiated with adults of M. morrisella reared from soybean leaves infested with pupae of M. morrisella collected from a soybean field in Henderson, Minnesota, USA, in summer 2022. In the laboratory colony, emerged adults were allowed to oviposit for 48–72 h on potted soybean plants (variety: “Sheyenne”) at the V1–V2 developmental stage (Purcell et al. 2014) inside an oviposition cage. After oviposition, potted plants with M. morrisella eggs were transferred to a separate cage for development of immature M. morrisella. When M. morrisella reached the pupal stage, the pots were transferred to an adult emergence cage. After adult emergence, the process described above was repeated to maintain the colony. The colony was maintained in a walk-in environmental growth chamber at 25 ± 2°C and 16 h photophase.
From this colony, pupae were manually collected from mines of infested soybean plants with the help of an entomological pin (size #1) and a fine paintbrush to carefully open the mines and the silken cocoons. Collected pupae were placed inside individual 2-mL microcentrifuge tubes for adult emergence. A single pair of freshly emerged (i.e. <24 h old) adults (F0) was bred using the above-mentioned methods, their offspring were raised until pupation, and an F1 sibling pair was bred using these same methods. Finally, the resulting F2 offspring were used for sequencing the reference genome and are referred to as the “F2 isoline.”
To examine population genomics of M. morrisella, soybean fields infested with M. morrisella were sampled on July 20 and 2023 August 10 in Brooten, Minnesota, on 2023 June 22 and 23 in St. Paul, Minnesota, and on 2023 August 14 in Rochester, Minnesota, USA. For each field on each sample date, 20 soybean leaflets containing tentiform mines of M. morrisella were manually collected from field edges (first 3 rows) adjacent to wooded areas, placed inside an individually labeled 17 × 17-cm resealable plastic bag, and then into a refrigerated cooler for transportation to the laboratory at the University of Minnesota Saint Paul Campus. Samples were collected from edges of soybean fields near wooded areas because infestations are higher at these locations (Ribeiro and Koch 2024). Similarly, 20 leaflets of American hogpeanut containing tentiform mines of M. morrisella were collected from forested areas <2.5 km from the soybean fields sampled, on the same dates and using the same methods described above for soybean. These methods were used to minimize geographical and temporal variability between samples from both hosts. In the laboratory, the collected leaflets were placed inside emergence cages similar to Melotto et al. (2023), with a moist cotton ball on a petri dish inside each cage to help maintain the relative humidity inside cages at ∼70%. Deionized water was added to the cotton balls every 2–3 days. Cages were maintained inside a rearing room at ∼25°C and 16 h photophase for adult emergence. The emergence of M. morrisella adults was evaluated every 2–3 days, and adults were collected from emergence cages with the help of a mechanical aspirator (Clarke Mosquito Control, #13500, St. Charles, IL, USA). On each evaluation day, collected adults were placed inside individual 2-mL microcentrifuge tubes containing 90% ethanol/deionized water (v/v) solution and stored inside a −20°C freezer. The preserved adults of M. morrisella were used for population genomics analysis described below.
DNA extraction and sequencing
Approximately 20 individuals from the F2 isoline underwent DNA extraction using a Qiagen MagAttract kit (cat. 67563) according to the manufacturer's instructions. The resulting DNA was pooled and library prepped using a ligation sequencing kit, LSK-114 from Oxford Nanopore Technologies (ONT). The library was run on a single promethION flowcell using a P2 Solo instrument (ONT). Resulting squiggle data in pod5 format were basecalled using dorado v0.7.0 and model [email protected] including 5mC methylation calling at CpG sites.
Genome assembly
Reads longer than 5 kb were corrected using the HERRO algorithm as implemented in dorado v0.7.0. The genome was assembled using hifiasm v0.16.0 (Cheng et al. 2021). Completeness was assessed using Compleasm (Huang and Li 2023), an alternative to BUSCO that uses the same BUSCO databases. Here, we used the lepidoptera_odb10 database matching to 5286 genes for completeness. To reduce duplicate BUSCO percentage below 1%, we applied three successive rounds of purge_dups v1.2.6 (Guan et al. 2020). Residual adaptor and vector sequence was removed from the assembly using the NIH Foreign Contaminant Screening tool. Repeats were identified using RepeatModeler2 v2.0.5 (Flynn et al. 2020) to generate a species-specific repeat database which was run against the assembly using RepeatMasker v4.1.6 (Smit et al. 2013). Other genomes from Gracillariidae underwent the same analysis for comparative purposes. The mitochondrial sequences were identified using MitoHiFi (Uliano-Silva et al. 2023) and initially aligned to the mitogenome from Euspilapteryx auroguttella Stephens (Lepidoptera: Gracillariidae). DNA methylation was determined by pileup of the modified cytosines into bedmethyl format via modkit v0.3.1. Protein prediction and annotation was performed using GeMoMa v1.9 with monarch butterfly genes as a guide. The pipeline for assembly and analysis is available in Supplementary File 1.
Population genomic analysis
The DNA of the field populations was extracted and sequenced with the same parameters as above. Each individual was barcoded individually and sequenced using the native barcoding kit SQK-NBD-114 from ONT. Resulting barcodes were separately aligned to the reference isoline genome. SNVs were called using Clair3 v1.0.10 (Zheng et al. 2022) and resulting vcf files were merged using bcftools (Danecek et al. 2021). The merged vcf was filtered to remove any variants below Q20, indels, no more than 10% individuals missing a genotype, minimum depth 2X, max depth 100X, and a minor allele frequency of <8% (at least 3 individuals must have a minor allele present per variant location). Fst, principal component analysis, heterozygosity, and depth were performed in plink 1.9 (Purcell et al. 2007). First linkages were pruned and the filtered vcf was used to create the principal component analysis (PCA) plot. Admixture plots were created using admixturePipeline (Mussmann et al. 2023) and visualized with Clumpak (Kopelman et al. 2015). The VCF file for all individuals is available as Supplementary File 2.
Results and discussion
Assembly
Pairs of M. morrisella from a laboratory colony were selected for sibling mating to reduce heterozygosity prior to reference genome assembly. After 2 generations, larval specimens were collected for DNA extraction, sequencing, and assembly. Nanopore sequencing produced 79.6 Gb of reads with a read length N50 of 3.7 kb and an average Q-score of 16.9 (Supplementary Table 1). The complete output underwent read correction and filtering resulting in 21 Gb with a read N50 of 9.1 kb used for assembly. The assembled F2 isoline reference genome (STLf2iso) is 245 Mb in length, consisting of 68 contigs with an N50 of 9 Mb and is similar or better in quality to members of the same insect family (Table 1). The genome contained 96.33% BUSCOs (lepidoptera_odb10) with <1% duplication rate, similar to 2 of the other high-quality Gracillariidae genomes available on NCBI and exceeding the cocoa pod borer, Conopomorpha cramerella (Snellen) (Lepidoptera: Gracillariidae) assembly (Table 2). The initial genome assembly was attempted using wild-caught specimens; however, difficulty in achieving high contiguity led us to develop the F2 isoline to reduce heterozygosity. Our assembly pipeline deviated from standard practice due to the high heterozygosity causing assemblers to generate excessive haplotigs, manifested by extraordinarily high duplicate BUSCOs in draft assemblies (some assemblies with 95% duplicate rates) and abnormally large estimated genome sizes. The use of HERRO-corrected reads to improve read quality, the choice of hifiasm over flye assembler, and 3 rounds of haplotig purging via purge_dups resulted in a highly contiguous genome with <1% duplicate BUSCOs, and the expected genome size for a leafminer moth of this family.
Assembly comparison of M. morrisella and other gracillariid genomes available from NCBI.
| Scientific name | Common name | Assembly | Num seqs | Sum length | Min length | Max length | N50 | N50 num | GC (%) |
|---|---|---|---|---|---|---|---|---|---|
| Macrosaccus morrisella | Soybean tentiform leafminer | STLf2iso | 68 | 245,695,242 | 475 | 16,440,956 | 9,036,253 | 11 | 36.44 |
| Conopomorpha cramerella | Coco pod borer | ASM1293212v1 | 73,142 | 497,288,140 | 200 | 351,205 | 12,136 | 7,764 | 38.13 |
| Euspilapteryx auroguttella | Leaf blotch miner | ilEusAuro2.1 | 103 | 331,914,766 | 9,628 | 22,118,606 | 11,650,979 | 12 | 37.39 |
| Aspilapteryx tringipennella | Leaf blotch miner | ilAspTrin1.1 | 144 | 261,726,888 | 1,000 | 17,401,394 | 9,501,776 | 12 | 37.44 |
BUSCO completeness of M. morrisella and other gracillariid genomes available from NCBI.
| Scientific name | Genome | Complete | Single | Duplicate | Fragment (1) | Fragment (2) | Missing |
|---|---|---|---|---|---|---|---|
| Macrosaccus morrisella | STLf2iso | 96.33% | 95.76% | 0.57% | 0.25% | 0.00% | 3.42% |
| Conopomorpha cramerella | ASM1293212v1 | 75.22% | 66.78% | 8.44% | 11.39% | 0.25% | 13.15% |
| Euspilapteryx auroguttella | ilEusAuro2.1 | 97.47% | 96.94% | 0.53% | 0.36% | 0.00% | 2.18% |
| Aspilapteryx tringipennella | ilAspTrin1.1 | 98.07% | 97.67% | 0.40% | 0.28% | 0.00% | 1.65% |
The genome consists of 42.28% repetitive elements with the vast majority being interspersed repeats rather than simple repeats (Table 3). Most were novel to this genome with only 4.35% detected when using the publicly available Dfam database. The repeat content is in line with other animal genomes, though the elements which make up the bulk of the retroposed copies appear to be novel to this clade and were not represented in the public database of known repeat elements.
Repeat content of M. morrisella genome.
| Name | Number of Elements | Combined length (bp) | Genome (%) |
|---|---|---|---|
| Retroelements | 65,049 | 15,218,873 | 6.19 |
| L2/CR1/Rex | 11,341 | 3,125,896 | 1.27 |
| R1/LOA/Jockey | 267 | 266,376 | 0.11 |
| R2/R4/NeSL | 109 | 102,121 | 0.04 |
| RTE/Bov-B | 40,620 | 6,683,247 | 2.72 |
| LTR elements | 4,060 | 3,315,565 | 1.35 |
| BEL/Pao | 1,809 | 1,259,292 | 0.51 |
| Ty1/Copia | 238 | 240,322 | 0.1 |
| Gypsy/DIRS1 | 2,013 | 1,815,951 | 0.74 |
| DNA transposons | 11,208 | 2,342,485 | 0.95 |
| hobo-Activator | 492 | 131,477 | 0.05 |
| Tc1-IS630-Pogo | 1,098 | 482,457 | 0.2 |
| PiggyBac | 85 | 89,644 | 0.04 |
| Other | 4,572 | 508,478 | 0.21 |
| Rolling-circles | 843 | 67,541 | 0.03 |
| Unclassified | 538,871 | 86,328,898 | 35.14 |
| Total interspersed repeats | - | 103,890,256 | 42.28 |
| Satellites | 6 | 3,542 | 0 |
| Simple repeats | 58,446 | 2,606,605 | 1.06 |
| Low complexity | 9,588 | 468,330 | 0.19 |
The mitochondrial genome is 15,437 bp in length with 37 genes with no frameshifts in our assembly (Fig. 1). This is smaller than the bait mitogenome we used for assembly which was 17,050 bp in length from E. auroguttella. When BLASTed against lepidoptera, the closest match is to Argyresthia albistria Haworth (Lepidoptera: Yponomeutidae) mitochondrion with 81.55% identity over 99% length. When BLASTed against Gracillariidae, the closest match is to E. auroguttella with 82.83% identity over 97% length. High mitochondrial divergence even to other Gracillariidae genomes indicates a long history of separation and sparse coverage of sequenced genomes in this clade.
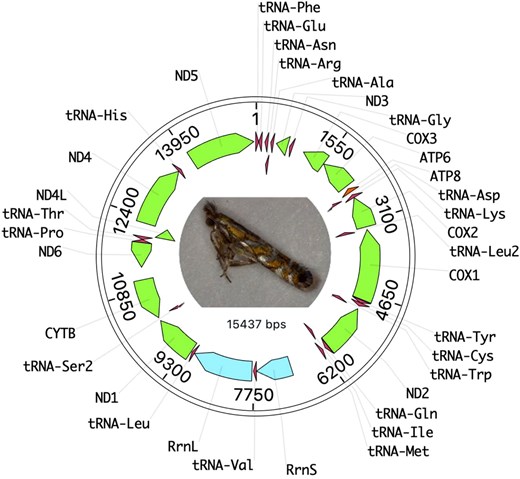
Mitogenome structure of the F2 isoline strain of M. morrisella. Coding regions are in green, tRNAs in red, and the small and large mitochondrial ribosomal subunits are in blue.
Protein prediction yielded 10,709 transcripts with an overall protein BUSCO score of 90.77% completeness consisting of 84.26% single copy, 6.51% duplicates, 0.19% fragments, 9.04% missing (Supplementary File 3) (Melotto et al. 2023). To determine pipeline efficacy, we used the same parameters on the previously published E. auroguttella genome (ilEusAuro2.1) and found very similar detection levels, 90.11% completeness consisting of 84.43% single copy, 5.68% duplicates, 0.40% fragments, and 9.50% missing.
Population genomics
We sequenced 18 individuals collected from the field, representing 3 biological replicates per host plant (either soybean or American hogpeanut), from 3 geographical locations, St. Paul, Rochester, and Brooten, Minnesota. Their depth when mapped to our 245 Mb genome ranged from 6X to 45X, mean 19X (Supplementary Table 2). Nanopore sequencing allows detection of DNA modifications along with sequence variants. None of the 18 individuals had any appreciable DNA methylation (mean 1.01%) or DNA hydroxymethylation (mean 0.22%), indicating that this species does not utilize DNA methylation as a regulatory mechanism (Supplementary Table 3).
We called variants using Clair3 followed by standard filtering guidelines. Variant depth ranged from 4.62X to 24.95X. The fixation index (FST) estimate was 0.0052 (weighted FST estimate: 0.0058) indicating very low genetic differentiation between groups. The populations are largely similar genetically and are likely interbreeding with high gene flow or share a very recent common ancestor, leading to similar genetic structures (Table 4).
Population genomics of M. morrisella from soybean or American hogpeanut collected at 3 geographical locations in Minnesota, USA.
| ID | Clair3 variants | Mean depth | Observed (homozygous) | Estimated (homozygous) | Filtered sites | Fa |
|---|---|---|---|---|---|---|
| St.Paul_Hogpeanut_1 | 7,683,179 | 5.70 | 96,055 | 101,804.3 | 138,751 | −0.15561 |
| St.Paul_Hogpeanut_2 | 9,128,991 | 13.70 | 107,412 | 109,066.9 | 148,306 | −0.04218 |
| St.Paul_Hogpeanut_3 | 8,989,974 | 8.27 | 104,614 | 108,517.2 | 147,600 | −0.09987 |
| St.Paul_Soybean_1 | 9,081,916 | 12.08 | 107,633 | 109,077.2 | 148,328 | −0.03679 |
| St.Paul_Soybean_2 | 9,215,482 | 13.09 | 107,833 | 108,825.9 | 147,972 | −0.02536 |
| St.Paul_Soybean_3 | 9,331,466 | 16.66 | 108,591 | 108,923.1 | 148,099 | −0.00848 |
| Rochester_Hogpeanut_1 | 9,145,820 | 10.09 | 106,582 | 108,638.5 | 147,735 | −0.0526 |
| Rochester_Hogpeanut_2 | 9,369,275 | 19.50 | 107,009 | 108,828.1 | 147,987 | −0.04645 |
| Rochester_Hogpeanut_3 | 9,202,282 | 11.01 | 107,356 | 108,773.8 | 147,904 | −0.03623 |
| Rochester_Soybean_1 | 9,393,790 | 24.65 | 107,055 | 108,757.2 | 147,873 | −0.04352 |
| Rochester_Soybean_2 | 9,515,691 | 24.95 | 107,623 | 108,876 | 148,017 | −0.03201 |
| Rochester_Soybean_3 | 8,267,404 | 7.08 | 103,034 | 106,543.9 | 144,939 | −0.09141 |
| Brooten_Hogpeanut_1 | 7,772,523 | 6.07 | 98,226 | 106,014.2 | 144,339 | −0.20322 |
| Brooten_Hogpeanut_2 | 6,768,449 | 4.77 | 88,920 | 96,074.6 | 131,140 | −0.20404 |
| Brooten_Hogpeanut_3 | 6,572,378 | 4.62 | 86,391 | 97,063.6 | 132,512 | −0.30107 |
| Brooten_Soybean_1 | 8,234,980 | 7.22 | 101,119 | 108,277 | 147,304 | −0.18341 |
| Brooten_Soybean_2 | 9,164,946 | 20.86 | 108,515 | 108,789.3 | 147,920 | −0.00701 |
| Brooten_Soybean_3 | 9,103,057 | 12.69 | 108,255 | 108,728.5 | 147,829 | −0.01211 |
| Isoline | 3,797,437 | 43.00 | - | - | - | - |
| Mean | 8,407,318 | 14.00 | 103,457 | 106,754 | 145,253 | −0.0878539 |
aNegative values indicate excess of heterozygotes beyond HW eq.
The heterozygosity was calculated on filtered biallelic SNVs of high quality. The moderate negative inbreeding coefficient (F values) in the field samples suggests that they are generally outbred, with a small excess of heterozygous sites, which is typical for natural populations. Most field samples have F values between −0.1 and −0.03, indicating a modest excess of heterozygous sites, which could be due to the Wahlund effect (Garnier-Géré and Chikhi 2013). The Wahlund effect occurs when a population is structured into subpopulations with limited gene flow between them, and these subpopulations have different allele frequencies. When samples are pooled together without accounting for the subpopulation structure, it can result in an apparent excess of heterozygosity across the combined population compared with Hardy–Weinberg equilibrium.
The PCA plot resulted in 2 distinct clusters, though not separated by either host species or geographic region of collection, indicating wide diversity and unrestricted gene flow in this population (Fig. 2). The variation explained by the first 2 components is relatively low (7.57% for PC1 and 6.8% for PC2), suggesting that there may be other genetic factors influencing the populations that are not captured by these 2 components alone.
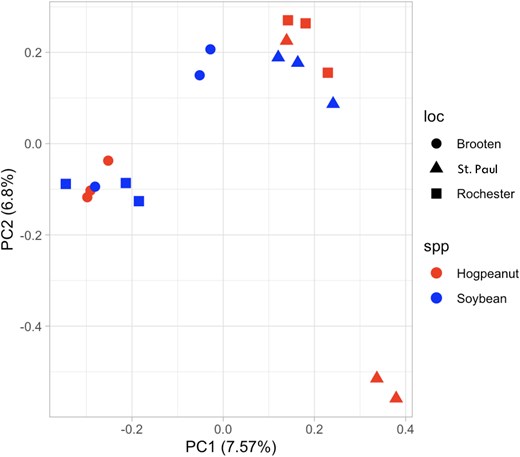
PCA of genetic variation among M. morrisella populations. The plot shows 18 individuals grouped by sampling location (Brooten, St. Paul, Rochester) and host plant (American hogpeanut or soybean). PC1 and PC2 explain 7.57 and 6.8% of the variation, respectively.
We performed an admixture analysis to further distinguish the population structure (Fig. 3). At k = 2, there was a clear division of populations between the St. Paul and Brooten samples; however, the Rochester samples clustered on both sides of the distribution by host plant. At k = 3, the isoline reference genome diverged from all other samples. Up to k = 4, the American hogpeanut samples from Brooten and soybean samples from Rochester maintain the greatest homogeneity, with all individuals in the orange group, suggesting a common origin. At k = 4 and above, the population structure no longer diverged in a defined way according to sample origin. Even the most homogenous cluster at k = 4 is derived from both host plants indicating that genetic divergence is not driven by host preference.
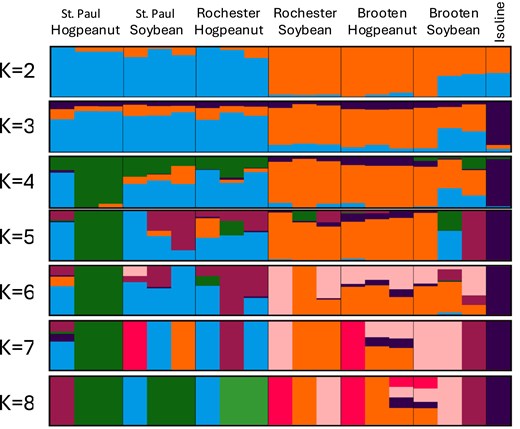
Admixture plot showing genetic structure of M. morrisella populations across different locations (St. Paul, Rochester, Brooten) and host plants (American hogpeanut, soybean). Each vertical bar represents an individual, and different colors indicate proportions of ancestry from inferred genetic clusters. The number of clusters (K) ranges from 2 to 8, revealing increasing genetic complexity. Clear differentiation based on host plant is visible at lower K values, while location-specific variation and admixture become more apparent at higher K values.
Mitochondrial population structure
Genetic divergence between laboratory-reared and wild populations is commonly seen for insects due to factors such as adaptation to laboratory conditions, inbreeding, or genetic drift (Hoffmann and Ross 2018). Mitochondrial sequence divergence was used as a secondary method to reconstruct any population structure that may have existed for M. morrisella. We used complete mitogenomes independently assembled from each of the 3 biological replicates collected across host plants and geographic regions (Fig. 4). All field samples clustered separately from the F2 isoline reference mitogenome; however, there was very little sequence divergence among them. No consistent monophyly was seen between host plant and geographic region. The short x-axis reflects the small number of substitutions seen over the entire population.
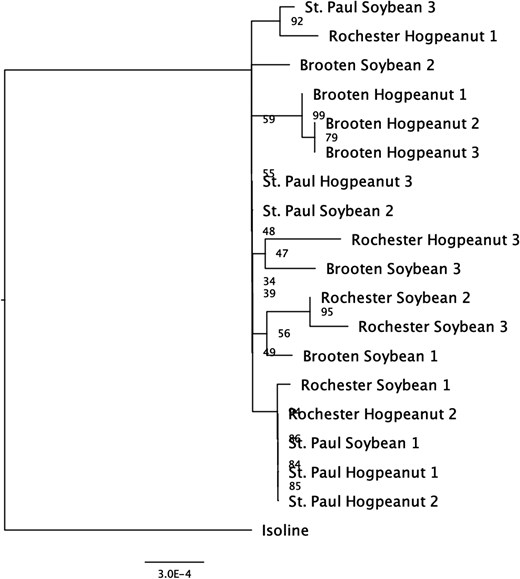
Phylogenetic tree of 18 M. morrisella individuals based on mitochondrial genome sequences. Individuals are grouped by sampling location (St. Paul, Rochester, Brooten) and host plant (American hogpeanut, soybean). The tree is rooted with the reference isoline as an outgroup. Some clustering by location is observed (e.g. Brooten and Rochester), but there is no clear pattern by host plant. Bootstrap values indicate support for major branches, with values over 90 suggesting well-supported relationships. Scale bar represents genetic distance.
Conclusion
The newly created reference genome for M. morrisella gives insight to its place in the Gracillariidae family tree, showing high genomic heterozygosity and early divergence from related species. The lack of detectable population structure at the nuclear and mitochondrial genome levels suggests a large population with flexible dietary preferences and does not show evidence of genetically driven host preference. Overall, the findings of this study advance the knowledge of the biology of M. morrisella and will help to establish the foundation for development of management strategies for this insect.
Data availability
Assembly and BioSample information is available at NCBI BioProject number PRJNA1173748, BioSample number SAMN44319150, and accession number JBIOAS000000000. Raw sequencing reads are available at the NCBI sequence read archive accession number SRR32170798.
Supplemental material available at G3 online.
Acknowledgments
We thank Fabio Führ for assistance collecting and rearing the insects. We also thank Gloria Melotto for reviewing an early version of the manuscript.
Funding
This research was supported by the North Central Soybean Research Program and the Minnesota Rapid Agricultural Response Fund.
Author contributions
A.V.R. and R.L.K. provided the insect samples. C.W. performed the extractions, sequencing, and quality analyses. C.F. assembled the genome and performed population analyses. C.F., A.V.R., and R.L.K. wrote and edited the manuscript. R.L.K. and C.F. secured funding to support this work. All authors have read and approved the manuscript prior to submission.
Literature cited
Author notes
Conflicts of interest: The author(s) declare no conflicts of interest.
