


Abstract
We describe the Q fever epidemic in the Netherlands with emphasis on the epidemiological characteristics of acute Q fever patients and the association with veterinary factors. Data from 3264 notifications for acute Q fever in the period from 2007 through 2009 were analysed. The patients most affected were men, smokers and persons aged 40-60 years. Pneumonia was the most common clinical presentation (62% in 2007 and 2008). Only 3.2% of the patients were working in the agriculture sector and 0.5% in the meat-processing industry including abattoirs. Dairy goat farms with Coxiella burnetii-induced abortion waves were mainly located in the same area where human cases occurred. Airborne transmission of contaminated dust particles from commercial dairy goat farms in densely populated areas has probably caused this epidemic. In 2010, there was a sharp decline in the number of notified cases following the implementation of control measures on dairy goat and sheep farms such as vaccination, hygiene measures and culling of pregnant animals on infected farms. In combination with a rise in the human population with antibodies against C. burnetii, these have most likely ended the outbreak. Development of chronic Q fever in infected patients remains an important problem for years to come.
Introduction
Q fever is a zoonosis caused by the intracellular bacterium Coxiella burnetii with a worldwide occurrence (Raoult et al., 2005). Human infection is caused by transmission from infected animals such as small ruminants (goats, sheep). Animals shed C. burnetii in milk, urine, faeces and birth products (Parker et al., 2006). Infection is reported to be asymptomatic in 60% of cases. Among the persons with clinical symptoms, there is usually an acute onset with fever, headache, fatigue and frequently an atypical pneumonia or hepatitis (Maurin & Raoult, 1999). An estimated 2% of the infected individuals are reported to develop chronic Q fever in the months to years after symptomatic or asymptomatic infection, with endocarditis as the most frequently mentioned presentation (ECDC, 2010). The patients most at risk of developing chronic Q fever are thought to be those with cardiac or vascular grafts, pregnant women and patients with immune deficiencies (Parker et al., 2006). However, these estimates are based on few original studies.
The Netherlands is a densely populated country (491 inhabitants per km2 in 2010). Population densities of humans and animals are high in the south of the country where intense animal farming is practised. According to figures from Statistics Netherlands (http://statline.cbs.nl/statweb/) for 2007, the province of Noord-Brabant has particularly high densities of poultry (5042 animals per km2), swine (1009 animals per km2), cattle (125 animals per km2), goats (23 animals per km2) and sheep (20 animals per km2). Dairy goat farming became more popular when the European milk quota system for dairy cattle was introduced in 1984 (Roest et al., 2011a). The total number of goats in the Netherlands increased from 7375 in 1990 to 21 008 in 2000 to 324 014 in 2007 (Statistics Netherlands, http://statline.cbs.nl/statweb/). Acute Q fever has been a notifiable disease in the Netherlands since 1975. However, until 2007, only 10–20 Q fever cases were notified annually. Moreover, a retrospective serological survey showed that the prevalence of IgG antibodies to C. burnetii in the general population measured just before the epidemic in 2007 was estimated to be 2.4%, a relatively low figure in the European context (Schimmer et al., 2011).
In the period from March to June 2007, six cases of acute Q fever were notified by the regional microbiology laboratories to the public health authorities in the province of Noord-Brabant. All of these patients had been admitted with atypical pneumonia — high fever, shortness of breath, headache and dizziness. Owing to concern about the increase in numbers, these were analysed in detail but could not be epidemiologically linked. Subsequently, a general practitioner from a rural village reported an increase in pneumonia cases among his patient population. The majority of these patients, who were first mistaken for Mycoplasma pneumonia cases owing to serologic cross-reactions, were confirmed as acute Q fever cases in July 2007. Subsequently, more Q fever notifications followed. This first reported Q fever outbreak in the Netherlands in 2007 was described by Van Steenbergen et al. (2007) and later investigated by Karagiannis et al. (2009). In the years thereafter until 2010, the south-east of the Netherlands experienced large outbreaks of Q fever, with a total of more than 3000 notified cases.
To fill in the many knowledge gaps with regard to this Q fever outbreaks, an extensive and still ongoing interdisciplinary research agenda was started, initially focusing on elucidating sources and transmission routes of these outbreaks and later also covering other fields such as host–pathogen characteristics, chronic Q fever and treatment for post-Q fever fatigue. In this paper, we describe the characteristics of this zoonotic epidemic with emphasis on the clinical and epidemiological characteristics of notified acute Q fever patients and the association with veterinary factors. Complementary to Delsing et al. (2010) who reviewed the literature on the epidemiology and clinical presentation of Q fever in the Netherlands and Roest et al. (2011a) who gave a literature overview of the history, emergence and control of Q fever in the Netherlands, we performed an analysis based on the original individual patient data. We combined these data with laboratory data and veterinary data.
Methods
Human notifications
In the Netherlands, the attending physician and the head of the microbiology laboratory are legally obliged to notify any human Q fever diagnosis to the local municipal health service. On a daily basis, the municipal health service enters the cases into an anonymous national electronic database (Osiris) which is monitored by the Centre for Infectious Disease Control. Notification criteria for acute Q fever in Osiris are a clinical presentation matching Q fever, combined with a fourfold IgG titre rise or more, measured by indirect immunofluorescence assay (IFA), ELISA or complement fixation test (CFT), or a positive IgM phase II antibody test. In July 2008, a clinical presentation matching acute Q fever was further defined by at least fever, pneumonia or hepatitis. In February 2010, detection by polymerase chain reaction (PCR) of C. burnetii DNA in compartments of blood or respiratory material was officially added as a laboratory criterion, although Q fever notifications based on a PCR diagnosis were already accepted from the beginning of the epidemic in 2007. Notification data included demographic details such as age, sex, place of residence, date of onset of illness, hospitalization (yes/no), laboratory test used for diagnosis and limited epidemiological data.
Examining questionnaires
The municipal health service is also responsible for the detection of the source of outbreaks. For this Q fever epidemic, they used a specially developed questionnaire. In 2007 and 2008, it was administered to patients, either in person, by telephone or by mail around the country. It contained questions about symptoms, smoking behaviour, clinical presentation, underlying diseases and potential risk factors such as contact with animals and animal products.
Laboratory data
Laboratory data were extracted from Osiris, from the examining questionnaires and from the regional medical microbiology laboratory at the Jeroen Bosch hospital, which performed a major part of the Q fever diagnostics in the high-incidence area.
Veterinary data
Veterinary data from 2005 through 2010 on the number and locations of small ruminant farms in which abortion waves (> 5% abortions) were reported were obtained from the Animal Health Service. These abortion waves were confirmed to be caused by C. burnetii through immunohistochemical tests on at least one placenta per farm as described by Wouda & Dercksen (2007). In October 2009, a nationwide mandatory bulk tank milk monitoring system was introduced for dairy goat and dairy sheep farms with 50 animals or more.
Data analysis
We included notified confirmed Q fever patients with a date of onset of illness between 1 January 2007 and 8 December 2009 in our analysis.
When the date of onset of illness was unknown, the date of laboratory diagnosis minus the median number of days between the date of onset of illness and the date of laboratory diagnosis in that particular year was used instead. Data were retrieved from Osiris and from the additional questionnaire (as far as available). The rates of exposure to environmental factors were compared to (i) general population figures available from Statistics Netherlands, (ii) figures reported in the international literature and (iii) data from a self-completed questionnaire on a national control group that was recruited by the Centre for Infectious Disease Control from the general population on a continuous basis for use in analytical studies on gastrointestinal and zoonotic outbreaks. For this last-mentioned comparison, control persons were included in the analysis if aged between 10–90 years and were recruited from 2007 through 2009. In the epidemic curve, we included all confirmed cases notified between 1 January 2007 and 31 December 2010. Statistical analysis was performed using spss version 18. All analyses were stratified by year of onset of illness. We used the chi-square test to compare proportions and the one-way anova to compare continuous variables. A P-value < 0.05 was considered as statistically significant.
Results
General description of the epidemic
A total of 3264 Q fever patients with a date of onset of illness between 2007 and 2009 (who met the inclusion criteria) were notified. One hundred and ninety-three cases reported a date of onset of illness during 2007, 929 in 2008 and 2142 in 2009. The epidemic curve shows a seasonal pattern, with most cases having a date of onset of illness in spring and early summer (Fig. 1). The highest incidences were seen in the south of the country, mainly in the province of Noord-Brabant (Fig. 2). The epidemic area expanded gradually to the north and the south. Median age of the confirmed notified patients varied from 52 years in 2007 to 49 years in 2009 (Table 1). Over 60% of patients were men. There was no significant difference in the age distribution of male and female patients. There was an increase in number of cases in Noord-Brabant during each consecutive year, as well as in other provinces in the south of the Netherlands. The province of Noord-Brabant remained the most affected province in the Netherlands, but with increasing numbers in the provinces of Gelderland, Limburg and Utrecht in 2009 owing to clusters. There was a considerable delay between the date of onset of illness and the date of notification, and this was most pronounced in 2007. The median diagnostic delay, i.e. the delay between the date of onset of illness and the date of diagnosing C. burnetii infection, decreased significantly from 81 days in 2007, to 28 in 2008, to 21 days in 2009.

Number of notified acute Q fever patients in the Netherlands by week of onset of illness and week of notification (left axis) and number of small ruminant farms with abortion waves confirmed as Coxiella burnetii positive by week of reporting (right axis), 1 January 2007–31 December 2010. Since June 2008, notification of an abortion rate > 5% on large dairy goat and sheep farms has been mandatory. Two abortion waves were reported in 2005 and seven in 2006 (data not shown).
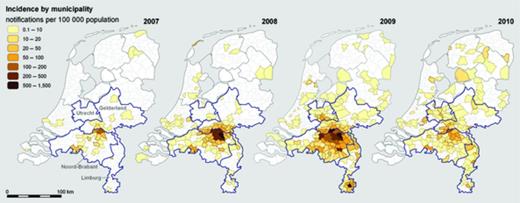
Incidence of notified Q fever patients by municipality in 2007, 2008, 2009 and 2010.
Characteristics of notified Q fever patients by year of onset of illness (2007–2009)
IQR, inter quartile range.
Information missing from two cases.
Information missing from nine cases.
Information missing from 11 cases.
Characteristics of notified Q fever patients by year of onset of illness (2007–2009)
IQR, inter quartile range.
Information missing from two cases.
Information missing from nine cases.
Information missing from 11 cases.
Environmental risk factors
A questionnaire that addressed issues about environmental risk factors and clinical characteristics was returned by 143 of the 193 (74.1%) notified cases with a date of onset of illness in 2007 and from 866 of 929 (93.2%) notified cases with a date of onset of illness in 2008. For patients who did not return a questionnaire, less detailed information was available from the notifications. Occupational exposure cannot solely explain the epidemic of human cases, as very few patients reported that they were living on a farm or working in the agriculture or meat-processing sectors (Table 2). However, the percentage of patients working in the agriculture sector (3.2%) and meat-processing industry including abattoirs (0.5%) was higher than in the general population in 2009 (0.7% and 0.1%, respectively) and in the population control group (Table 2). Notified patients frequently reported contact with different animal species and animal products, although this was also the case for the population control group. As many as 8.3% of the patients could have been infected abroad according to the municipal health service. This figure is comparable with the 8–9% of the population on average who travelled abroad in each 4-week period, calculated on the basis of data from Statistics Netherlands.
Risk factors reported by notified Q fever patients with onset of illness in 2007–2009, compared to a group of population control persons
n.a., Not available or not applicable.
Selected controls (N = 599) for analysis were 10–90 years old, median age was 56 years (inter quartile range 24) and they were from all regions of the Netherlands (71 were living in the province of Noord-Brabant).
Data only available for 2008 patients.
Including leather and felt industry.
Arable farming, stockbreeding and dairy farming combined.
Data only available for 2007 and 2008 patients.
Poultry, dogs, horses, exotic animals.
Data only available for 2008 and 2009 patients.
Data only available for 2007 patients.
Clinical characteristics
In 2007, the percentage of patients who were hospitalized for Q fever was more than twice as high as in 2008 and 2009 (Table 1). In a previous study, we showed that in high-incidence areas, diagnosis of and treatment for Q fever was faster, with a lower proportion of patients admitted to hospital than in low incidence areas (van der Hoek et al., 2010). Each year, the hospitalization rates were slightly higher in male (22.2% overall) than in female patients (overall 20.5%), although these differences were not significant. The median age of hospitalized patients was higher than the median age of patients not hospitalized (55 vs. 48 years, P < 0.001). Fever was the most frequently reported symptom of Q fever (92.5%), followed by fatigue (77.5%) and headache (68.9%) (Table 3). The frequencies of reported symptoms were similar to those reported in the international literature. Pneumonia was the diagnosis made most frequently during the illness (61.5%). Endocarditis (3.1%) and hepatitis (< 1%) were relatively rare. Underlying diseases were reported frequently. Almost half of the patients were smokers, while the national percentage of the population who smoked in 2009 was only 27.1, varying by age and sex from 10.1% for men 12–18 years to 44.3% for men 25–34 years. In the population control group, only 20.4% were smokers.
Clinical presentation of Q fever and underlying diseases/factors of notified patients with onset of illness in 2007–2009, compared to a group of Dutch population control persons. Symptoms are also compared to figures reported in the international literature (Maurin & Raoult, 1999)
n.a., Not available or not applicable.
Data only available for 2007 and 2008 patients.
Sweats in general.
Nausea.
Data only available for 2008 patients.
Denominator = female patients.
[Correction added after online publication 30 November 2011: figures in column 4 were aligned incorrectly]
Laboratory results
Basic data about laboratory methods used were available for nearly all notified Q fever patients, i.e. whether the diagnosis was made serologically or by the detection of DNA of the pathogen using a PCR. Information on the exact laboratory test used was available for 56 patients (29%) in 2007, 897 (97%) in 2008 and 2093 (98%) in 2009. In 2007, all notified patients were diagnosed serologically. In 2007, all patients for whom additional laboratory data were available were diagnosed with IFA. In 2008, a small number (4%) of patients were diagnosed with PCR. In 2008, the most popular serological method was IFA (74.8%), although CFT and ELISA were also used. In 2009, 77.5% of notified patients were diagnosed serologically and 20.5% by PCR. IFA was used in more than half of the cases in 2009; CFT was used in more than a quarter of cases and ELISA in 14% of cases. In 2010, the identification of new cases was less accurate because of high background seroprevalence, with high levels of IgM antibodies following an acute infection, combined with an aspecific clinical presentation and declining incidence.
Veterinary results
In the period from 2005 through 2009, abortion waves confirmed as C. burnetii positive were reported on 28 dairy goat farms and 2 dairy sheep farms. In 2010, no such abortion waves were reported. All but one of these farms were reported in the months February through September (Fig. 1). The dairy goat farms had an average of 1164 goats and herd abortion rates up to 60%. The farms with abortion waves were mainly located in the same area where human cases occurred (Figs 2 and 3). The two dairy sheep farms that experienced clinical Q fever problems in 2006 and 2008, one in the southern part and one in the northern part of the country, had an average of 400 sheep and an average abortion rate of 5% and do not appear to be related to human cases. From October 2009 through July 2010, a total of 90 dairy goat farms and 2 dairy sheep farms were declared positive for C. burnetii in the bulk tank milk monitoring, including 15 farms that previously experienced Q fever-induced abortion problems. After public discussion, the exact locations of bulk tank milk-positive farms were first announced on the website of the Food and Consumer Product Safety Authority in December 2009. All households living within 5 km radius of a bulk tank milk-positive farm were informed in writing about the presence of an infected farm in their vicinity. This was on the basis of an epidemiological study in 2008 that showed that people living close (< 2 km) to an infected dairy goat farm had a much higher risk of clinical Q fever than people living further away (> 5 km) (Schimmer et al., 2010). Starting in the summer of 2008 until 2010, a gradually increasing number of control measures was implemented on dairy goat and sheep farms such as vaccination, hygiene measures and mass culling of pregnant animals on bulk tank milk-positive farms. More information on the dairy goat industry in the Netherlands, the prevalence of Q fever in small ruminants and the response in the veterinary field can be found in Roest et al. (2011a).
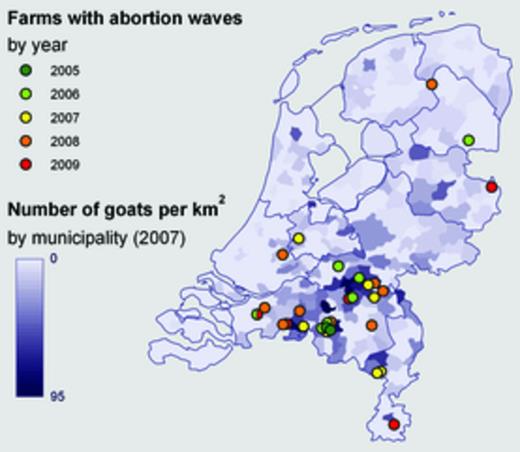
Locations of dairy goat farms (n = 27, including one farm infected twice) and dairy sheep farms (n = 2) with reported abortion waves caused by Coxiella burnetii, 2005–2010 (source: Animal Health Service). Since June 2008, notification of an abortion rate > 5% on large dairy goat and sheep farms has been mandatory.
Discussion
This is the largest Q fever epidemic recorded to date, in a densely populated area where intense farming is practised. Q fever epidemics, albeit on a smaller-scale or in longer time frame, have been recorded before in various countries worldwide, including Australia, Bulgaria, France, Germany and the United Kingdom. Moreover, Q fever seems to be increasingly reported, for instance in France, Germany and the USA (Gilsdorf et al., 2008; Kersh et al., 2010; Frankel et al., 2011). The Dutch seasonal epidemic started in 2007 in the south of the Netherlands with peak incidences between April and August. Before 2007, Q fever was rarely reported in the Netherlands, and a serological survey has confirmed that seroprevalence was low just before the epidemic in 2007 (Schimmer et al., 2011). In contrast, during the epidemic, seroprevalence rates of over 20% were reached in at least one area (Karagiannis et al., 2009). The epidemic showed a marked seasonality and was expanding both geographically and in size year on year. The patients most affected were men, smokers and persons aged 40–60 years, while children were rarely affected. The observation that dairy goat farms with abortion waves were mainly located in the same area where human cases occurred, provided circumstantial evidence that dairy goat farms are the most plausible source of human infection in this epidemic. Remarkably, no clear relation with occupational factors was found. Prevalence of antibodies against C. burnetii is very high among goat and sheep farmers and veterinarians. However, very few of the Q fever notifications are from these groups, suggesting that the antibodies are protective against symptomatic Q fever and that the burden of symptomatic disease is low in the long-term occupational exposed. Fortunately, in 2010, after three consecutive years of Q fever epidemics, the expected seasonal peak in the number of acute Q fever notifications did not appear, although the number of cases remained higher than in 2007. The implementation of a set of measures on sheep and goat farms in combination with a rise in the protection of the human population as a consequence of infection with C. burnetii has most likely ended the outbreak. However, as a consequence of the large number of acute Q fever cases in earlier years, a considerable number of cases of chronic Q fever and long-term effects can still be expected.
The size and duration of the epidemic in the Netherlands is unique in the world. The national notification system for infectious diseases with enhanced surveillance, using examining questionnaires to collect data from Q fever patients, provided better insight into the characteristics and clinical factors of a large number of patients. However, there is no provision for comparison with a control group in such a surveillance system, making it impossible to perform a valid risk factor analysis. As an alternative, we compared some of the patients' characteristics to a group of population control persons and to national figures of Statistics Netherlands. However, these cannot be seen as formal control groups of the notified Q fever patients. For example, the importance of contact with animals and animal products remains unclear. Nevertheless, comparison of patients' characteristics with population data did mark the high percentage of smokers among Q fever patients. This finding is in agreement with the results of the case–control study of Karagiannis et al. (2009). Possible explanations for smoking as a risk factor for acquiring Q fever are exposure to outdoor contaminated aerosols because of outdoor smoking habits, hand–mouth transmission or an increased risk of respiratory infections in general because of alternations in structural and immune defences.
In 2007, there was a considerable diagnostic delay owing to the lack of awareness by medical staff and the delay in making a definitive diagnosis, as routine diagnostics mainly relied on seroconversion in convalescent serum. The delay was also caused by active case finding in a retrospective survey among hospitalized pneumonia patients in the high-incidence area. The diagnostic delay decreased because of increased awareness and improved laboratory services, such as the introduction of IFA, ELISA and PCR. In addition, the positive predictive value of the tests was also very high owing to the high incidence during the Q fever epidemic. In the autumn of 2009, influenza A(H1N1) 2009 with comparable aspecific febrile symptoms coincided with the Q fever epidemic. In this third year of the Q fever epidemic, high background levels of serologic Q fever, specifically persisting positive IgM titres, were common in most of the affected areas. These two developments made it much more difficult to pinpoint the exact moment of an acute Q fever episode, thus making notifications less reliable. Patients diagnosed in the laboratory in 2010 may therefore have experienced clinical signs of acute Q fever earlier. In these circumstances, the persistence of IgM makes it difficult to measure the actual decline of the incidence of the disease. Furthermore, Q fever testing behaviour of general practitioners and patients was also influenced by a national information campaign, increased media attention owing to mass culling of goats and the publication of the addresses of Q fever-affected farms.
The frequencies of reported symptoms are similar to those reported in the international literature (Maurin & Raoult, 1999). Hospitalization rates were as high as 46% in 2007 and 20% in 2008 and 2009. The high hospitalization rate in 2007 was influenced by active case finding in a retrospective survey among hospitalized pneumonia patients in the high-incidence area. However, the hospitalization percentages in 2008 and 2009 (corresponding to 8% of all infected individuals given a symptomatic/asymptomatic rate of 40/60%) are still much higher than the 2–5% hospitalized reported in the literature (Maurin & Raoult, 1999; Raoult et al., 2005). The causes of the high hospitalization rate in the Netherlands are not yet clear, so we are currently analysing this further.
Although the epidemic was linked to goat farming at an early stage, a causal relationship was difficult to prove because of limited success in obtaining human material suitable for genotyping. The extent and course of the first seasonal outbreak in 2007 was not very different from isolated outbreaks that have been reported from other European countries, and therefore, no specific control measures were taken. The much larger 2008 outbreak was unexpected and was difficult to control, and the subsequent expansion was unforeseen. National and regional public health authorities were largely unprepared for an epidemic of this scale. Unfortunately, it is still not clear which (combination of) factors caused this unexpected expanding epidemic. The epidemic occurred in an area densely populated with people and domesticated animals which is known for an exponential increase in number of goats in the previous years, suggesting that animal farming in such areas poses a risk of zoonotic diseases such as Q fever in humans. In retrospect, abortion waves owing to C. burnetii infection among the goat population were reported from 2005 onwards, although they were not recognized as such at that time. It is hypothesized that rats might have played a role in the spread of C. burnetii. The presence of actively infected rats outside the lambing season and at multiple environmental settings including urban locations was demonstrated by Reusken et al. (2011). The authors state that this might suggest that rats are not merely a spill-over host owing to infection by a contaminated environment but might represent true reservoirs, capable of independent maintenance of C. burnetii infection cycles and thereby contributing to spread and transmission of the pathogen. Ticks are another possible reservoir for C. burnetii. However, Sprong et al. (2011) showed that C. burnetii could not be found in practically all 1891 questing Ixodes ricinus ticks and 1086 ticks feeding on pets, wildlife and livestock tested, so that ticks probably do not play a role in the spread of C. burnetii. There were no indications that human-to-human transmission played a role in this epidemic. Only very few patients were known to be part of a household cluster, and for these, common environmental exposure was more likely than human-to-human transmission. In the high-incidence area, 3 of 1004 blood donations in 2009 contained C. burnetii DNA (Hogema et al., 2011). One recipient was positive for IgG antibodies to C. burnetii, 10 months after transfusion. However, as this recipient lived in the high-incidence area, no final conclusion can be drawn. It is unclear whether bacterial virulence factors have contributed to this epidemic as culture facilities for C. burnetii were not available at the national level at the time. Also, genotyping the C. burnetii strains in the Netherlands has been problematic for lack of human material in the early stages of the epidemic, when diagnosis was generally delayed and based on serology. Veterinary isolates show a predominant genotype in goat herds in multilocus variable-number tandem-repeat analysis (MLVA) (Roest et al., 2011b). This MLVA genotype was also found in human samples (Klaassen et al., 2009). With a single-nucleotide-polymorphism genotyping assay, at least five different C. burnetii genotypes were identified in human and animal samples (Huijsmans et al., 2011).
Pregnant women have been identified as at risk of obstetrical complications because of C. burnetii infection (Maurin & Raoult, 1999; Raoult et al., 2002; Carcopino et al., 2009). Although the number of pregnant women among the Q fever notifications in the 2007–2009 epidemic in the Netherlands was low, the actual number of infected pregnant women could be much higher, because of a higher proportion of asymptomatic infections during pregnancy (Tissot-Dupont et al., 2007). However, the effect of preventive measures, screening and treatment are currently under debate. Preliminary data did not show a marked deleterious effect on the outcome of pregnancies (van der Hoek et al., 2011). A study entitled ‘cost-effectiveness of a screening strategy for Q fever among pregnant women in risk areas: a clustered randomized controlled trial’ aims to provide more conclusive information on the risks of pregnant women (Munster et al., 2010). Patients with pathology of cardiac valves and vascular aneurysms are at risk of developing chronic Q fever. Based on presently accumulated laboratory data, a reassessment of screening strategies to identify and classify cases at risk is justified. Although a human vaccine for Q fever is available, it is not registered outside of Australia and a serological and skin test is mandatory before a person can be vaccinated, making logistical arrangements more complex. However, in 2010, the Health Council of the Netherlands recommended vaccination of risk groups with specific cardiac valve and vascular disorders (Health Council of the Netherlands, 2010). Vaccination of these risk groups was implemented from January to June 2011, and a total of 1366 patients received the vaccine.
Important outstanding issues include the role of virulence factors of C. burnetii in causing outbreaks, the effect of Q fever on certain risk groups such as pregnant women and patients with cardiac valve and vascular disease, and the most effective antibiotic treatment for acute Q fever and chronic Q fever. Furthermore, the relative contribution of the various veterinary measures that were taken to control this epidemic remains uncertain.
Acknowledgements
We would like to thank Ben Bom (Expertise Centre for Methodology and Information Services of the National Institute for Public Health and the Environment) for the maps; Marianne van der Sande (Centre for Infectious Disease Control of the National Institute for Public Health and the Environment) for her useful comments on the paper; Ingrid Friesema (Centre for Infectious Disease Control of the National Institute for Public Health and the Environment) for providing the data of the national control group; all notified patients for providing information; the municipal health services for reporting data about the notifiable patients; and all contributing medical microbiology laboratories.
References
Author notes
Editor: Gilbert Greub
