


Abstract
Habitat type is a strong determinant of microbial composition. Habitat interfaces, such as the boundary between aquatic and terrestrial systems, present unique combinations of abiotic factors for microorganisms to contend with. Aside from the spillover of certain harmful microorganisms from agricultural soils into water (e.g. fecal coliform bacteria), we know little about the extent of soil-water habitat switching across microbial taxa. In this study, we developed a proof-of-concept system to facilitate the capture of putatively generalist microorganisms that can colonize and persist in both soil and river water. We aimed to examine the phylogenetic breadth of putative habitat switchers and how this varies across different source environments. Microbial composition was primarily driven by recipient environment type, with the strongest phylogenetic signal seen at the order level for river water colonizers. We also identified more microorganisms colonizing river water when soil was collected from a habitat interface (i.e. soil at the side of an intermittently flooded river, compared to soil collected further from water sources), suggesting that environmental interfaces could be important reservoirs of microbial habitat generalists. Continued development of experimental systems that actively capture microorganisms that thrive in divergent habitats could serve as a powerful tool for identifying and assessing the ecological distribution of microbial generalists.
Introduction
Microorganisms are found in almost every environment that we can access on Earth, but individual taxa differ widely in their ubiquity. While some can grow across a broad environmental range, many are restricted to relatively narrow niche space (i.e. habitat generalists and specialists, respectively) (Barberán et al. 2014). In some cases, microbial biogeography may be limited by environmental opportunity, as microorganisms are less likely to be well-adapted to conditions they have not been exposed to. For instance, a lineage that is endemic to isolated cave sediments may have never had the opportunity to colonize a human gut; whether it would develop this ability given the opportunity would then depend on its specific suite of traits. Similarly, there is evidence that the ability to biodegrade plastics among microorganisms is increasing as this opportunity becomes more widespread in the environment (Zrimec et al. 2021). Due to their direct relevance to public health, certain disease-causing microorganisms are well-known for likely habitat switching between animals and humans (e.g. E.coli (Rwego et al. 2008); SARS-CoV-2 -19 (Cohen 2022)), soils and humans (e.g. Bacillus anthracis (Steffan et al. 2020)), or soil and water (e.g. fecal coliform bacteria (Pachepsky and Shelton 2011)). However, we do not have a general understanding of the frequency or extent of habitat switching among non-pathogenic microorganisms, despite acknowledgement of the forces that shape microbial biogeography (Larkin and Martiny 2017).
Environmental heterogeneity and stability play an important role in shaping the potential habitat range of microorganisms (Hotaling et al. 2019, Bell and Bell 2021, Xu et al. 2022). In spatially or temporally heterogeneous environments, some organisms may undergo niche expansion by developing broadly adapted phenotypes to cope with the range of conditions they encounter. For instance, in frequently perturbed environments, organisms can rely on compensatory adaptations (e.g. copiotrophy; dormancy; phenotypic plasticity (Shoemaker and Lennon 2018, Kurm et al. 2019)) to cope with periods of abiotic or biotic stress. Alternatively, microorganisms may respond to environmental heterogeneity by confining themselves to a narrow portion of their fundamental niche and increasing their competitive advantage within that space (e.g. oligotrophy; antibiotic compound production), particularly when conditions remain stable (Barrett et al. 2005, Hibbing et al. 2010, Stone et al. 2023). The costs associated with generalist and specialist lifestyles have long been debated, with some finding generalism to be linked with higher metabolic burden (Lipson et al. 2008, Hall et al. 2010) and others finding no clear evidence of fitness or functional trade-offs (Bennett and Lenski 2007). Ultimately, this likely depends on the type of generalism and the traits required to allow microorganisms to function across a broad range of conditions.
There are several practical implications to understanding the factors that promote habitat switching. For instance, repurposing soils for agriculture will inherently reshape the microbial composition and function of those soils but may also have spillover effects on the microbiomes of adjacent land or water (Bell and Tylianakis 2016, Bell and Bell 2021). In addition, identifying taxonomic groups or traits that promote a broad survival range could benefit the development of microbial inoculants, which are notorious for their unpredictable survival across field conditions (Kaminsky et al. 2019). In this study, we developed a proof-of-concept system for capturing putative habitat generalists. Such systems are of interest, because they could be used to 1) clearly identify microorganisms based on observed ecological traits and 2) test the functional capacity of different microbiome subsets post-capture. Here, we used microcosms to interface a non-sterile source (water or soil) with a biotically-cleared recipient environment (soil or water) to capture microorganisms that can colonize and persist between divergent habitat types. We assayed two distinct types of soil: one from a riverbed that is intermittently flooded through the year, though not exposed to water at the time of sampling (representing a natural soil-water interface), and one from a nearby farm that is well above the water level of the river. We hypothesized that: 1) putative habitat switching would be restricted to specific lineages, as we expected traits that allow for habitat switching to be complex and therefore phylogenetically conserved, and 2) we would identify more putative habitat switchers from soil collected at a water-soil interface than soil collected further from the river, as microbiomes conditioned to fluctuating water and soil environments are likely to have undergone niche expansion into both. This proof-of-concept study demonstrates the potential for using active microbial capture systems to move beyond survey-based studies and collect microbiome subsets based on ecologically relevant traits.
Materials and methods
Soil and water collection and processing
On 14 December 2020, river water and two distinct soil samples were collected from Cole Farm, a cultivated land site within the Susquehanna Shale Hills in Pennsylvania containing a sub-catchment of Shaver's Creek. This site was formerly part of the NSF-funded Critical Zone Observatory Network (Li et al. 2018). River water was collected in bleach-sterilized 15 L buckets and the containers were pre-rinsed six times with river water downstream of the final collection site to minimize capture of disturbed sediments. Collected water samples were stored in a cold room at 4°C or frozen at -20°C for short- or long-term use, respectively, and a portion immediately filter-sterilized with 0.2 um cellulose nitrate membranes (Majaneva et al. 2018). Water quality before and after sterilizing was analyzed by the Agricultural Analytical Services Laboratory at Pennsylvania State University (See Supplementary Table 1).
Soils were collected from two locations within the study site to obtain microbiomes historically conditioned to distinct environmental pressures: 1) farm soil: directly from an agriculturally-managed field not susceptible to river flooding (40°38'07.6“N 77°56'38.0”W), and 2) riverbed soil: from un-managed river-adjacent sediments (40°38'00.6“N 77°56'29.4”W), where intermittent flooding was apparent from soil compaction and vegetation patterns. Each soil was homogenized and divided into batches of “natural” (non-sterile) or biotically-cleared soil (further referred to as sterilized soil). Natural field soils from each collection site were immediately frozen until experimental setup to preserve their microbiomes. To standardize comparisons of microbial colonization between two different soil types, soils from each location intended for sterilization were sieved through a 12 mm wire mesh to minimize rocks and soil aggregates that could generate spurious noise in colonization between replicates. They were then autoclaved three individual times (3 x 60 min @ 121ºC) with 24 h between each cycle (Howard et al. 2017, King et al. 2022). While all soil sterilization methods will alter soil properties to some extent (McNamara et al. 2003) we have found autoclaving to be most effective in removing microorganisms (Trexler and Bell 2019, Kaminsky et al. 2021, Yates et al. 2022). While no sterilized version of water or soil can fully replicate the original environment, our goal was to assess microbial movement into complex soil and water analogues in the absence of biotic pressures. Soils before and after sterilizing were analyzed for nutrient concentrations and particle size by the Agricultural Analytical Services Laboratory at Pennsylvania State University (Supplementary Table 2 & 3).
Microcosm development
Examples of fully constructed microcosms are provided in Fig. 1, along with a visual representation of the full experimental design. To evaluate microbial movement between divergent habitats, we designed our microcosms to interface soil and water using 565 ml Microbox containers with filter membrane lids that allow sterile gas exchange (Sac O2 company, Deinze, Belgium, catalogue: O118/80 + OD118). Microcosms were filled partially with 450 ml of river water, leaving an air buffer between the meniscus and lid. Soil was aliquoted (200 ml) and encased in sterile nylon stockings, to allow microbial movement across the barrier while maintaining a soil-water interface within the microcosm. Nylon stockings were sterilized by immersing in absolute ethanol for 20 min followed by a 20 min UV-sterilization and drying in a biological safety cabinet prior to use. Control treatments included soil-only and water-only microcosms, which were constructed as either a unit containing a nylon stocking filled with soil (200 ml) or containing 450 ml of river water, respectively. All soil-only microcosms were normalized to 70% water holding capacity prior to setup, estimated by measuring the volume of water needed to saturate each soil type and back-calculating the volume needed to perform the adjustment.

Overall concept diagram of treatments at each experiment phase. At the initial colonization phase, experimental microcosms interfaced a natural source microbiome with a sterilized divergent recipient environment type and were incubated for three weeks. Arrows indicate the direction of colonization. At the end of the initial colonization phase, a standard portion of the recipient was used to inoculate a secondary sterile recipient environment of the same type. Secondary transfer phase microcosms were incubated for three weeks. (A) Fully constructed water-soil microcosm. (B) Fully constructed soil-only microcosm. (C) Fully constructed water-only microcosm.
Microcosm experiment setup—Initial colonization phase
One of our goals was to assess this microcosm design as a means to reproducibly capture microorganisms that can colonize and persist between divergent habitats. Experimental treatments are described throughout this paper as a source microbiome colonizing a sterile recipient environment. Treatments consisted of: 1) source farm soil to recipient river water, 2) source riverbed soil to recipient river water, 3) source river water to recipient farm soil, and 4) source river water to recipient riverbed soil. Our baseline controls include both a natural and sterile version of soil-only and water-only treatments, which are defined further in the next section. All treatments and controls were replicated six times yielding 60 microcosms (and a total of 120 microcosms in the full experiment). Microcosms were randomized on a bench and incubated at a constant room temperature (24°C) until harvest. The initial colonization phase of our experiment includes the day of microcosm setup (19 December 2020) to the end of the 31-day incubation period (19 January 2021). Our chosen timeframe has previously been shown to be sufficient for observing microbial recolonization of sterile soil in prior experiments (King et al. 2022).
Microcosm experiment setup—Secondary transfer phase
Because there is a high degree of microbial dormancy and varying abundances of relic DNA across habitats (e.g. up to 99% in soils; (Lebaron et al. 2001, Carini et al. 2016)), we sought to maximize our capture of the active microbial pool by initiating a “secondary transfer phase”. A portion of the colonized recipient at the end of the initial colonization phase was transplanted into a secondary sterile recipient of the same habitat type. For example, a recolonized recipient water in the initial phase would be transferred into another sterile recipient water. The additional transfer would allow putative habitat switchers to recolonize in an environment that is, at least initially, free of dormant cells and relic DNA. Water inoculum at the end of the initial colonization phase was transplanted to recipient sterile river water in a 1:10 dilution (45 ml in 405 ml), whereas a 5% direct transfer of colonized soil (5 g) was transplanted into sterile recipient soil (95 g), as outlined in Trexler and Bell (2019). Constructed microcosms were again randomized on a bench and allowed to incubate for 21 d at room temperature, starting on day of transplant into the secondary sterile recipient (19 January 2021) and ending the day of sample harvest (9 February 2021). All setup and harvest procedures in both initial and secondary transfer phases were completed within 24 h.
Our baseline controls, which were incubated in parallel to experimental treatments, include both a natural and sterilized version of soil-only and water-only treatments. Natural baseline controls serve as a benchmark for comparing colonization dynamics in recipient environments across habitats, while sterile baseline controls were used to identify any regrowth of sterilization-resistant taxa through the timeline of the experiment (sterile baseline control data is presented exclusively in Supplementary Fig. 2). We define a natural baseline control as the regrowth of a natural source environment into its sterilized habitat analogue throughout initial colonization and secondary transfer phases of the experiment (for instance, source river water > recipient river water (Initial colonization phase) > recipient river water (Secondary transfer phase)). This allows us to compare the regrowth dynamics of a natural source microbiome in its recipient analogue, with that of recipients from a divergent habitat source. By also including sterile baseline controls, we can assess the regrowth of bacteria that were not removed during sterilization, though sequencing depth in half of the sterile soil baseline controls was poor and the remainder were compositionally distinct from experimental samples (Table S5 and Fig. S2A & S2B). For sterile water baseline controls, the dominant genera found after regrowth were aquatic microorganisms that have previously been observed to pass through 0.22 um filtration systems (Table S5 and Fig. S2C & S2D). A total of 60 microcosms were constructed at the secondary transfer phase of this experiment. Soil and water used to construct secondary transfer microcosms were sterilized and handled using the same methodology outlined in preparation for the initial colonization phase, and again analyzed for nutrient concentrations and particle size post-sterilization by the Agricultural Analytical Services Laboratory at Pennsylvania State University (Tables S1 & S2).
DNA extraction and amplicon sequencing
All microcosm samples were collected within a UV-sterilized biological safety cabinet. At the end of the initial colonization phase, after sacrificing a portion of water or soil to seed secondary transfer phase microcosms, DNA was extracted using the NucleoSpin 96 Soil DNA extraction kit (Macherey-Nagel; catalogue: 740787.2) directly from soil as per the manufacturer's instructions and from water with the following modifications. Water samples at the end of secondary transfer phase were collected by passing the remaining 405 ml of microcosm water through 0.2 um cellulose nitrate filter membranes, which were then cut in half using sterile scissors to fit into Type A bead tubes. Many water samples from water-soil microcosms at the end of the initial colonization phase were un-filterable due to clogging, so to minimize extraction bias, DNA was extracted from a pellet via centrifugation for all samples at this phase. These methods are detailed (Table S4) and represent data that is presented exclusively in supplementary material. Bacterial composition was characterized with amplicon sequencing of partial 16S rRNA gene fragments (515F and 806R) (Apprill et al. 2015, Parada et al. 2016). Raw data files in FASTQ format were deposited in the NCBI sequence read archive under BioProject number PRJNA798746.
PCR
Bacterial composition was characterized with amplicon sequencing of partial 16S rRNA gene fragments (515F and 806R) (Apprill et al. 2015, Parada et al. 2016). The PCR mix for reactions was as follows: 12 µL of 5Prime HotMasterMix, 1.5 µL of each primer (10 µM), 1.5 µL template DNA and 13.5 µL molecular grade water for a final PCR volume of 30 µL. Bacterial 16S rRNA gene PCR cycling conditions were as follows: 3 min at 94°C, 25 cycles of: 45 sec at 94°C, 60 sec at 50°C, and 90 sec at 72°C, and a final elongation step of 10 min at 72°C. The resulting amplicons were cleaned using Mag-Bind TotalPure NGS magnetic beads (Omega Bio-tek; catalogue: M1378-01). Illumina indexes were added to the cleaned amplicons with the following PCR ingredients: 12.5 µL of Platinum II Hot-Start PCR Master Mix, 2.5 µL of each index (10 µM) and 2.5 µL of sterile water for a final volume of 20 µL. The indexing PCR cycling conditions were as follows: 1 min at 98°C, 8 cycles of: 15 sec at 98°C, 30 sec at 55°C, and 20 sec at 72°C, and a final elongation step of 5 min at 72°C. Indexed amplicons were then normalized using the SequalPrep normalization plate kit (ThermoFisher; catalogue: A1051001), pooled, concentrated with a Savant SpeedVac (Thermo Scientific, Waltham, MA, USA) at 50°C for 3 h, and purified with a gel extraction using the PureLink Quick Gel Extraction Kit (ThermoFisher; catalogue: K210012). The pooled library was sequenced on the Illumina V3 600 cycle MiSeq sequencing platform (2 × 250 bp yielding ∼45 000 pairs of reads per sample) at the Pennsylvania State University Genomics Core Facility (Huck Institutes for the Life Sciences).
Sequence analysis
Raw demultiplexed 16S rRNA gene data were processed using the Quantitative Insights into Microbial Ecology (QIIME 2 version 2021.4) pipeline (Bolyen et al. 2019). Briefly, paired-ended 16S rRNA gene sequences were imported and trimmed, and denoised using DADA2, which also removes chimeric sequences (Callahan et al. 2016). The classify-sklearn qiime feature classifier was used to assign taxonomy against the Silva v.138 database (Quast et al. 2013) at the single nucleotide threshold (amplicon sequencing variants; ASVs). The dataset was further cleaned by removing sequences identified as chloroplasts or mitochondria, and by removing ASVs with less than 48 (0.001%) sequences for the 16S rRNA gene dataset (Bokulich et al. 2013). The cleaned 16S rRNA gene data were then rarefied at 3 670 sequences per sample.
Statistical analysis
Processed sequencing data were imported into the R statistical environment v.4.2.1 (R Core Team 2012) and used to create a Phyloseq object (McMurdie and Holmes 2013). Chao1 species richness and Shannon's index (as a measure of richness and evenness) were used to estimate alpha diversity in recipient environments colonized by divergent sources. Recipient river water colonized by either source riverbed or farm soil, and the two recipient soil types colonized by river water were tested for statistical differences with a Kruskal-Wallis test from the stats package, followed by a Dunnett's post hoc test. To compare bacterial composition between microcosm treatments, a Principal Coordinates Analysis (PCoA) was performed based on Bray-Curtis dissimilarities using the “ordinate()” function in the Phyloseq package. Permutational multivariate analysis of variance (PERMANOVA) using the “adonis2” function from the vegan package (Oksanen et al. 2013) was used to determine the impact of recipient environment type (explanatory variables) on bacterial composition of the colonizer communities (response variable). P values were adjusted using the Bonferroni method (Jafari and Ansari-Pour 2019) correcting for 6 comparisons. To identify taxonomic colonization trends across treatments, the total number of unique ASVs in each recipient environment was quantified and summarized in a 4D Venn diagram. Further, the relative abundance of ASVs at least 80% prevalent across all replicates of experimental water and soil recipients was plotted to determine and visualize the taxonomic classification of core colonizers.
Results and discussion
Understanding the factors that shape the breadth of microbial habitat colonization has been a paramount focus for decades from global (Lozupone and Knight 2007, Nemergut et al. 2011) to local scales (Wu et al. 2019), including how these patterns interface with ecological theory, for example dispersal limitation and functional tradeoffs. It is therefore of interest to improve our ability to predict which taxa are likely to be found in a particular niche, their potential functional contributions under different environmental conditions, and the likelihood of microbial spillover between divergent environments. In this proof-of-concept study, we develop a new system to perform a reciprocal transplant between two natural soil types and river water, to assess community-level patterns in microbial habitat switching. To comprehensively assess the performance of this system for the first time, we focused on higher within-treatment replication and testing of microbial composition at multiple experimental stages, rather than increasing the number of source and recipient environments, which would be a target for future studies. We define putative habitat-switching as a certain taxon being detected in a recipient environment (colonized by a divergent source environment type) at the end of the secondary transfer phase incubation period. Previous work has attempted to categorize microorganisms as specialists or generalists based on the number of habitats they occupy in publicly available sequence data (Monard et al. 2016, Delgado-Baquerizo et al. 2018); however, widespread variation in genomic surveying methodologies and a lack of controlled environmental manipulations have made it difficult to assess under which conditions microbial habitat switching between source and recipient environments is phylogenetically restricted (exclusive to certain microbial lineages) or a broadly acquired ability.
Diversity of putative habitat generalists may be greater along natural habitat interfaces
To explore the impact of soil origin on bacterial colonizer composition in a receiving aquatic environment, we contrasted alpha diversity in the river water recipients colonized by two soils, which were either in direct contact (riverbed soil) or farther away (farm soil) from a natural river. We found higher species richness and evenness in water recipients colonized by a riverbed soil (Shannon diversity; p = 0.003, Chao1; p = 0.002; Fig. 2A), suggesting the capacity for microbial habitat switching could be greater when microorganisms exist at a contextual habitat interface. Along a riverbed, the resident soil microbiome is forced to interact with river water, as it introduces frequent but irregular fluxes in environmental conditions such as aqueous submersion, oxygen gradients, dynamic or transient biodiversity deposits, nutrient economy, etc. Over time, frequent environmental fluctuations may select for more generalist lifestyles due to heterogenous conditions. In support of our data, Evans and Wallenstein (2012) found that microbiomes exposed to a decade of experimentally-intensified precipitation in a grassland soil led to improved moisture adaptation in laboratory microcosms and Porter and Rice (2013) identified differences in nickel tolerance in Rhizobium species along a serpentine soil gradient. Improved community fitness or plasticity is also observed in numerous adaptive laboratory evolution experiments under varying environmental conditions (Dragosits and Mattanovich 2013). In contrast, our chosen farm soil was atop a hill and never subject to interactions with the river water. The historical differences in environmental conditions between our soils could be a factor driving the lower diversity of organisms able to colonize the recipient water when the source was a farm soil.
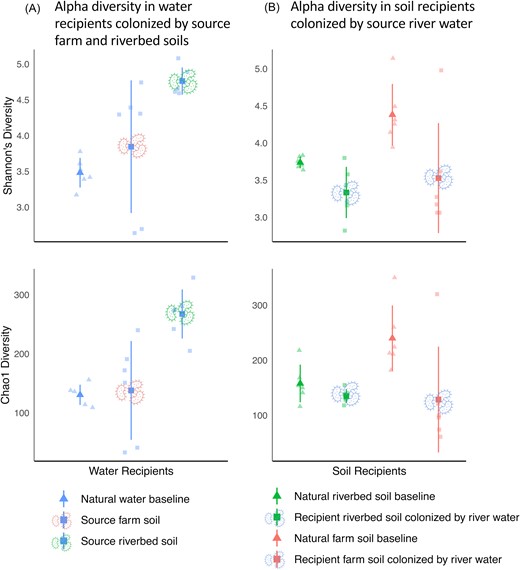
Dot plots of alpha diversity estimated using Shannon's species diversity and chao1 species richness indices in water and soil recipients. Shapes indicate either a natural baseline control (triangles) or recipient community (squares). The color of the dots represents the environment type sampled (red = farm soil, green = riverbed soil, and blue = river water). Colored microbe icons show which source environment was used to colonize the recipient (excluding natural baseline controls, which were colonized by their respective natural source e.g. natural river water colonizing sterilized river water). Larger points show the means of each treatment, while individual replicate microcosms are represented by the smaller points in each figure. Lines represent standard deviation from the treatment mean.
A central goal of this experiment was to assess the extent to which our microcosm approach can be used to capture putative habitat switchers across divergent environments, so we limited our diversity of source material (soil & water) to improve replication potential and validate our microcosm system. As only one type of source river water was assayed, we were not able to compare potentially similar patterns in the opposite direction of colonization (i.e. distinct source water types on a common recipient soil). However, we examined alpha diversity in our divergent soil recipients when colonized by a common source river water and found no significant difference in species diversity or richness (Shannon diversity; P = 0.775, Chao1; P = 0.438; Fig. 2B). River water microbiomes are likely to be more transient than a localized riverbed soil community (Teachey et al. 2019) and therefore may not experience the same degree of environmental conditioning to be able to switch efficiently between the water and various soils they encounter in a stream. As an alternative hypothesis, there is some evidence of greater niche space and phylogenetic diversity being found in sediments compared to soils, thus, the pool of organisms with the potential to colonize water may have been larger in our riverbed soil, leading to higher diversity in colonized water compared to when farm soil was the source (Lozupone and Knight 2007, Thompson et al. 2017). However, we observed relatively similar starting species richness and significant compositional differences between our natural source soil environments, suggesting source diversity was not a confounding factor (Fig. S3).
Recipient environment type structures microbial colonizer communities
We sought to identify compositional overlap between endpoint communities, to examine the strength of environmental filtering when source microbiomes were introduced into recipient environments (Fig. 3; Table 1); (Fig. S1 for comparisons including “intermediate” communities at the end of initial colonization phase. Many microbial traits are conserved at different taxonomic levels based on their complexity (Martiny et al. 2015). For example, pH tolerance, which can require cell membrane modification, and photosynthesis, which involves numerous genes that are deeply conserved, while others can develop rapidly at shallow taxonomic levels, such as viral resistance (Martiny et al. 2013, Martiny et al. 2015). Therefore, we explored the phylogenetic levels at which recipient communities of water or soil were statistically indistinguishable from each other, to explore the potential complexity of traits that allow habitat switching. For source river water colonizing recipient farm or riverbed soils, we identified significant differences between the community composition in recipient soil types up to the Phylum level, which was the broadest taxonomic level that we assessed (Fig. 3A; Table 1). These data suggest that edaphic properties are strong environmental filters for microbial composition (soil property analyses in Table S2) as identified in numerous previous studies (Lauber et al. 2009, Leff et al. 2015, Delgado-Baquerizo et al. 2018), and that there does not appear to be trait conservation. This is further supported by the patterns exhibited by the natural baseline controls, which serve as a reference point for what the community would look like under a self-colonization scenario. The deviation from the natural baseline indicates that the introduced microbes from divergent source environments are responding to and interacting with the novel environment (i.e. environmental filtering). For our two source soils colonizing recipient river water, we identified significant compositional differences at finer taxonomic resolutions (ASV-Family), but not at the Order-Phylum levels (Table 1). These data suggest that the traits required for water colonization, from two disparate soil sources, were conserved roughly at the Order level, with the top three most abundant being Burkholderiales, Rhizobiales, and Micrococcales. Despite the limitations of using phylogeny to identify trait-based conservation along environmental axes (such as microbial habitat breadth), our findings show that microbial transfer between our aquatic-terrestrial environments is not evolutionarily trivial, as it was restricted to specific taxonomic groups. The ecological attributes that enable microbial “habitat switching” (Table S6) are not well-characterized, likely vary across types of environmental transitions, and could consist of multiple traits rather than one alone, therefore, analyses at the community-level using controlled manipulations and differentiating between active and dormant microbial pools is needed to improve our modeling and prediction capability of where we might expect to find microbial taxa across spatial and temporal scales.
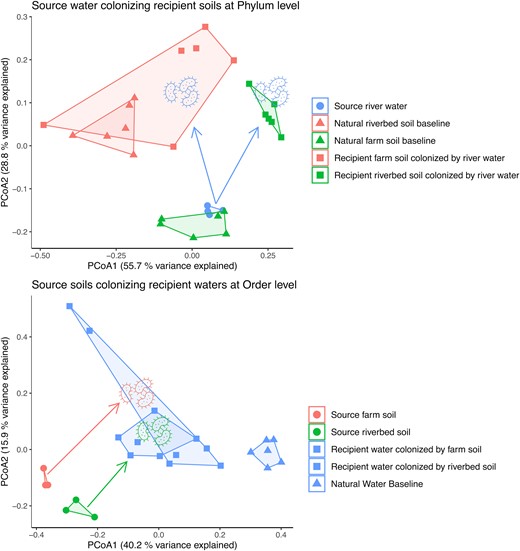
Principal Coordinate Analysis (PCoA) ordinations of bacterial source and recipient community composition. Shown data are Bray-Curtis dissimilarities. Shapes indicate natural baseline control (triangles), source (circles) or recipient (squares) communities. Colors represent the environment type sampled (red = farm soil, green = riverbed soil, and blue = river water). Colored microbe icons show which source environment was used to colonize the recipient (excluding natural baseline controls, which were colonized by their respective natural source e.g. natural river water colonizing sterilized river water). Arrows indicate direction of colonization from source to recipient environments. In summary: A) Source river water colonizing recipient farm and riverbed soils. B) Source riverbed and farm soil colonizing recipient river water.
PERMANOVA of community composition at different taxonomic ranks. (A) Recipient farm vs riverbed soil each colonized by source river water, across taxonomic levels, and (B) recipient river water colonized by either source farm or riverbed soils. Adjusted P values are represented as a q value, while statistical significance is indicated by the * symbol.
| Treatments compared: | Phylum | Class | Order | Family | Genus | ASV |
|---|---|---|---|---|---|---|
| (A) Recipient farm vs riverbed soil each colonized by source river water | R2: 0.44, P = 0.003*, q = 0.018* | R2: 0.38, P = 0.002*, q = 0.012* | R2: 0.39, P = 0.006*, q = 0.036* | R2: 0.37, P = 0.002*, q = 0.012* | R2: 0.35, P = 0.001*, q = 0.006* | R2: 0.32, P = 0.002*, q = 0.012* |
| (B) Recipient river water colonized by source farm vs riverbed soils | R2: 0.14, P = 0.149, q = 0.894 | R2: 0.15, P = 0.075, q = 0.45 | R2: 0.15, P = 0.11, q = 0.660 | R2: 0.23, P = 0.006*, q = 0.036* | R2: 0.26, P = 0.003*, q = 0.018* | R2: 0.29, P = 0.004*, q = 0.024* |
Core microbes were shared across environments
We surveyed taxa that were consistently found across both soil and water recipient environments at the end of the secondary transfer phase as an indicator for microbial habitat switching ability (i.e. growth or persistence in a novel environment). The most dominant taxa across all soil or water recipients being Actinobacter or an unclassified genus in the Comamonadaceae family respectively, (see Figure S4 for top ten most abundant taxa plots). Relative to the total richness of ASVs found in each recipient environment, a mere 18 (< 1%) of them were shared (Fig. 4A). Of those, only two were at least 80% prevalent in replicates of each recipient, an unclassified bacterial species in the Micrococcaceae family (Actinobacteriota) and an unclassified bacterial species assigned to the Devosia genus (Proteobacteria). The Devosia are a motile genus of bacteria widely reported in soil habitats. The Devosia are known for their ability to break down an array of hydrocarbons and have a high degree of genetic promiscuity via horizontal gene transfer (Rivas et al. 2002, Talwar et al. 2020), which would support the potential proclivity toward a generalist lifestyle. However, it represented an extremely low % relative abundance in each sample (Fig. 4B) and may be bacterial persistence rather than adaptation and active growth, despite our efforts to differentiate between these fractions by initiating a secondary transfer phase. While the exact mechanisms that govern bacterial genome size are not comprehensively understood, larger or smaller genome sizes have been associated with generalist or specialist lifestyles respectively (Gweon et al. 2017, Sriswasdi et al. 2017, Bell and Bell 2021). Bacterial and Archaeal genomes can range from 100 kbp to 16 Mbp (Garcia et al. 2014, Rodríguez-Gijón et al. 2022), and genome size has also been found to vary according to habitat type (Beier et al. 2022). While categorizing generalist or specialist lifestyles is not as straightforward as establishing a size threshold, when BLASTing the representative sequences for our two universal ASVs they had estimated genome sizes of 4.5 Mbp (Actinobacteriota; CP066362.1; E-value of 3e−127) and 5.8 Mbp (Devosia; MT239494.1; E-value of 3e−127), aligning with those of other microbial genera broadly linked with generalist life histories, suggesting functional potential for our core microbes to adapt to environmental novelty. For instance, Barberán et al. (2014) found that the ubiquity and habitat breadth of soil dwelling bacteria was positively correlated with genome size.
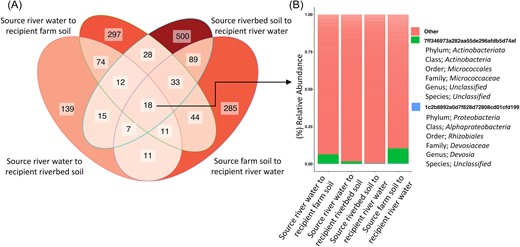
Core microbiome across all water and soil recipients. A) Venn diagram showing the total number of unique ASVs present in at least one replicate of a treatment's recipient environment. B) Relative abundance of unique ASVs at least 80% prevalent across all replicates within a treatment, across all water and soil recipients.
Conclusions
A growing body of work attempts to map microbiome composition to ecosystem functions such as nitrogen fixation or decomposition rates, which can be particularly useful when assessing the health and productivity of managed systems (e.g. agriculture) or predicting ecosystem response under global change conditions (Wang and Xue 2021). But while the relatively low cost of high-throughput sequencing has made it a common tool in estimating microbial presence in natural environments, it remains challenging to predict ecosystem function from this information alone (Morris et al. 2020, Wemheuer et al. 2020).
While our study focuses mainly on microbial presence and observable habitat switching, it lays the foundation for this microcosm approach to be coupled with additional techniques, such as enzyme assays, stable isotope probing (SIP), or multi-omics to enhance our understanding of active microbial communities. These techniques can be specifically tailored to assess the functional attributes of active microbial communities, but they often face challenges due to signals from relic DNA or dormant cells. Our method of active capture has the potential to limit some of these challenges by enriching for active colonizing microbes, and in combination with other techniques, could provide additional insights between microbiome composition, microbial activity, and ecosystem functionality. Further, it could provide a means to cross-validate the results generated by other methods intended to distinguish between active, dormant, and dead cells. Bioorthogonal noncanonical amino acid tagging (BONCAT), for instance, is a cutting edge method that uses translational incorporation of a noncanonical amino acid probe into cellular proteins, followed by azide-alkyne click-chemistry to detect metabolically active bacteria (Couradeau et al. 2019). However, it lacks a reliable benchmark for quantifying microbiome constituents that are not captured by the method (e.g. microorganisms that might be metabolically active but not undergoing protein synthesis or are fundamentally incompatible with the chosen amino acid probe).
Our method provides a potentially scaleable approach to physically capture subsets of a microbiome with an ecological trait of interest, allowing for active microbial pools to be cross compared with other existing methods. Together, this research and future studies can further our understanding of the likelihood that soil microbial composition in one environment could impact function and composition in connected systems. Future studies may also consider including multiple reciprocal inoculations to apply stronger selection for taxa that can consistently switch between and actively grow in divergent source and recipient environments, while further excluding those that persist alone.
Acknowledgements
We thank Brandon Forsythe, who coordinated field sampling efforts with Dr. Herbert Cole, the landowner of this study site. Logistical support was provided by the NSF-supported Susquehanna Shale Hills Critical Zone Observatory. Fig. 1 created with BioRender.com.
Author contributions
SCR and THB designed the experiment, analyzed the data, and wrote the manuscript, incorporating edits and feedback from contributing authors. SCR and WLK set up microcosms, and prepared and submitted samples for sequencing. SCR and JLS generated the microbial prevalence analyses.
Conflicts of interest
We declare no conflicts of interest with this work.
Funding
This work was supported by the United States Department of Agriculture National Institute of Food and Agriculture (Grant no. 2020-67013-30865), under Hatch Appropriations PEN04651 and Accession 1016233.
