


Abstract
Previous studies have shown that it is possible to accurately predict wheat grain quality and yields using microbial indicators. However, it is uncertain what the best timing for sampling is. For optimal usefulness of this modeling approach, microbial indicators from samples taken early in the season should have the best predictive power. Here, we sampled a field every two weeks across a single growing season and measured a wide array of microbial parameters (amplicon sequencing, abundance of N-cycle related functional genes, and microbial carbon usage) to find the moment when the microbial predictive power for wheat grain baking quality is highest. We found that the highest predictive power for wheat grain quality was for microbial data derived from samples taken early in the season (May–June), which coincides roughly with the seedling and tillering growth stages, that are important for wheat N nutrition. Our models based on LASSO regression also highlighted a set of microbial parameters highly coherent with our previous surveys, including alpha- and beta-diversity indices and N-cycle genes. Taken together, our results suggest that measuring microbial parameters early in the wheat growing season could help farmers better predict wheat grain quality.
Introduction
Integrated microbiocentric approaches to optimize plant production are promising and have often been proposed to solve some of the many problems agricultural production faces (Figuerola et al. 2012, Schloter et al. 2018). Soil microorganisms play a key role in many ecosystem processes that are central to agricultural production. For instance, soil microorganisms recycle organic matter, cycle nutrients, abate abiotic stresses, change soil structure and porosity, and promote plant growth (Ortiz and Sansinenea 2022). However, although it is theoretically known how to modify microbial communities (Agoussar and Yergeau 2021), it is in practice still a very daunting task because of the complexity of the communities and their interactions. A first step towards this goal would be to create microbial-based models predicting agricultural processes, to identify clear targets and key functions or taxa to manipulate.
However, soil microbial communities are very dynamic, which makes it difficult to predict process rates and to identify key players that would be amenable to manipulation. Soil microbial communities are strongly influenced by biotic and abiotic factors, such as temperature, precipitations, and plant growth stage, which all vary in time, often in an unpredictable manner. We recently showed that dry-rewetting cycles lead to a complete overhaul of the soil microbial communities, much more than small decreases in soil water content (Wang et al. 2022). Soybean and wheat growth stages were shown to profoundly influence the microbial diversity associated with the plant, often in interaction with plant compartment, plant genotype, soil water content and soil history (Azarbad et al. 2020, Moroenyane et al. 2021, Azarbad et al. 2022). Similarly, the effect of the genotype on root and rhizosphere microbial communities varied over time (years) and with wheat growth stages (Quiza et al. 2022). These microbial shifts related to plant growth stages were previously linked to changes in the composition and concentration of plant root exudates during development (Chaparro et al. 2013). The timing of sampling is thus expected to influence the predictive power microbial parameters, but it is still uncertain what the best sampling time would be and whether robust time-independent indicators could be identified.
Recent microbial-based modeling from our group showed that early sampling of wheat field soil microbial communities, around seeding or emergence could accurately predict wheat yield and grain baking quality obtained at the end of the growing season (Yergeau et al. 2020, Asad et al. 2021). For instance, with as little as 5 predictors, such as the abundance of archaeal ammonia-oxidizers, measured shortly after seeding in May, we were able to predict wheat grain quality with an accuracy of up to 81% (Yergeau et al. 2020). In contrast, different ammonium nitrate fertilization regimes did not significantly influence yields or grain baking quality. In another study encompassing 80 fields across a transect of 500 km, microbial indicators from samples taken in May–June could robustly predict the wheat grain quality and yields at the end of the growing season (Asad et al. 2021). In line with this, earlier work showed that the growth of willows after 100 days in highly contaminated soil could be predicted by the initial soil microbial diversity (Yergeau et al. 2015), whereas willows Zn accumulation after 16 months of growth could be predicted by the relative abundance of specific fungal taxa present at 4 months (Bell et al. 2015). Therefore, it seems that the early soil microbial data can accurately predict ecosystem processes, such as plant productivity and produce quality. However, these studies did not compare microbial data taken at different timepoints, so it is unclear if early sampling has the highest predictive power in microbial-based models.
Here, we sampled the same experimental field every two weeks over the course of a single growing season. We sequenced the bacterial and archaeal 16S rRNA gene and the fungal ITS 1 region, quantified the abundance of key N-cycle genes and measured the community level physiological profiles as microbial indicators and linked them to grain baking quality using LASSO regression. Our goals were to (i) identify the most appropriate sampling date for modelling, and (ii) identify robust microbial indicators linked to grain baking quality.
Methods
Experimental design and sampling
We aimed at collecting samples from a single site for which we knew that the microbial communities varied through time and across treatments. For that purpose, we sampled an ongoing multi-year field experiment on our campus that looked at the effect of rainfall manipulation and wheat genotype on the transmission of the microbiota. We had previously determined that the microbial communities varied through time and across the treatments (Wang et al. 2022). The experiment comprised four rainfall manipulation treatments that were set-up in 2016 at the Armand-Frappier Sante Biotechnologie Centre (Laval, Québec, Canada) using 2 m x 2 m rain-out shelters that excluded passively 0%, 25%, 50%, and 75% of the natural precipitation. The rainfall exclusion treatments were performed using rain-out shelters, which were covered with various amount of transparent plastic sheeting. The rain was intercepted by the plastic sheeting and guided in a gutter and downspout and collected in 20 L buckets that were manually emptied following significant rainfall events. Two wheat genotypes were seeded under these shelters (drought sensitive, Triticum aestivum cv. AC Nass and drought tolerant, Triticum aestivumcv. AC Barrie), and the experiment was replicated over 6 fully randomized blocks, resulting in 48 plots (4 treatments x 2 genotypes x 6 blocks). Seeds harvested from each of the plots were re-seeded in the exact same plot the following year. Soil was sampled every 2 weeks on May 10th (seeding time, T = 0), May 24th, June 7th, June 21st, July 5th, July 19th, and August 1st 2018. A composite soil sample was prepared by collecting 10-cm deep soil cores from the four corners and the centre of each plot (4 treatments x 6 blocks x 2 cultivars x 7 sampling dates = total 336 samples). From 2016 to 2018, the average daily rainfall recorded on this site was 2.2–3.5 mm. Soil water content within rainfall exclusion treatments showed significant differences among soil sampling dates (Wang et al. 2022).
Amplicon sequencing and data analysis
Total genomic DNA was extracted from the 336 soil samples with the DNeasy PowerLyzer Power Soil Kit (Qiagen) following the manufacturer's instructions. The concentration and the quality of the DNA was checked using a Nano Drop ND-1000 Spectrophotometer (Nano Drop Technologies Inc., Thermo Scientific, U.S.A.). The amplicon sequencing libraries for the bacteria and archaeal 16S rRNA gene and ITS regions were prepared according to the previously described protocols (Asad et al. 2021). The primers pairs used for the amplification were 515F (5′-GTGCCAGCMGCCGCGGTAA-3′) and 806R (5′-GGACTACHVGGGTWTCTAAT-3′) (Caporaso et al. 2012) and ITS1F (5′- CTTGGTCATTTAGAGGAAGTAA-3′) and 58A2R (5′-TACGGYTACCTTGTTACGACTTT-3′) (Martin and Rygiewicz 2005), for the bacterial and archaeal 16S rRNA gene and the fungal ITS 1 region, respectively. PCR amplifications were conducted in a T100™ Thermal Cycler (Bio-Rad, U.S.A.) as previously described (Wang et al. 2022). PCR products were confirmed through visualization in 1% agarose gel and purified using AMPure XP beads (Beckman Coulter, Indianapolis, U.S.A.). PCR libraries were pooled together and sent to the Centre d'expertise et de services Genome Québec (Montréal, Canada) for Illumina MiSeq 2×250 bp amplicon sequencing as detailed previously (Wang et al. 2022). A total of 17,084,986 16S rRNA gene reads and 22,411,001 ITS 1 region reads were produced. The raw sequencing data and its meta data were deposited in the NCBI BioProject under accession PRJNA686206.
Sequence pre-processing, including filtering and quality testing, was performed using UCHIME (Edgar et al. 2011), following previously published bioinformatic pipelines (Wang et al. 2022). The classification of Operational Taxonomic Units (OTUs) was performed using the RDP 16S rRNA Reference Database (Wang et al. 2007) and the UNITE ITS Reference Database (Nilsson et al. 2019). The uniformity of the amplicon sequences belonging to the same operational taxonomic units (OTUs) was tested using UPARSE (Edgar. 2013). Sample rarefaction was performed using an in-house galaxy pipeline as previously described (Wang et al. 2022). Alpha (e.g. Shannon, Simpson, Chao1, Abundance-based Coverage Estimators), beta (Bray−Curtis dissimilarity) and phylogenetic diversity were calculated as detailed in Wang et al (2022).
Quantitative real-time PCR (qPCR) and community level physiological profiling (CLPP)
We measured the abundance of the 16S rRNA gene, the ITS 1 region, and N-cycle related genes (bacterial and archaeal amoA, nirK, and nosZ) for the 336 samples using real-time PCR SYBR Green assays, as previously described (Asad et al. 2021). The abundance of N-cycle related gene copies was measured using primers amoA1-f* (5′-GGGGHTTYTACTGGTGGT-3′) and amoA2-r (5′-CCCCTCKGSAAAGCCTTCTTC-3′) (Levy-Booth et al. 2014), the archaeal amoA, using primers crenamoA23-f (5′-ATGGTCTGGCTWAGACG-3′) and crenamoA616-r (5′-GCCATCCATCTGTA-3′) (Tourna et al. 2008), the copper-containing nitrite reductase gene (nirK), using primers 876f (5′- ATYGGCGGVCAYGGCGA-3′) and 1040r (5′-GCCTCGATCAGRTTRTGGTT-3′) (Henry et al. 2006), the nitrous oxide reductase gene (nosZ) using primers nosZ1f (5′-WCSYTGTTCMTCGACAGCCAG-3′) and nosZ1r (5′-ATGTCGATCARCTGVKCRTTYTC-3′) (Henry et al. 2006). The abundance of the 16S rRNA gene and of the ITS 1 region was measured using the same primers as for the amplicon sequencing (described above). The Fungal: Bacterial (F:B) ratio was then calculated by dividing the ITS 1 region abundance by the 16S rRNA gene abundance. Community level physiological profiling (CLPP) was performed using EcoPlates colorimetric assays (Biolog, Hayward, CA) with diluted soil (1/10 in water) and a 168-hour incubation, as previously described (Asad et al. 2021).
Wheat grain and flour quality
Wheat grain was harvested from the 48 plots at the end of the growing season (August 8th, 2018) and the grain and flour baking quality were analyzed in the quality control laboratory of Les Moulins de Soulanges (St-Polycarpe, QC). Four main quality indicators were used in our modeling efforts: grain protein content, grain gluten content, flour peak maximum time (PMT), and flour maximum recorded torque (BEM) (Freund and Kim 2006). PMT and BEM were measured with a GlutoPeak instrument (Brabender, Duisburg, Germany). To do so, the flour sample is mixed with water and stirred at constant speed while the instrument records the torque used to move the mixing paddle. As the gluten network forms, the torque increases until a maximum value, after which it decreases as the gluten network is destroyed by excessive mixing. The time it takes to reach the peak is the PMT (in seconds) and the height of the peak is the BEM (in Brabender Units, an arbitrary unit of viscosity). A good quality grain for bread is expected to have a high protein and gluten content. A good quality flour with strong gluten will have a high peak (high consistency) and a short peak time (rapid to reach maximal consistency) when hydrated.
Statistical analysis
All the statistical analyses were performed in R (v.4.1.2). To visualize the differences in the microbial community (amplicon dataset and CLPP derived from EcoPlates assays) across sampling dates, treatments, and cultivars, we used the function cmdscale of the vegan package (v.2.6–2) (Oksanen et al. 2013) to produce principal coordinate analysis (PCoA) based on the Bray–Curtis dissimilarity index. The effect of sampling date, treatments, block, genotypes on the microbial community structure and carbon utilization patterns was tested using permutational multivariate analysis of variance (PERMANOVA) based on the Bray-Curtis dissimilarity index (adonis2 function of the vegan package, v.2.6–2). Three-way repeated measures analysis of variance (rmANOVA) using the aov function was used to test for significant differences in alpha diversity, N-cycle related genes and ITS 1 region and 16S rRNA gene abundance. The normality of the residuals was examined graphically using ggqplot (ggpubr package v.0.4.0) (Kassambara and Kassambara 2020) and was tested by the Shapiro–Wilk test using the shapiro.test function. If the data did not meet the requirements of the tests, it was log or square root transformed. The homoscedasticity of the data was evaluated using the Mauchly's sphericity test of the rstatix package (v.0.7.0) (Kassambara 2020). Correlation analyses between microbial parameters and wheat grain quality were performed with the cor.test (stats package v.4.2.1) (Worldwide, 2020) function together with the Padjust function to adjust the P-value with the Benjamin–Hochberg correction for multiple tests.
Predictive modeling
Our goal was to model grain quality (protein, gluten, BEM and PMT) using the microbial indicators measured (bacterial and fungal alpha diversity, bacterial and fungal beta-diversity, carbon utilization patterns, F:B ratio, and N-cycle gene abundance), for each sampling date separately to find the optimal sampling date for modeling. Since our PERMANOVAs revealed that the two wheat genotypes harbored significantly different microbial communities, we modeled them separately. This resulted in 14 different microbial data sets containing each 24 samples. We excluded outlier data points using the rstatix package (v.0.7.0).
To reduce the dimensionality of the 16S rRNA gene and ITS 1 region amplicon OTU tables and of the microbial carbon usage, we performed a procedure called orthogonalization. In brief, we performed a principal component analysis (PCA function of the FactomineR package v.2.6) (Husson et al. 2016) on Hellinger-transformed (decostand function of vegan package v. 2.6–2) OTU tables or carbon usage patterns and used the five first principal components in the models. Individual OTUs and carbon substrates were then correlated to these five components to have an idea of the taxonomic composition of the OTUs or carbon substrates influencing each of the components. We kept OTUs and carbon substrates with correlation having a P < 0.05. For the OTUs correlated with the principal components, a taxonomic summary at the genus level was generated using the Phyloseq package (v.1.40.0) (McMurdie and Holmes 2013).
We chose least absolute shrinkage and selection operator (LASSO) regression as a modeling method to predict wheat quality for the following reasons: (i) to avoid overfitting, which may be problematic with other regression methods (least square regression or general linear model), especially when there are many explanatory variables and a few samples, (ii) to be able to select only the most important predictive variables (i.e. feature), to reduce the mean square error of the model, and (iii) to have an interpretable model. Indeed, LASSO regression shrinks the coefficient of the non-significant predictors to zero, keeping only the predictors with significant explanatory power.
The microbial features included: principal components 1–5 derived from the microbial OTU and carbon usage tables, the abundance of N-cycle related gene, the F: B ratio, and the bacterial and fungal alpha-diversity. First, we standardized the data (other than the PCs) using the scale (scales package v.1.2.1) function and then selected the optimal lambda values with 10-fold cross validation using c.v glmnet function of the glmnet package (v.4.1–4) (Friedman et al. 2017). We generated the models with penalty scores based on the lowest lambda value, which indicates non-collinear effects and low levels of inflated variance in the selected variables. The predicted outputs values from these LASSO models were calculated using the predict function of the stats package (v. 4.2.1). The predictive accuracy of the models was then evaluated by calculating R2 and mean squared error values (MSE) between the observed and the predicted values. The Akaike Information Criterion (AIC) and the Bayesian Information Criterion (BIC) were also calculated to evaluate the quality of the models, while taking into account the trade-off between goodness-of-fit and simplicity. Due to the lack of sufficient samples (n = 24) in each model, we could not split the data sets in training and test datasets to further test the models' performance. Finally, we compared the accuracy and performance across the different sampling dates. The R code used for data manipulation, statistical analyses, and predictive modeling is available on GitHub (https://github.com/numanibneasad/Soil_Microbiome) whereas the data used for the analyses is available on Zenodo (https://doi.org/10.5281/zenodo.7293949)
Results
Effect of experimental treatments on microbial parameters
The sampling date significantly affected all microbial parameters, including microbial carbon utilization, microbial alpha and beta diversity, the F: B ratio, and the abundance of N-cycle-related genes (Tables 1 and 2). Furthermore, the structure of the fungal community was influenced by wheat genotypes (Table 1). There was a significant interactive effect (P < 0.05) of the precipitation treatment and wheat genotype on the abundance of the archaeal amoA, nirK, and nosZ genes (Table 2).
Permanova based on Bray–Curtis dissimilarities for microbial carbon utilization profiling (Biolog EcoPlate) and community structure based on 16S rRNA gene and ITS 1 region amplicon for the effect of precipitation exclusion treatments, sampling dates, and genotype.
| Biolog | 16S | ITS | |||||||
|---|---|---|---|---|---|---|---|---|---|
| R2 | F | P | R2 | F | P | R2 | F | P | |
| treatment | 0.013 | 4.95 | 0.002** | 0.003 | 0.95 | 0.419 | 0.004 | 1.45 | 0.086 |
| date | 0.105 | 39.71 | 0.001*** | 0.01 | 5.06 | 0.001*** | 0.01 | 2.90 | 0.001*** |
| genotype | 0.002 | 0.58 | 0.754 | 0.00 | 1.04 | 0.29 | 0.01 | 2.61 | 0.003** |
| block | 0.005 | 1.83 | 0.108 | 0.01 | 4.36 | 0.001*** | 0.03 | 11.72 | 0.001*** |
| genotype× treatment | 0.002 | 0.81 | 0.506 | 0.00 | 1.51 | 0.061 | 0.00 | 1.71 | 0.039* |
Treatment: precipitation exclusion (0%, 25%, 50%, 75%). Date: sampling dates. Genotypes: drought-sensitive wheat and drought-tolerant wheat. ‘.’ 0.1 < P < 0.05; ‘*’ P < 0.05; ‘**’ P < 0.01; ‘***’ P < 0.001
Three-way repeated measure ANOVA for bacterial and archaeal ammonia monooxygenase, nitrite reductase, nitrous oxide reductase gene abundance, and the Fungi: Bacteria ratio for the effect of precipitation exclusion treatments, sampling dates, and genotype.
| AOA | AOB | nirK | nosZ | F:B ratio | |
|---|---|---|---|---|---|
| treatment | 1.449 | 0.241 | 0.940 | 1.027 | 0.467 |
| date | 46.382*** | 40.379*** | 40.176*** | 79.707*** | 86.755*** |
| genotype | 0.205 | 0.006 | 0.388 | 0.689 | 0.043 |
| block | 2.180* | 3.175** | 2.682* | 0.995 | 0.918 |
| treatment × genotype | 4.782** | 0.993 | 4.356** | 3.188** | 0.854 |
F-values are shown in the table.
Treatment: treatments with precipitation exclusion (0%, 25%, 50%, 75%). Date: sampling dates. Genotype: drought-sensitive wheat and drought-tolerant wheat. ANOVA significance, ‘.’ 0.1 < P < 0.05; ‘*’ P < 0.05; ‘**’ P < 0.01; ‘***’ P < 0.001
Correlation between microbial and grain quality parameters
We performed Spearman correlations to test if some microbial parameters covaried with wheat quality data (grain gluten and protein content and flour peak maximum time (PMT) and maximum recorded torque (BEM)). We did not find a significant effect of rainfall exclusion treatment on grain qualities but found a significant effect of wheat genotype on protein content (P < 0.001) and PMT (P< 0.001), so we decided to treat the two genotypes separately and all the precipitation treatments together. Correlations between grain quality and microbial carbon use fluctuated over time (Table 3). The correlations between carbon sources and grain quality indicators were all negative for the DT genotype whereas both positive and negative correlations were found for the DS genotype (Table 3). The abundance of microbial N-cycling genes was found to be correlated to grain quality measurements mostly for soil collected on the early (May and June) sampling dates (Table 4). The amoA (archaeal and bacterial), nirK, and nosZ genes quantified in the DT genotype samples on May 10 and May 24 were negatively correlated to protein and gluten content (Table 4). Only the F:B ratio was positively correlated to protein content (Table 4). For the DS genotype, the amoA (archaeal and bacterial) and the nosZ genes were negatively correlated to the grain quality parameters and the F: B ratio was positively correlated to PMT for soil samples collected on May 24 (Table 4). The F:B ratio was positively correlated with BEM for both genotypes on July 5 and June 21. For the DT genotype, we found some positive and negative correlations between nosZ and PMT, AOA and protein (July 19 and August 1), while for the DS genotype nirK was positively correlated with gluten on July 5. Many significant correlations between microbial richness/diversity indices and grain baking quality were found, mostly for the DS genotype (Table 5). Significant correlations between microbial community descriptors (PCA axes for OTUs and microbial carbon use) and grain quality indicators for sampling dates in May and June were also identified.
Significant (P< 0.05) Spearman correlations between microbial carbon utilization and grain baking quality for each sampling date (N = 24).
| Drought tolerant | Drought Sensitive | ||||||
|---|---|---|---|---|---|---|---|
| Carbon source | Quality | Rs | P-value | Carbon source | Quality | Rs | P-value |
| 10-May | 10-May | ||||||
| Beta methyl D-glucoside | Protein | −0.609 | 0.002 | N-acetyl D-glucosamine | Gluten | 0.537 | 0.008 |
| Phenylethylamine | BEM | −0.587 | 0.003 | 7-Jun | |||
| 24-May | 4-hydroxy benzoic acid | Gluten | 0.522 | 0.009 | |||
| α-keto butyric acid | Gluten | −0.628 | 0.001 | 21-Jun | |||
| 21-Jun | Tween.40 | Protein | −0.601 | 0.002 | |||
| N-acetyl D-glucosamine | PMT | −0.562 | 0.005 | 5-Jul | |||
| 5-Jul | L-Serine | Protein | −0.547 | 0.007 | |||
| Glycogen | PMT | −0.552 | 0.006 | D-L alpha glycerol phosphate | Protein | −0.550 | 0.007 |
| 1-Aug | 19-Jul | ||||||
| Pyruvic acid methyl ester | Gluten | −0.599 | 0.002 | L-phenylalanine | PMT | 0.576 | 0.004 |
| 1-Aug | |||||||
| L-asparagine | PMT | −0.575 | 0.006 | ||||
Significant (P< 0.05) Spearman correlations between functional gene abundance and grain baking quality for each sampling dates (N = 24).
| Drought tolerant | Drought sensitive | ||||||
|---|---|---|---|---|---|---|---|
| Gene | Quality | Rs | P-value | Gene | QualityE | Rs | P-value |
| 10-May | 24-May | ||||||
| nosZ | Gluten | −0.406 | 0.054 | AOB | Gluten | −0.504 | 0.012 |
| 24-May | AOA | Protein | −0.406 | 0.055 | |||
| AOB | Gluten | −0.450 | 0.031 | nosZ | BEM | −0.400 | 0.059 |
| nirK | Protein | −0.441 | 0.035 | F:B ratio | PMT | 0.425 | 0.043 |
| AOA | Protein | −0.578 | 0.004 | 7-Jun | |||
| F:B Ratio | Protein | 0.547 | 0.007 | nirK | Gluten | −0.441 | 0.035 |
| 7-Jun | 21-Jun | ||||||
| F:B Ratio | Protein | 0.426 | 0.048 | F:B Ratio | Protein | 0.406 | 0.054 |
| 21-Jun | F:B Ratio | PMT | −0.406 | 0.055 | |||
| AOA | Protein | −0.563 | 0.005 | F:B Ratio | BEM | 0.492 | 0.017 |
| AOA | PMT | 0.404 | 0.056 | 19-Jul | |||
| 5-Jul | nirK | Gluten | 0.558 | 0.009 | |||
| nirK | Gluten | −0.443 | 0.034 | ||||
| nosZ | PMT | 0.401 | 0.058 | ||||
| F:B Ratio | BEM | 0.479 | 0.021 | ||||
| 19-Jul | |||||||
| AOA | Protein | −0.426 | 0.042 | ||||
| 1-Aug | |||||||
| nosZ | PMT | 0.392 | 0.058 | ||||
Significant (P< 0.05) Spearman correlations between bacterial and archaeal and fungal richness and diversity and grain baking quality for each sampling dates (N = 24).
| Drought tolerant | Drought sensitive | ||||||
|---|---|---|---|---|---|---|---|
| Diversity | Quality | Rs | P-value | Diversity | Quality | Rs | P-value |
| 16S | 16S | ||||||
| 7-Jun | 10-May | ||||||
| ACE | Protein | −0.409 | 0.058 | Chao1 | Protein | −0.454 | 0.029 |
| 5-Jul | 24-May | ||||||
| Chao1 | BEM | 0.472 | 0.023 | Shannon | BEM | 0.468 | 0.024 |
| ACE | PMT | −0.467 | 0.025 | Chao1 | Protein | −0.414 | 0.050 |
| ITS | 21-Jun | ||||||
| 10-May | PD | Protein | −0.472 | 0.023 | |||
| Shannon | Gluten | −0.444 | 0.034 | Chao1 | Protein | −0.482 | 0.020 |
| Simpson | Gluten | −0.416 | 0.048 | Chao1 | Gluten | −0.520 | 0.011 |
| ACE | Protein | −0.418 | 0.047 | ||||
| ACE | Gluten | −0.446 | 0.033 | ||||
| 19-Jul | |||||||
| Chao1 | Gluten | 0.549 | 0.007 | ||||
| ACE | Gluten | 0.549 | 0.007 | ||||
| 1-Aug | |||||||
| Simpson | PMT | 0.434 | 0.044 | ||||
| ITS | |||||||
| 21-Jun | |||||||
| ACE | BEM | −0.465 | 0.025 | ||||
| PD | Gluten | 0.439 | 0.036 | ||||
| 1-Aug | |||||||
| Chao1 | PMT | 0.512 | 0.015 | ||||
| Chao1 | BEM | −0.483 | 0.023 | ||||
| ACE | PMT | 0.493 | 0.020 | ||||
| PD | PMT | 0.491 | 0.020 | ||||
Model performance in predicting grain quality at different dates
We applied least absolute shrinkage and selection operator (LASSO) regressions for each sampling date separately, to identify the date where model accuracy would be maximal to predict grain quality. In the case of the DT genotype, the best models for grain quality indicators had mean square errors ranging from 0.08 to 0.51 and AIC ranging from −17.00 to −8.35 (Table 6 and Fig. 1). The best models identified were based on microbial indicators from May 10, May 24, and June 7. For gluten and protein content, the LASSO regression had the highest accuracy for microbial indicators measured from samples collected on May 10. These models selected 11 and 8 variables, resulting in R2 of 0.95 and 0.76, for gluten and protein respectively (Table 6 and Fig. 1). The model's accuracy for gluten and protein content prediction decreased over time, (Table 6). For BEM and PMT, the best sampling dates for model generation were June 7 (R2 = 0.92) and May 24 (R2 = 0.57), respectively (Table 6 and Fig. 1). The most parsimonious model across all quality indicators was the one predicting PMT which only included 2 predictors (Table 6). For some sampling dates, no microbial predictor was selected by the LASSO procedure, resulting in null models (Table 6).
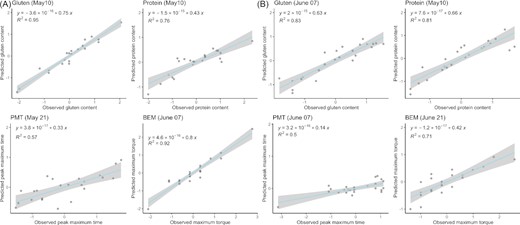
Observed values vs. predicted values from LASSO regression models for wheat grain gluten and protein content and flour maximum torque (BEM) and peak maximum time (PMT) for the drought-tolerant (A) and drought-sensitive (B) genotypes.
Comparative analysis of the LASSO model performance for the wheat grain quality of the drought-tolerant genotype (DT).
| T1 | T2 | T3 | T4 | T5 | T6 | T7 | |
|---|---|---|---|---|---|---|---|
| Date | 10-May | 24-May | 7-Jun | 21-Jun | 5-Jul | 19-Jul | 1-Aug |
| Gluten (DT) | |||||||
| C.V (best Lambda) | 0.04 | 0.38 | 0.56 | 0.72 | |||
| AIC | −16.14 | 2.00 | 1.33 | 2.00 | |||
| BIC | −15.09 | 3.04 | 2.42 | 3.09 | |||
| Nb of variables: | 11 | 1 | 1 | 1 | |||
| MSE (Mean Square Error) | 0.08 | 0.95 | 0.92 | 0.95 | |||
| R2 | 0.95 | 0.15 | 0.54 | 0.54 | |||
| Protein (DT) | |||||||
| C.V (best Lambda) | 0.15 | 0.24 | 0.19 | 0.28 | 0.46 | 0.36 | 0.18 |
| AIC | −11.64 | −9.21 | −9.56 | −3.40 | 2.00 | 2.00 | −8.24 |
| BIC | −10.51 | −8.07 | −8.47 | −2.26 | 3.14 | 3.14 | −7.15 |
| Nb of variables: | 8 | 5 | 7 | 2 | 1 | 1 | 2 |
| MSE (Mean Square Error) | 0.36 | 0.47 | 0.43 | 0.73 | 0.96 | 0.96 | 0.53 |
| R2 | 0.76 | 0.69 | 0.72 | 0.33 | 0.22 | 0.14 | 0.57 |
| PMT (DT) | |||||||
| C.V (best Lambda) | 0.21 | 0.42 | |||||
| AIC | −8.35 | 2.00 | |||||
| BIC | −7.21 | 3.18 | |||||
| Nb of variables: | 2 | 1 | |||||
| MSE (Mean Square Error) | 0.51 | 0.96 | |||||
| R2 | 0.57 | 0.19 | |||||
| BEM (DT) | |||||||
| C.V (best Lambda) | 0.38 | 0.25 | 0.03 | 0.14 | 0.20 | ||
| AIC | −2.34 | −7.31 | −17.00 | −8.92 | −5.32 | ||
| BIC | −1.21 | −6.17 | −15.91 | −7.78 | −4.14 | ||
| Nb of variables: | 1 | 2 | 10 | 7 | 4 | ||
| MSE (Mean Square Error) | 0.77 | 0.55 | 0.09 | 0.48 | 0.65 | ||
| R2 | 0.35 | 0.50 | 0.92 | 0.58 | 0.47 |
Missing values indicate failure to build models on specific sampling dates using LASSO regression. A total of 40 variables were used as inputs. Bold: highest R2 for the quality parameter.
PMT = Peak Maximum Time, BEM = flour maximum recorded torque, Nb = Number, AIC = Akaike Information Criterion, BIC = Bayesian Information Criterion, C.V = Cross validation
The overall model performance (based on R2 values) in predicting grain quality for the DS genotype was lower than the DT genotype (Table 7). Maximum accuracy of LASSO regression model was observed on June 7 for gluten and PMT, on May 10 for protein, and June 21 for BEM (Table 7). The best PMT and BEM predictive models used about half the number of the total predictors used in the best gluten and protein predictive models (PMT: 4, BEM: 6, gluten: 14 and protein: 11) (Table 7). Predictive modeling of protein content between May 24 and July 5, and on August 1 was unsuccessful and the level of accuracy of the model was low on July 19 (Table 7). A similar trend was observed for PMT: sampling dates after June 7 resulted in less accurate or no model at all (Table 7). BEM prediction was also unsuccessful for samples collected on June 7. Overall, like for the DT genotype, the predictive models for the DS genotype dataset showed the best accuracy for quality prediction with microbial data from the May and June samplings.
Comparative analysis of the LASSO model performance for the wheat grain quality of the drought-sensitive genotype (DS).
| T1 | T2 | T3 | T4 | T5 | T6 | T7 | |
|---|---|---|---|---|---|---|---|
| Date | 10-May | 24-May | 7-Jun | 21-Jun | 5-Jul | 19-Jul | 1-Aug |
| Gluten (DS) | |||||||
| AIC | −8.28 | 2.00 | −16.01 | −14.60 | −1.97 | −14.66 | 0.67 |
| BIC | −7.14 | 3.14 | −14.84 | −13.46 | −0.83 | −13.52 | 1.76 |
| C.V (best Lambda) | 0.18 | 0.45 | 0.08 | 0.09 | 0.34 | 0.10 | 0.32 |
| Nb of variables: | 6 | 1 | 14 | 11 | 1 | 10 | 1 |
| MSE (Mean Square Error) | 0.51 | 0.96 | 0.21 | 0.23 | 0.78 | 0.23 | 0.89 |
| R2 | 0.61 | 0.22 | 0.83 | 0.81 | 0.30 | 0.81 | 0.17 |
| Protein (DS) | |||||||
| C.V (best Lambda) | 0.06 | 0.17 | |||||
| AIC | −15.15 | −7.69 | |||||
| BIC | −14.02 | −6.55 | |||||
| Nb of variables: | 11 | 6 | |||||
| MSE (Mean Square Error) | 0.21 | 0.54 | |||||
| R2 | 0.81 | 0.53 | |||||
| PMT (DS) | |||||||
| C.V (best Lambda) | 0.19 | 0.41 | 0.33 | 0.38 | 0.24 | ||
| AIC | −5.76 | −3.94 | −3.56 | 2.00 | −1.55 | ||
| BIC | −4.63 | −2.80 | −2.38 | 3.14 | −0.46 | ||
| Nb of variables: | 4 | 1 | 4 | 1 | 1 | ||
| MSE (Mean Square Error) | 0.62 | 0.70 | 0.73 | 0.96 | 0.79 | ||
| R2 | 0.35 | 0.45 | 0.50 | 0.15 | 0.24 | ||
| BEM (DS) | |||||||
| C.V (best Lambda) | 0.13 | 0.36 | 0.19 | 0.18 | 0.13 | 0.17 | |
| AIC | −10.11 | −0.70 | −10.37 | −8.21 | −8.67 | 2.00 | |
| BIC | −9.02 | 0.39 | −9.28 | −7.11 | −7.58 | 3.04 | |
| Nb of variables: | 11 | 2 | 6 | 5 | 4 | 1 | |
| MSE (Mean Square Error) | 0.40 | 0.83 | 0.39 | 0.49 | 0.47 | 0.95 | |
| R2 | 0.65 | 0.32 | 0.71 | 0.61 | 0.56 | 0.03 |
Missing values indicate failure to build models on specific sampling dates using LASSO regression. A total of 40 variables were used as inputs. Bold: highest R2 for the quality parameter.
PMT = Peak Maximum Time, BEM = flour maximum recorded torque, AIC = Akaike Information Criterion, BIC = Bayesian Information Criterion, C.V = Cross validation, Nb = Number
Microbial features selected in the optimal models
The best LASSO models for the DT genotype contained microbial features that varied but were often the principal components derived from OTU tables or carbon utilization patterns, or the alpha diversity indices. Bacterial and archaeal OTUs from the Nitrosphaera (an ammonia oxidizing archaeal genus), Rhodoplanes, Solirubrobacter, and Terrimicrobium were the main contributors to the principal component 2 (explained variance: 5.1%) calculated from the May 10 dataset that was selected in the models for gluten and protein content (Fig. 2A and Table 8). In contrast, the main contributors to the bacterial and archaeal principal component 1 (explained variance: 6.0%), 2 (5.2%), and 3 (5.1%) selected for the model predicting BEM on June 7 were from the Conexibacter, Gaiella, Nitrososphaera, Hyphomicrobium and Gp16 (an uncultured genus of Acidobacteria) genera (Fig. 2A). The fungal OTUs that contributed to the principal components selected in the May and June models belonged to the Mortierella, Ganoderma, and Gliomastix genera (Fig. 2B and 2D). We found a negative relationship between the bacterial phylogenetic diversity index and gluten content and a positive relationship between bacterial Simpson diversity and gluten content and BEM in the May 10 and June 7 models (Table 8).
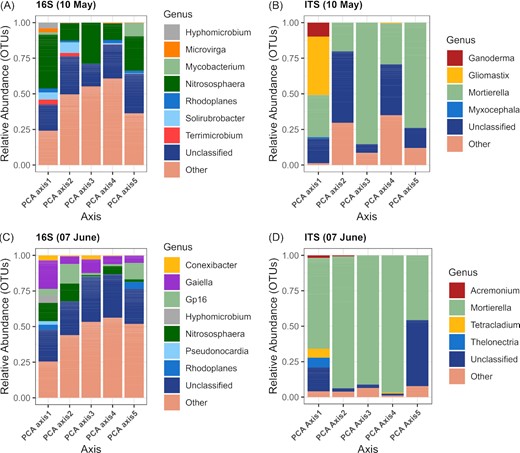
The relative abundance of the bacterial and archaeal (A, C) and fungal (B, D) genera significantly correlated with the first five principal components for the drought tolerant genotype for the May 10 (A, B) and June 7 (C, D) sampling dates. Others: various genera with relative abundances below 0.1%.
Microbial parameters included in the LASSO models for wheat grain quality of the drought-tolerant genotype (DT).
| Gluten-May10 | Protein-May10 | PMT-May21 | BEM-June7 | ||||
|---|---|---|---|---|---|---|---|
| Variables | Coefficients | Variables | Coefficients | Variables | Coefficient | Variables | Coefficient |
| Intercept | −1.60×10⁻¹⁴ | Intercept | −2.50×10⁻¹⁵ | Intercept | −2.00×10⁻¹⁶ | Intercept | 3.63×10⁻¹⁴ |
| Bacteria.PC2 | 0.492 | Bacteria.PC2 | −0.141 | Biolog.PC2 | −0.433 | Bacteria.PC1 | −0.184 |
| Fungi.PC3 | −0.011 | Fungi.PC1 | −0.184 | ACE fungi | 0.225 | Bacteria.PC2 | 0.254 |
| Biolog.PC2 | 0.354 | Fungi.PC3 | −0.188 | Bacteria.PC3 | −0.051 | ||
| Biolog.PC3 | 0.016 | Fungi.PC5 | −0.072 | Fungi.PC2 | −0.102 | ||
| Biolog.PC4 | −0.153 | Biolog.PC1 | 0.111 | Fungi.PC4 | −0.099 | ||
| Biolog.PC5 | −0.086 | Biolog.PC4 | −0.185 | Fungi.PC5 | 0.643 | ||
| Simpson bacteria | 0.628 | Biolog.PC5 | −0.122 | Biolog.PC2 | 0.365 | ||
| PD bacteria | −0.997 | nirK | −0.183 | Biolog.PC3 | −0.249 | ||
| ACE bacteria | 0.270 | Biolog.PC4 | 0.381 | ||||
| Chao1 fungi | −0.202 | Simpson bacteria | 0.498 | ||||
| nosZ | −0.235 | Chao1 bacteria | −0.080 | ||||
PD: Phylogenetic diversity, ACE: Abundance-based Coverage Estimator, PC: principal component.
Principal components derived from carbon utilization patterns were also included in all our most accurate models for the DT genotype (Table 8). The models predicting protein and gluten content (May 10) selected three to four of the top five principal components included, for which the most important contributing carbon substrates were Putrescine (rs = −0.91; P< 0.001), L-Arginine (rs = 0.74; P <0.001), Pyruvic Acid methyl ester (rs = −0.62; P < 0.001), Glycogen (rs = 0.59; P< 0.001) and L-Threonine (rs = −0.56; P< 0.001). The model predicting BEM (June 7) selected principal component 2 (explained variance: 9.3%), 3 (7.4%), and 4 (4.7%) and the most important contributing carbon substrates of the principle components were alpha-cyclodextrin (rs = 0.69; P = 0.002), alpha-keto butyric Acid (rs = 0.68; P = 0.003), γ-amino butyric acid (rs = −0.66; P = 0.006), Glucose 1-phosphate (rs = −0.71; P = 0.001). Finally, the principal component 2 (explained variance: 7.5%) selected in the model predicting PMT (May 24) was correlated to glycogen (rs = 0.59; P = 0.002), alpha-cyclodextrin (rs = 0.68; P< 0.001) and γ-amino butyric acid (rs = −0.65; P = 0.004). We also observed a negative relationship between protein content and nirK (regression coef. = −0.183) and gluten content and nosZ (regression coef. = −0.235) in the models obtained with May 10 samples (Table 7).
As for the DT genotype models, the models for the DS genotype were mainly composed of principal components calculated from the OTU tables and from the carbon utilization patterns, and from alpha-diversity indices (Table 9). The LASSO model predicting protein content selected the bacterial principal component 4 (explained variance: 4.9%) for the May 10 sampling date (Table 9). This principal component was correlated with OTUs belonging to the Nitrososphaera, Rhodoplanes, Solirubrobacter, and Terricomicrobium (Fig. 3A). On the same date, the fungal OTUs contributing the most to the principal component 1 (explained variance: 7.3%), 3 (5.6%), 4 (5.5%), and 5 (5.2%) belonged to the Acremonium, Mortierella, Pezizella, and Tetracladium (Fig. 3B). On June 7, the models predicting gluten content and PMT selected the bacterial principal components 2, 4, and 5 (Table 9). These axes explained 4.7–4.5% of the variation and were correlated to OTUs related to Gaiella, Gp6, Hyphomicrobium, Nitrososphaera, Rhodoplanes, and Solirubrobacter (Fig. 3C). On June 21, the model predicting BEM selected the bacterial principal components 2 and 4 (Table 9), which explained 4.8% and 4.7% of the variation and were correlated to OTUs related to Arthobacter, Nitrososphaera, Gaiella, Gp6, Hyphomicrobium, Bradyrhizobium, Terrimicrobium, and Rhodoplanes (Fig 4A). The fungal PC 1 (7%), 2 (6.2%), 4 (5.0%), and 5 (4.9%) selected for the June 7 were correlated to OTUs related to Acremonium, Mortierella, and Tetracladium (Fig. 3D). The fungal PC2 (5.8%) selected in the model for BEM in June 21 was linked to OTUs related to Acremonium and Mortierella (Fig. 4B). Fungal richness and diversity were selected in the LASSO models for Gluten, Protein and BEM, with either positive (Protein and BEM) or negative (Gluten) coefficients (Table 9).
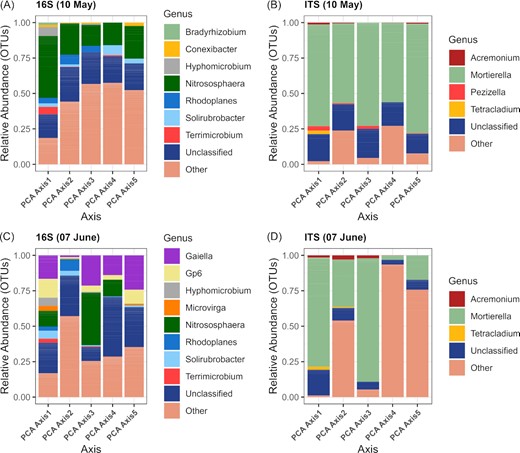
The relative abundance of the bacterial and archaeal(A, C) and fungal (B, D)genera significantly correlated with the first five principal components for the drought sensitive genotype for the May 10 (A, B) and June 7 (C, D) sampling dates. Others: various genera with relative abundances below 0.1%.
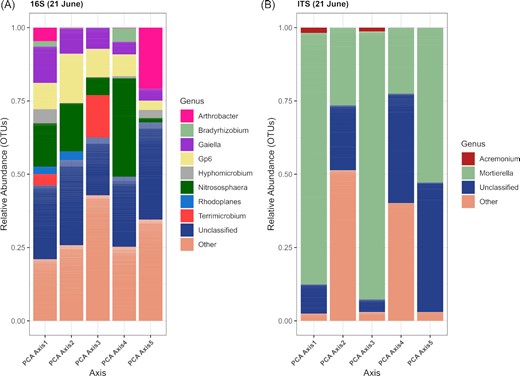
The relative abundance of the bacterial and archaeal (A) and fungal (B) genera significantly correlated with the first five principal components for the drought sensitive genotype for the June 21 sampling dates. Others: various genera with relative abundances below 0.1%.
Microbial parameters included in the LASSO models for the wheat grain quality of the drought-sensitive genotype (DS).
| Gluten-June 07 | Protein-May10 | PMT-June 07 | BEM-June21 | ||||
|---|---|---|---|---|---|---|---|
| Variables | Coefficients | Variables | Coefficients | Variables | Coefficients | Variables | Coefficients |
| Intercept | 7.96×10⁻¹⁵ | Intercept | −1.80×10⁻¹⁷ | Intercept | 3.57×10⁻¹⁶ | Intercept | −8×10⁻¹⁷ |
| Bacteria.PC2 | −0.018 | Bacteria.PC4 | −0.541 | Bacteria.PC4 | −0.009 | Bacteria.PC2 | −0.010 |
| Bacteria.PC5 | 0.216 | Fungi.PC1 | −0.219 | Fungi.PC4 | 0.146 | Bacteria.PC4 | −0.263 |
| Fungi.PC1 | 0.012 | Fungi.PC3 | −0.093 | Fungi.PC5 | 0.120 | Fungi.PC2 | −0.086 |
| Fungi.PC2 | −0.361 | Fungi.PC4 | −0.262 | Biolog.PC5 | 0.026 | Biolog.PC4 | −0.151 |
| Fungi.PC4 | −0.026 | Fungi.PC5 | 0.141 | Chao1 fungi | 0.182 | ||
| Fungi.PC5 | −0.072 | Biolog.PC3 | 0.027 | F:B ratio | 0.213 | ||
| Biolog.PC1 | 0.317 | Biolog.PC4 | −0.099 | ||||
| Biolog.PC3 | −0.078 | Biolog.PC5 | −0.009 | ||||
| Biolog.PC5 | 0.024 | Chao1 bacteria | −0.284 | ||||
| Simpson bacteria | 0.089 | Chao1 fungi | 0.154 | ||||
| PD fungi | −0.150 | PD fungi | 0.012 | ||||
| AOB | −0.460 | ||||||
| nosZ | 0.115 | ||||||
| F:B ratio | −0.031 |
PD: Phylogenetic diversity, F:B: Fungal:Bacterial ratio, PC: principal component.
For the May 10 model (protein), the carbon substrates contributing the most to the selected principal components were beta-methyl D-glucoside (rs = 0.61; P = 0.001), D-glucosamine acid (rs = −0.58; P = 0.003), D-galactonic acid y-lactone (rs = −0.53; P = 0.008). For the June 7 models (gluten and PMT), the carbon substrates contributing the most to the selected PC were Glucose 1-phosphate (rs = 0.81; P< 0.001), D-galactonic acid y-lactone (rs = 0.64; P = 0.0005), 4-hydroxy benzoic acid (rs = −0.66; P = 0.0005), 2-hydroxy benzoic acid (rs = 0.56, P = 0.003). Finally, for the June 21 model (BEM), the carbon substrates contributing the most to the selected PC were L-phenylalanine (rs = 0.55; P = 0.003) and alpha-cyclodextrin (rs = −0.49; P = 0.011). We also observed that the models selected the fungal:bacterial ratio, which negatively influenced the gluten content on June 7 and positively influenced BEM on June 21. There was a negative relationship between the abundance of the bacterial amoA gene and gluten content, and a positive relationship between nosZ and gluten content on June 7 (Table 9).
Discussion
Plant- and soil-associated microbial communities vary throughout the seasons/plant growth stages (Chaparro et al. 2013, 2014, Moroenyane et al. 2021, Azarbad et al. 2022, Azarbad et al. 2021, Wang et al. 2022) and it was unsure what was the best timing to create models to predict wheat grain quality. By sampling the same field every 2 weeks and measuring a wide range of microbial parameters, we were able to show with LASSO regression that the predictive value of microbial parameters is optimal during the earlier stages of wheat growth, at the seedling (May) or tillering stages (June). Many classes of microbial parameters (e.g. alpha diversity indices, principal components, N-cycle genes) were consistently singled out by the regression models, which could allude to a mechanistic link between grain quality and the parameter identified, or simply to covariation between the microbial parameter and grain quality due to a third unmeasured parameter. Our work focused on wheat, and although it would be interesting to see if similar patterns apply to other crops, it is the first and necessary step to start building microbial-based predictive models for crop yields and quality.
All the best models were made with data collected before the end of June, which is at the early stages of wheat growth in Quebec. This is coherent with our previous results that showed that good predictive models could be made with soil samples taken in May or June (Yergeau et al. 2020, Asad et al. 2021) even though different sampling point were not compared. Similarly, in another system where microbial communities play a key role in the process of interest, phytoremediation, it was shown that early microbial community composition could predict the potential of the plants to decontaminate soil or to survive (Bell et al. 2014, Yergeau et al. 2015). Navarro-Noya et al. (2022) showed that the complexity of microbial structure and diversity increases with maize development, and that the effect of agricultural practices on the soil microbiome was more evident at the early stages, which could explain why we found here that early microbial indicators performed better. This is encouraging for future work, as the ultimate goal of this type of predictive modeling is to have a tool that could be used to guide management strategies for farmers. Maximum usefulness will happen if indicators of yields or quality can be measured early, when it is still possible to intervene. It could be that the sampling dates highlighted are the ones that are the most critical for wheat grain quality, but for wheat, it is generally thought that the grain filling stage (around mid July in Quebec) is the most critical stage in term of N nutrition for high quality grain (Zörb et al. 2018). However, unless there is an unlikely massive microbial immigration, the microorganisms that can modulate or are indicative of soil N availability are already present in the soil early at seeding, and it is likely that their abundance and diversity at this stage could predict wheat grain quality. In fact, it was recently suggested that, because of their potential to be influenced by legacy and current environmental conditions, microbial communities act as multivariate integrators of the current and past physico-chemical conditions of their immediate environment, making them highly suitable predictors for ecosystem processes (Correa-Garcia et al. 2022).
Microbiome data have characteristics (sparsity, high dimensionality, zero-inflated) that often make them challenging to use in models. Here, we transformed the OTU and carbon utilization patterns tables using eigenvalue decomposition, namely principal component analysis, which reduces the dimension of the data sets to (number of samples)-1 principal components that are orthogonal (not collinear) and ordered in decreasing order of variance explanation, moving from several thousands of descriptors to 23, in the case of the OTU tables. We further reduced the dimensionality by only utilizing the first 5 principal components in our LASSO regression, with the idea that these components contained a large part of the variation in the original data set. One downside of this approach is that it makes the models less directly interpretable, with principal components being composite variable for many OTUs or carbon sources. However, using correlation analyses of individual OTUs with the principal components we were able to identify taxonomic groups and carbon sources that were linked with the principal components. We also used LASSO regression that selects of the most significant variables and shrinks the regression coefficient of the other variable to zero, generally producing parsimonious, highly interpretable models containing a few variables. Although non-parametric methods (neural network, random forest, support vector machine, etc.) could produce more accurate models, they are often less interpretable, meaning that the predictors influencing the output cannot be easily identifiable. Still, our models had high accuracy of 50–95%. The predictive performance of LASSO regression to predict biological characteristics from microbiome data was shown to be excellent for zero-inflated data such as microbial OTU count tables (Xiao et al. 2018, Dong et al. 2020). We also had good results using linear regression coupled with forward/backward selection with a preselection of individual OTUs that showed the strongest correlations with the predictors (Yergeau et al. 2020, Asad et al. 2021).
General community descriptors, like alpha-diversity indices or principal components, were often selected as the best explanatory variables in the models and/or significantly correlated to quality parameters. Alpha diversity indices and eigenvectors (such as principal components) derived from microbial community structures are integrators of many parameters. Interestingly, it suggests that shallow sequencing to recover alpha and beta diversity patterns together with community level carbon utilization profiling would be sufficient to model wheat grain quality. Additionally, some specific microbial parameters, such as the abundance of N-cycle functional genes or the utilization of specific carbon substrates, were consistently singled out by the LASSO regression and the Spearman correlation analyses. For example, the negative relationships between wheat quality and the abundance of the nirK, nosZ, and bacterial amoA genes were well aligned with previous work (Yergeau et al. 2020, Asad et al. 2021). The relative abundance of OTUs belonging to the ammonia-oxidizing archaea taxon Nitrososphaera were also highly correlated with many of the principal components selected in the models, and the abundance of both the archaeal and the bacterial amoA genes was often negatively correlated to quality parameters. These results further suggests that a high abundance of ammonia oxidizers and denitrifiers reduces wheat grain quality through an increased energy requirement for nitrogen uptake and utilization or through nitrogen losses, as discussed before (Yergeau et al. 2020, Asad et al. 2021, Wang et al. 2022). Indeed, since grain quality is linked to its protein content, it is energetically more efficient for the plant to uptake ammonia, which can directly be incorporated into amino acids, whereas nitrate will need to be transformed back to ammonia (Beeckman et al. 2018). Nitrate uptake also requires more energy than ammonia uptake (Beeckman et al. 2018). Finally, nitrate is prone to leach and is a substrate for denitrification, which will lead to loss of nitrogen to the atmosphere. Manipulating or inhibiting the activity of these microbial guilds using, for instance, natural or artificial nitrification inhibitors may increase wheat grain quality. However, this strategy will need to be further studied to understand potential unwanted effects, as a common nitrification inhibitor, nitrapyrin, was shown to have off-target effects on the soil microbial community (Schmidt et al. 2022) and that nitrate stimulates lateral root elongation and affects various signaling pathways in the plant (Beeckman et al. 2018). It was recently shown that biological nitrification inhibition (BNI) genes could be introduced into wheat cultivars from a wild grass species (Leymus recimosus) (Subbarao et al. 2021). The root exudates of some Australian wheat genotypes were also shown to be able to inhibit a strain of bacterial ammonia-oxidizer (O'Sullivan et al. 2016). Microbiome manipulation is still in its infancy and, because of ecological processes underlying community assembly, it will be a challenge (Agoussar and Yergeau 2021). It is also unclear if microorganisms involved in nitrification and denitrification are sufficient indicators for accurate modeling of the grain quality, and, consequently, if solely targeting these groups will result in the expected increase in grain quality. As our models showed, general community structure and diversity seem to also have a prime importance in determining wheat grain quality.
Our previous work showed that significant predictive models could be parametrized using microbial data measured early in the growing season, across a transect of more than 500 km (Asad et al. 2021). Here, we sought to confirm that early microbial measurements were optimal for such predictive models by focussing on a single field and sampling it every two weeks for a complete growing season. Taken together, the two studies confirm that our microbial-based models are effective at a large spatial scale and that they are optimally build using samples taken early in the season. Although we used a different modeling approach than previously, the selection of ammonia-oxidizers by the models was shared with our previous studies (Yergeau et al. 2020, Asad et al. 2021), suggesting a potential key role of this functional guild for wheat grain quality. Our contribution lays the foundation for future attempts to predict and optimize crop yields and quality, on our way toward microbiocentric solutions to the pressing issues facing agriculture.
ACKNOWLEDGEMENTS
The entire staff of Les Moulins de Soulanges and La Meunerie La Milanaise, and more specifically Élisabeth Vachon, Stéphanie Carrière, Chafik Baghdadi and Robert Beauchemin, are gratefully acknowledged for their support of this study. All members of the Labo Yergeau are thanked for their help in maintaining and setting up the field experiment. Emmy L'Espérance provided the R code used for repeated-measures ANOVAs.
Conflict of interest statement
The authors have no conflicts of interest to declare.
Funding
This study was supported by an FRQNT Team Grant (2019-PR-254256) and a Compute Canada Resource allocation (allocation 2020–3177) on the Graham system (University of Waterloo) to Etienne Yergeau.
