


Abstract
The doctor–patient relationship is usually measured in line with patient needs and demands. This study aimed to develop a scale measuring such a relationship from the perspective of doctors.
A draft scale was developed and adapted to the hospital context of China based on several existing scales, with an intention to measure how medical doctors view and manage their relationship with patients beyond episodic clinical encounters. Two rounds of Delphi consultations involving 14 experts were conducted to seek their consensus on the inclusion and descriptions of items. This resulted in a 19-item scale measuring four domains of the relationship. The scale was validated through a survey of 1,712 medical doctors selected from 27 public hospitals in Heilongjiang province of China. The internal consistency of the scale was assessed using Cronbach’s α coefficients of the four domains. Confirmatory factor analyses were performed to test the construct validity of the scale. Linear regression analyses were performed to assess the known-group validity of the scale.
The scale measures four domains. The Cronbach’s α of the scale reached an acceptable level, ranging from 0.61 to 0.78 for its four domains. Good fitness of data into the four-domain structure of the scale was confirmed by the confirmatory factor analysis. Known-group differences were demonstrated in the regression analyses.
The doctor–patient relationship scale developed in this study is a psychometrically valid tool assessing how medical doctors view and manage their relationship with patients in the hospital setting in China.
Doctor–patient relationship scale was developed in the context of Chinese hospital system.
The DPRS considers the perspectives of doctors and fills a gap in the literature.
The DPRS had adequate internal consistency and construct validity.
Introduction
The doctor–patient relationship plays an essential role in ensuring ethical and quality healthcare services, which is usually defined as “a form of communication being expressed in interactions between doctors and patients.” 1 Doctors and patients not only share information but also share decision making to enable the delivery of appropriate and high-quality healthcare.2 The entire process of medical care including accurate diagnosis and the effective treatment of medical conditions relies heavily on the quality of the doctor–patient relationship.3 A good doctor–patient relationship encourages continuity of care and helps to reduce duplications of services and overuse of expensive hospital care.4
The doctor–patient relationship is usually assessed in line with patient needs and demands, with an assumption that medical doctors and patients have an agreement on the therapeutic goals and relevant interventions.1,5 However, such a medical technological view is oversimplified. It is important to note that the interaction between a doctor and a patient in clinical encounters is dictated by the attitudes of both parties.6 Empirical evidence shows that the behaviours of medical practitioners can be shaped by an array of complex factors. They do not always follow clinical guidelines. Meanwhile, some patient demands may be deemed by medical doctors as irrational.7 Therefore, it is important to understand how medical doctors view and manage their relationship with patients.
Ridd et al.8 identified four major dimensions of the doctor–patient relationship from the perspective of patients: patient knowledge, trust, loyalty, and regard towards doctors. Trust and empathy are perhaps the most common elements embedded in the concept of the doctor–patient relationship. Although arguably, the perceptions of doctors and patients are reciprocally related, the view of medical doctors on the relationship may not always align well with that of their patients. Despite the strong call for patient-centeredness, doctors are likely to develop different views about their relationship with patients due to different concerns under different social, cultural, and system contexts. Extensive studies have been conducted on how well medical doctors meet the required relationship needs of patients,9–19 but our understanding of how doctors view and maintain such a relationship is very limited. There is a paucity in the literature assessing the doctor–patient relationship from the perspective of medical doctors.
This study was conducted in China, with an aim to fill the gap in the literature by exploring the doctor–patient relationship from the perspective of medical doctors. In China, the lack of a trustful doctor–patient relationship has often been blamed for jeopardizing the development of the “tiered healthcare system.” 20 The public cast doubt about the professionalism of the entire medical workforce as market forces and perverse financial incentives were introduced into the healthcare industry over the past few decades.21 Reports of verbal and physical abuse targeting health workers by disappointed patients have become routine in China, which is believed to be fuelled by distrust.22 Medical violence has damaged the self-esteem of medical doctors and further jeopardized their clinical relationship with patients. Empirical evidence shows that the tension between doctors and patients is associated with low professional efficacy, emotional exhaustion, high levels of cynicism,23 and low job satisfaction of medical workers.24 Triggered by such a context, the objective of this study was to develop a scale measuring the doctor–patient relationship from the perspective of doctors that goes beyond episodic clinical encounters.
Methods
This study followed the procedure of scale development as proposed by Boateng et al.,25 involving three phases: item generation and content verification; scale construct and pilot testing; and scale evaluation and validation.
Item generation
We performed a scoping review (published in a Chinese journal),26 extracting key themes with regard to the conceptualization and measurement dimensions of the doctor–patient relationship. Ten instruments were identified.9–19 The 10 scales vary considerably. Although respondents can be patients or doctors or both, they all rate the relationship in line with a set of “agreed” goals from the perspective of patients (an overview of the 10 instruments is presented in Appendix File 1). The most common theme measured by the 10 scales is “alliance,” containing items describing bond, goals, tasks, and collaborations. This is followed by the general features of interpersonal relationships (reflected by empathy, trust, respect, and regards), and patient perceptions of communications and medical practices.19 Overall, there is a lack of inquiry into how patients maintain their relationship with medical doctors, although such a relationship is reciprocal.27
The doctor–patient relationship can be measured using a range of approaches. In addition to the widely adopted medical view, studies have also explored the doctor–patient relationship from philosophical, psychological, and sociological approaches.1,5 A philosophical approach emphasizes the equality of the relationship, while a psychological approach focuses on the closeness of the relationship or psychological distance.1 In this study, we adopted a sociological approach simply because it considers the determinants of medical behaviours from a broad social perspective,28 which is deemed highly relevant to the current health system context in China. The over-prescription of antibiotics in China, for example, is common and is believed to be associated with defensive practice (in response to consumer pressure) and perverse financial incentives (coming from pressure from employers).7 The sociological approach interprets the doctor–patient relationship in the broad environment in which medical doctors work and practice. This usually goes beyond episodic clinical encounters. External elements such as trust in the broad social context have a significant impact on the doctor–patient relationship.1 Patient demands can be rational or irrational. How medical doctors manage such demands from patients depends on the mutual understanding between the two parties, patient preference, communications, and the need to maintain a continuous therapeutic relationship.7
The research team (comprising 3 professors and 5 higher degree research students) assessed the relevance of the 10 instruments and extracted items that were deemed a good fit for the aforementioned conceptual approach. Eleven items from six of those instruments were identified to serve as a starting point for item generation. The element of trust was expanded to cover two directions, namely patient trust in doctors and doctor trust in patients.
Nine items were generated in view of the special context of the Chinese health system through brainstorming within the research team (two 2-h sessions over 1 week). The additional items measured perceptions of medical doctors on the attitudes and behaviours of patients, which were absent from the existing instruments. This resulted in a draft scale containing 20 items for the next stage of Delphi consultations. The draft scale covered four domains of the doctor–patient relationship: positive perceptions of patient behaviours, negative perceptions of patient behaviours, trust in and understanding of patients, and patient relationship management. Common elements in relation to the doctor–patient relationship, such as communication, were embedded in the four dimensions, rather than standing alone as a separate dimension.
Content verification
Delphi consultations were conducted to verify the appropriateness of the content, the clarity of the descriptions, and the comprehensiveness of the scale items. The Delphi method is a highly structured approach to building formal consensus from expert opinions in the absence of strong empirical research evidence.29
In this study, 14 experts were recruited in China through a purposive sampling strategy. The expertise of those approached covered clinical medicine, psychology, health services management, and health policy (Table 1). They were asked to complete a questionnaire through e-mail, assessing the relevance of the measurement dimensions and items on a five-point Likert scale (1 = strongly disagree, 2 = disagree, 3 = neutral, 4 = agree, 5 = strongly agree). Suggested revisions were sought if disagreement was expressed. The questionnaire also asked for opinions from the experts about the comprehensiveness of the content covered and any additional dimensions and items that needed to be added to the scale.
Characteristics of Delphi participants (n = 14).
| Characteristics | First round | Second round | |||
|---|---|---|---|---|---|
| n | % | n | % | ||
| Expertise | Clinical medicine | 4 | 28.6 | 4 | 36.4 |
| Health policy | 7 | 50.0 | 4 | 36.4 | |
| Hospital administration | 2 | 14.3 | 2 | 18.2 | |
| Psychology | 1 | 7.1 | 1 | 9.0 | |
| Age (years) | 30–40 | 5 | 35.7 | 4 | 36.4 |
| 41–50 | 5 | 35.7 | 4 | 36.4 | |
| >51 | 4 | 28.6 | 3 | 27.2 | |
| Years of work experience in relevant area | 5–10 | 4 | 28.6 | 3 | 27.2 |
| 11–20 | 3 | 21.4 | 2 | 18.2 | |
| 21–30 | 4 | 28.6 | 4 | 36.4 | |
| >30 | 3 | 21.4 | 2 | 18.2 | |
| Qualification | Master degree | 4 | 28.6 | 3 | 27.2 |
| Doctoral degree | 10 | 71.4 | 8 | 72.8 | |
Two rounds of consultations were conducted: 14 participants in the first round and 11 in the second round. Consensus of expert opinions can be assessed using several indicators.30 In this study, an agreement (including “agree” and “strongly agree”) of over 80% was deemed a high level of consensus.31 The two rounds of consultations resulted in an addition of four items, the removal of five items, and the re-wording of four items. The four-dimensional structure of the scale remained unchanged (Fig. 1).
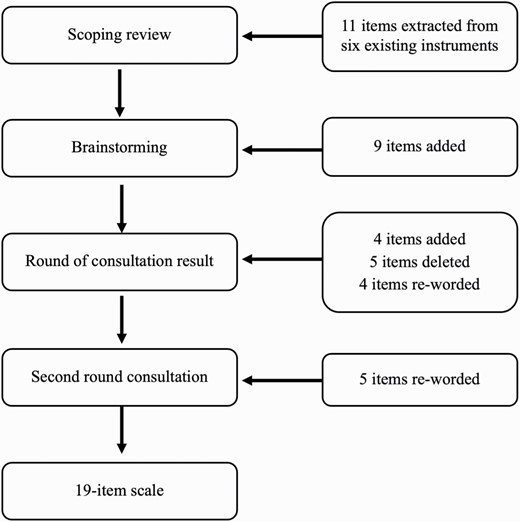
Item generation of the DPRS.
Pilot testing
The scale revised through Delphi consultations was further tested by 28 medical doctors selected from a university hospital in Harbin. Participants were asked to rate the doctor–patient relationship using the scale and comment on its relevance, comprehensiveness, and usefulness. The completion of the rating scale took about 10 to 20 min. No requests for further revisions were made. The final version of the new doctor–patient relationship scale (DPRS) contains 19 items measuring four domains: 3 for positive perceptions of patient behaviours, 3 for negative perceptions of patient behaviours, 5 for trust in and understanding of patients, and 8 for patient relationship management. Each item is rated on a five-point Likert scale (1 = strongly disagree, 2 = disagree, 3 = neutral, 4 = agree, 5 = strongly agree).
Reliability and validity assessment
Study setting
The finalized scale was validated through a survey of medical doctors in 27 public hospitals in Heilongjiang province, in northeastern China. On average, the participating hospitals received more than 36,000 outpatient visits per day in total, but less than 10% were referred from other providers or scheduled by the hospitals. In China, patients often bypass primary care institutions for common illness, and hospitals shared more than 42% of the outpatient visits.32
Sampling
Significant regional disparities exist in socioeconomic development in Heilongjiang. In this study, we selected six municipalities considering a balance in geographic location (east, west, south, north, and central) and socioeconomic status. In each municipality, four general public hospitals (two tertiary and two secondary) were identified. In addition, three specialized public hospitals were selected from the participating municipalities. This resulted in a total of 27 participating hospitals. Medical doctors on duty in the participating hospitals at the time when the survey was conducted were invited to participate. Those who had at least 1-year clinical work experience were eligible for the study.
Data collection
Data were collected from July to August 2017. A questionnaire was developed, comprising two parts. The first part captured the sociodemographic characteristics of respondents, some of which were known to have significant associations with the doctor–patient relationship. The second part was the Chinese version of the DPRS (Appendix File 2).
The questionnaire was distributed to eligible participants by 14 trained investigators. The investigators worked as one group and spent half a day in each hospital collecting data. All of the investigators were recruited from Harbin Medical University. None of them had any employment or servicing relationship with the survey participants.
Oral informed consent from each participant was obtained prior to the survey. The respondents self-completed the questionnaire anonymously and returned the questionnaire to the investigators immediately after completion. The completeness of the questionnaire was checked by the investigators. Missing data, if any, were filled through a supplementary interview with the respondents.
A total of 1,712 questionnaires were distributed, and 1,465 (85.6%) complete questionnaires were returned.
Data analysis
Item ratings were aligned to a consistent direction, with a higher score indicating a more desirable relationship. A summed score for each dimension and the entire scale was then calculated, respectively.
Internal consistency of the items for each domain was assessed using Cronbach’s α. A Cronbach’s α of no less than 0.6–0.7 is usually considered acceptable.16,33 Item-domain correlations were calculated, and higher correlations were expected between the items and their respective domains. Construct validity of the scale was also tested using confirmatory factor analyses. Fitness of data into the model structure was assessed using the following indictors and criteria: minimum discrepancy divided by its degrees of freedom (χ2/df ratio ranging from 1 to 3), goodness-of-fit index (GFI >0.9), normed fit index (NFI >0.9), comparative fit index (CFI >0.9), Tucker–Lewis Index (TLI >0.9), standardized root mean square residual (SRMR <0.08), and root mean square error of approximation (RMSEA <0.08).34 Known-group validity of the scale was tested using linear regression analyses. Empirical evidence shows that female doctors and those with lower workloads tend to have a better relationship with their patients.35 Doctors from a specialist hospital are more likely to be appreciated and respected by their patients because of their highly subspecialized clinical skills as a last resort for medical treatment.36 There is no clear evidence to support age and qualification differences in the doctor–patient relationship. Patient complaints and medical disputes are common indicators of a negative patient–doctor relationship.37,38 We assumed that these known differences would be revealed by the DPRS in our study sample as indicated by linear regression analyses.
The data analyses were performed using SPSS 22.0 and AMOS 24.0. A P value lower than 0.05 was deemed statistically significant.
Results
Results of Delphi consultations
The first round of consultations resulted in an addition of four items and the removal of five items. The five items were removed because of low levels (<80%) of expert agreement. Descriptions of the removed items were perceived by some experts as extreme, potentially jeopardizing the sensitivity of the instrument. The four added items were recommended by the experts to fit within the existing dimensional structure. No additional domain was suggested. Wording revisions were made to four items to reduce ambiguity and improve clarity. Negative expressions were avoided whenever possible per the advice from the experts (Table 2).
Consensus of Delphi experts (n = 14) on addition, removal, and revision of scale items.
| Item | Source | Percentage of agreementsa | Inclusion | |
|---|---|---|---|---|
| First round | Second round | |||
| Positive health-seeking behaviours and attitudes of patients | ||||
| Patients have shown tolerance of relatively long waiting time | Adapted from SEGUE11 | 92.8% (13/14) | 90.9% (10/11) | √ |
| Family responses to death of loved ones under medical intervention are reasonable | New | 100% (14/14) | 81.8% (9/11) | √ |
| Patient responses to medical errors are reasonable | New | 85.7% (12/14) | 100% (11/11) | √ |
| Negative health-seeking behaviours and attitudes of patients | ||||
| Patients often overreact verbally and/or physically | New | 100% (14/14) | 90.9% (10/11) | √ |
| Family members of patients often overreact verbally and/or physically | New | 92.8% (13/14) | 90.9% (10/11) | √ |
| Patients are increasingly making unreasonable demands on doctorsR | Adapted from PTPS12 | 85.7% (12/14) | 81.8% (9/11) | √ |
| Patients often disrupt orders in medical care | New | 64.3% (9/14) | — | × |
| The patient is self-destructive | Adapted from DDPRQ9 | 71.4% (10/14) | — | × |
| Doctor’s trust and understanding of patients | ||||
| Patients respect me | Adapted from PTPS9 | 78.6% (11/14) | — | × |
| I believe the information provided by patientsA | New | 90.9% (10/11) | √ | |
| I worry that my personal safety may be threatened by patientsR | New | 92.8% (13/14) | 81.8% (9/11) | √ |
| I feel a need to protect myself from conflicts with patients | New | 92.8% (13/14) | 90.9% (10/11) | √ |
| I understand the treatment goals wanted by patients | New | 92.8% (13/14) | 81.8% (9/11) | √ |
| I understand how patients feel when they seek medical attentionA | New | — | 100% (11/11) | √ |
| Relationship management behaviours of doctors | ||||
| I give comfort and psychological counseling to patientsR | Adapted from SEGUE11 | 92.8% (13/14) | 90.9% (10/11) | √ |
| I feel impatient with questions asked by patients | New | 85.7% (12/14) | 100% (11/11) | √ |
| I encourage patients to engage in clinical treatment decisions | Adapted from IPC16 | 85.7% (12/14) | 100% (11/11) | √ |
| I often negotiate with patients for a solution to disagreementsR | Adapted from PPOS10 | 92.8% (13/14) | 90.9% (10/11) | √ |
| I am frustrated by patient complaints | Adapted from DDPRQ9 | 64.3% (9/14) | — | × |
| I often spend a long time communicating with patients | Adapted from PDRQ-913 | 85.7% (12/14) | 100% (11/11) | √ |
| I treat every patient equally | Adapted from IPC16 | 92.8% (13/14) | 100% (11/11) | √ |
| I hope annoying patients will not return | Adapted from DDPRQ9 | 71.4% (10/14) | — | × |
| I provide appropriate treatment affordable to patientsA | New | — | 90.9% (10/11) | √ |
| I protect the self-esteem and privacy of patientsA | New | — | 90.9% (10/11) | √ |
R: revised after the first round of consultations; A: added after the first round of consultations. DDPRQ, Difficult Doctor–Patient Relationship Questionnaire; IPC, Interpersonal Process of Care; PDRQ-9, Patient–Doctor Relationship Questionnaire; PPOS, Patient–Practitioner Orientation Scale; PTPS, Physician Trust in the Patient Scale; SEGUE (a communication framework), Set, Elicit, Give, Understand, End.
aIncluding both “agree” and “strongly agree.”
The second round of consultations ended up with a high level of agreement (>80%), with only a few suggestions for minor changes.
Reliability and validity of DPRS
Reliability
The internal consistency of the DPRS was acceptable, with Cronbach’s α ranging from 0.61 to 0.78 for the four domains (Table 3).
Cronbach’s α and item-dimension correlations (item corrected) of the measurement results of medical doctors (n = 1,465).
| Item | Mean ± SD | Cronbach’s α | Dimension | Scale | |||
|---|---|---|---|---|---|---|---|
| Positive perceptions of patient behaviours | Negative perceptions of patient behaviours | Trust in and understanding of patients | Patient relationship management | ||||
| Positive perceptions of patient behaviours | 8.15 ± 2.396 | 0.66 | 0.27** | 0.31** | −0.04 | 0.54** | |
| Patients have shown tolerance of relatively long waiting times | 2.85 ± 1.07 | 0.77** | 0.29** | 0.32** | 0.021 | 0.50** | |
| Family responses to death of loved ones under medical intervention are reasonable | 2.52 ± 1.06 | 0.81** | 0.18** | 0.18** | −0.08** | 0.37** | |
| Patient responses to medical errors are reasonable | 2.78 ± 0.97 | 0.73** | 0.17** | 0.21** | −0.02 | 0.38** | |
| Negative perceptions of patient behaviours | 7.52 ± 2.438 | 0.78 | 0.27** | 0.33** | −0.16** | 0.48** | |
| Patients are increasingly making unreasonable demands on doctors | 2.22 ± 0.95 | −0.23** | −0.76** | −0.27** | 0.13** | −0.38** | |
| Patients often overreact verbally and/or physically | 2.63 ± 0.99 | −0.24** | −0.87** | −0.25** | 0.13** | −0.41** | |
| Family members of patients often overreact verbally and/or physically | 2.66 ± 0.99 | −0.22** | −0.86** | −0.29** | 0.14** | −0.41** | |
| Trust in and understanding of patients | 16.30 ± 2.316 | 0.61 | 0.31 | 0.33 | 0.28 | 0.74 | |
| I believe the information provided by patients | 3.58 ± 0.73 | 0.25** | 0.06* | 0.58** | 0.28** | 0.48** | |
| I understand how patients feel when they seek medical attention | 4.03 ± 0.68 | 0.06* | 0.18** | 0.46** | 0.55** | 0.47** | |
| I understand the treatment goals wanted by patients | 4.02 ± 0.67 | 0.04 | −0.06* | 0.48** | 0.62** | 0.47** | |
| I feel a need to protect myself from conflicts with patients | 2.28 ± 0.93 | −0.21** | −0.38** | −0.62** | 0.15** | −0.34** | |
| I worry that my personal safety may be threatened by patients | 2.38 ± 1.01 | −0.27** | −0.47** | −0.68** | 0.14** | −0.42** | |
| Patient relationship management | 31.81 ± 4.021 | 0.73 | −0.04 | −0.16 | 0.28 | 0.63 | |
| I encourage patients to engage in clinical treatment decisions | 3.69 ± 0.86 | 0.05 | −0.07* | 0.15** | 0.58** | 0.39** | |
| I often negotiate with patients for a solution to disagreements | 3.79 ± 0.82 | 0.04 | −0.09** | 0.19** | 0.61** | 0.41** | |
| I feel impatient with the questions asked by patients | 3.58 ± 0.99 | 0.09** | −0.10** | −0.29** | −0.40** | −0.34** | |
| I often spend a long time to communicate with patients | 3.91 ± 0.81 | −0.07** | −0.22** | 0.07** | 0.63** | 0.30** | |
| I provide appropriate treatment affordable to patients | 4.01 ± 0.76 | −0.01 | −0.16** | 0.16** | 0.70** | 0.41** | |
| I protect the self-esteem and privacy of patients | 4.31± 0.67 | −0.06* | −0.16** | 0.16** | 0.78** | 0.44** | |
| I give comfort and psychological counseling to patients | 4.21 ± 0.70 | 0.01 | −0.14** | 0.20** | 0.79** | 0.49** | |
| I treat every patient equally | 4.29 ± 0.68 | −0.04 | −0.15** | 0.20** | 0.77** | 0.46** | |
*P ≤ 0.05.
**P ≤ 0.01.
Construct validity
The correlation coefficients between the items and their prior assigned dimensions (exclusive of the tested item) ranged from 0.40 to 0.87, consistently higher than those with other dimensions (Table 3).
Good fitness of data into the proposed construct of the scale was demonstrated in the confirmatory factor analysis: GFI = 0.944, NFI = 0.915, CFI = 0.925, TLI = 0.887, SRMR = 0.085, and RMSEA = 0.068. The only exception was CMIN/DF (7.692), which is common in studies with a large sample size.
Known-group validity
The age of the respondents ranged from 22 to 74 years and just over half (51.4%) were male. About 32% of the respondents had over 10 years of working experience. The majority had either a bachelor’s degree (50.3%) or a postgraduate degree (44.2%). More than half of the respondents worked more than 55 h per week. Almost 40% experienced patient complaints and 13.7% reported multiple incidents of dispute with patients. The respondents reported an overall DPRS score of 63.78 (SD = 6.707), 8.15 (SD = 2.396) for positive perceptions of patient behaviours, 7.52 (SD = 2.438) for negative perceptions of patient behaviours, 16.30 (SD = 2.316) for trust in and understanding of patients, and 31.81 (SD = 4.021) for patient relationship management (Table 4).
Characteristics of study participants and their ratings on doctor–patient relationship (n = 1,465) and differences in ratings on patient–doctor relationship by characteristics of medical doctors.
| Variable (coding) N (%) | Scale rating score (mean ± SD) | |||||||||
|---|---|---|---|---|---|---|---|---|---|---|
| Overall (63.78 ± 6.707) | Positive perceptions of patient behaviours (8.15 ± 2.396) | Negative perceptions of patient behaviours (7.52 ± 2.438) | Trust in and understanding of patients (16.30 ± 2.316) | Patient relationship management (31.81 ± 4.021) | ||||||
| Years of age | ||||||||||
| ≤35 (0) 738 (50.4) | 67.45 ± 7.29 | 8.32 ± 2.324 | 7.68 ± 2.367 | 16.43 ± 2.339 | 31.64 ± 3.993 | |||||
| >35 (1) 727 (49.6) | 66.83 ± 6.80 | 7.98 ± 2.456 | 7.37 ± 2.500 | 16.17 ± 2.287 | 31.97 ± 4.045 | |||||
| Gender | ||||||||||
| Male (0) 753 (51.4) | 63.33 ± 6.51 | 8.25 ± 2.408 | 7.43 ± 2.418 | 16.16 ± 2.286 | 31.49 ± 4.146 | |||||
| Female (1) 712 (48.6) | 64.27 ± 6.87 | 8.06 ± 2.381 | 7.62 ± 2.457 | 16.45 ± 2.340 | 32.14 ± 3.859 | |||||
| Hospital category | ||||||||||
| Specialized (0) 236 (16.1) | 69.38 ± 8.07 | 8.69 ± 2.354 | 8.05 ± 2.505 | 16.94 ± 2.608 | 32.23 ± 3.967 | |||||
| Comprehensive (1) 1,229 (83.9) | 66.71 ± 6.77 | 8.05 ± 2.391 | 7.42 ± 2.413 | 16.18 ± 2.316 | 31.72 ± 4.028 | |||||
| Years of working | ||||||||||
| ≤10 (0) 797 (68.0) | 67.41 ± 7.28 | 8.36 ± 2.276 | 7.65 ± 2.350 | 16.40 ± 2.363 | 31.64 ± 3.999 | |||||
| >10 (1) 668 (32.0) | 66.81 ± 6.77 | 7.91 ± 2.512 | 7.37 ± 2.532 | 16.18 ± 2.256 | 32.01 ± 4.041 | |||||
| Qualification | ||||||||||
| <Bachelor (0) 81 (5.5) | 64.88 ± 7.30 | 8.79 ± 2.375 | 7.69 ± 2.582 | 16.74 ± 2.774 | 31.65 ± 4.004 | |||||
| Bachelor (1) 736 (50.3) | 63.93 ± 6.91 | 8.16 ± 2.513 | 7.42 ± 2.573 | 16.35 ± 2.332 | 32.01 ± 4.090 | |||||
| Postgraduate (2) 648 (44.2) | 63.48 ± 6.37 | 8.07 ± 2.248 | 7.62 ± 2.254 | 16.19 ± 2.231 | 31.60 ± 3.938 | |||||
| Weekly working hours | ||||||||||
| <55 (0) 714 (48.7) | 64.61 ± 6.85 | 8.38 ± 2.353 | 7.98 ± 2.351 | 16.62 ± 2.265 | 31.63 ± 3.953 | |||||
| 55–65 (1) 382 (26.1) | 62.79 ± 6.58 | 7.90 ± 2.438 | 7.21 ± 2.413 | 16.03 ± 2.327 | 31.65 ± 4.065 | |||||
| >65 (2) 369 (25.2) | 63.22 ± 6.36 | 7.98 ± 2.398 | 6.97 ± 2.470 | 15.96 ± 2.316 | 32.31 ± 4.075 | |||||
| Patient complains | ||||||||||
| Yes (0) 569 (39.5) | 61.90 ± 5.83 | 7.47 ± 2.369 | 6.84 ± 2.421 | 15.67 ± 2.091 | 31.92 ± 4.064 | |||||
| No (1) 872 (60.5) | 64.96 ± 6.96 | 8.59 ± 2.320 | 7.97 ± 2.364 | 16.70 ± 2.381 | 31.70 ± 3.974 | |||||
| Disputes with patients over past year | ||||||||||
| ≤1 (0) 1,265 (86.3) | 64.01 ± 6.78 | 8.27 ± 2.401 | 7.61 ± 2.452 | 16.38 ± 2.333 | 31.75 ± 4.074 | |||||
| >1 (1) 200 (13.7) | 62.35 ± 6.05 | 7.39 ± 2.221 | 7.00 ± 2.284 | 15.78 ± 2.142 | 32.18 ± 4.021 | |||||
| Variable (coding) | Scale total | Positive perceptions of patient behaviours | Negative perceptions of patient behaviours | Trust in and understanding of patients | Patient relationship management | |||||
| Unadjusted β (P) | Adjusted β (P) | Unadjusted β (P) | Adjusted β (P) | Unadjusted β (P) | Adjusted β (P) | Unadjusted β (P) | Adjusted β (P) | Unadjusted β (P) | Adjusted β (P) | |
| Years of age | −0.044 (0.094) | −0.033 (0.458) | −0.071 (0.006) | 0.017 (0.701) | −0.064 (0.015) | −0.064 (0.148) | −0.057 (0.028) | −0.065 (0.145) | 0.041 (0.115) | 0.011 (0.805) |
| Female gender (vs male) | 0.070 (0.007) | 0.042 (0.105) | −0.039 (0.133) | −0.07 (0.007) | 0.038 (0.144) | −0.010 (0.707) | 0.064 (0.014) | 0.030 (0.249) | 0.080 (0.002) | 0.101 (<0.001) |
| Specialized hospital (vs comprehensive) | −0.139 (<0.001) | −0.105 (<0.001) | −0.098 (<0.001) | −0.061 (0.019) | −0.094 (<0.001) | −0.060 (0.021) | −0.120 (<0.001) | −0.086 (0.001) | −0.046 (0.075) | −0.054 (0.045) |
| Years of working | −0.043 (0.100) | 0.014 (0.765) | −0.092 (<0.001) | −0.089 (0.050) | −0.059 (0.024) | 0.031 (0.488) | −0.046 (0.079) | 0.032 (0.480) | 0.045 (0.083) | 0.038 (0.415) |
| Qualification | −0.049 (0.060) | −0.050 (0.060) | −0.052 (0.047) | −0.072 (0.006) | 0.023 (0.382) | 0.028 (0.282) | −0.052 (0.046) | −0.046 (0.080) | −0.035 (0.181) | −0.030 (0.265) |
| Weekly working hours | −0.098 (<0.001) | −0.067 (0.010) | −0.079 (0.003) | −0.063 (0.014) | −0.179 (<0.001) | −0.165 (<0.001) | −0.126 (<0.001) | −0.095 (<0.001) | 0.064 (0.015) | 0.082 (0.002) |
| Absence of patient complains | 0.223 (<0.001) | 0.191 (<0.001) | 0.228 (<0.001) | 0.189 (<0.001) | 0.225 (<0.001) | 0.193 (<0.001) | 0.216 (<0.001) | 0.182 (<0.001) | −0.026 (0.325) | −0.016 (0.562) |
| Number of disputes with patients over past year | −0.085 (0.001) | −0.041 (0.114) | −0.126 (<0.001) | −0.098 (<0.001) | −0.085 (0.001) | −0.038 (0.147) | −0.090 (0.001) | −0.053 (0.042) | 0.037 (0.158) | 0.044 (0.105) |
The multivariate linear regression analysis on the overall DPRS score showed that those who worked less than 55 h per week (P = 0.01) and worked in a specialized hospital (P < 0.001) reported a better relationship with patients than others. Patient complaints (P < 0.001) were a significant predictor of a poorer doctor–patient relationship. Age, gender, qualifications, length of working experience, and number of doctor–patient disputes were not found to be associated with the overall DPRS score. Although the male gender (P < 0.01) and the number of doctor–patient disputes (P = 0.001) were significant predictors of a poorer doctor–patient relationship in the unadjusted β coefficients, they became statistically insignificant after adjustment for variations of other variables (Table 4).
The results of multivariate regression analyses on the four domains were largely consistent with those of the overall score. A lower workload and specialized hospitals were associated with a better doctor–patient relationship; whereas patient complaints and disputes were associated with a worse doctor–patient relationship. The female gender was associated with better patient relationship management (Table 4). Known-group validity was supported.
Discussion and conclusions
Discussion
This study developed a novel scale measuring the doctor–patient relationship (DPRS) from the perspective of medical doctors. The DPRS instrument demonstrated good reliability and validity in the survey of 1,465 medical doctors. Although the Cronbach’s α of two dimensions of the DPRS are below the desirable level of 0.7,33 they have a coefficient of no less than 0.6 which is deemed acceptable for those with less than six items.16 Cronbach’s α would be higher if the number of items were increased.39 The four-dimensional structure of the DPRS scale is confirmed by the item-dimensional correlations and the confirmatory factor analysis. Although the CMIN/DF ratio failed to meet the criteria, it is a common problem in many studies34: when the sample size is big, χ2(df) tends to be large (876.903 in this study). The study also confirmed the known-group validity of the DPRS: higher workload, comprehensive (vs specialized) hospitals, patient complaints, and disputes are significant predictors of a worse doctor–patient relationship.
The DPRS is different from other existing instruments measuring the doctor–patient relationship in several aspects. Firstly, it examines the concerns of medical doctors, not just the degree of alignment with what patients desire in terms of the quality of care, a predominant focus of the existing instruments from the perspective of patients. Secondly, the measurement items included in the DPRS address a tense medical practice environment where conflicts and mistrust are common. Thirdly, the measurement goes beyond episodic clinical encounters. The health system and socioeconomic contexts are factored into consideration. The consideration of these unique features limited the adaptability of the existing measurement scales. As a result, only 10 items (of a total of 19) of the DPRS were adapted from the existing instruments.
Medical care is a co-production process.7 Inappropriate patient behaviours can seriously jeopardize the efforts of medical doctors. The DPRS measures the perceptions of medical doctors on both positive and negative aspects of patient behaviours in terms of how they interact with medical doctors and engage in the care processes and care outcomes. Although this DPRS instrument was developed under the context of the Chinese healthcare system, many of the problems and challenges China is facing are not unique. Internationally, consumer demands and expectations of healthcare rise dramatically with economic growth. The delivery of medical care services has never been so complex, thanks to scientific advancement. However, the health literacy of the public often lags behind. Consumers nowadays have access to abundant medical information through the new media channels. They may take improved patient care outcomes for granted without an appropriate understanding about the nature of uncertainty, risks, and individual variations of many medical technologies.40
The DPRS measures how medical doctors may respond and mitigate potential risks resulting from inappropriate patient behaviours. These involve a patient-centred consideration for safe and quality care, as well as defensive strategies to protect the doctors themselves. It is widely believed that respect, empathy, and effective communications are the core of patient-centred care.29 For a better relationship and patient care outcome, medical doctors should consider the needs, preference, and values of the patient in clinical decisions.9 These elements are assessed through the “relationship management” dimension of the DPRS.
The DPRS also measures the defensive mentality of medical doctors and their trust in patients. Distrust between doctors and patients has become a serious issue of concern over the past decade in China, as a result, at least partly, of the market-oriented health system reform. Public hospitals and medical doctors are blamed for making a profit from the over-provision of services, leading to mistrust from patients. In many cases, such mistrust leads to anger, disputes, and even violence against health workers.22–24
Limitations and future research
This study has several limitations. Although the DPRS was developed in line with the strict protocol endorsed by the academic community, it was only tested on a sample of medical doctors in Heilongjiang province. Attempts to generalize the results need to be cautious. Themes addressed in the DPRS may apply to the health sector internationally, but the scale itself is tailored to the special contexts of China. Different systems may have different priorities and concerns. The validity of this scale was established in a hospital setting only. Although we provided the English translation of the Chinese version of the DPRS (Appendix File 2), the validity of the English version in a context outside of China has yet to be tested.
Conclusion
In conclusion, the novel DPRS developed in this study is psychometrically valid for assessing doctor–patient relationship from the perspective of medical doctors. The DPRS can be adapted to other health systems. Mistrust, patient dissatisfaction and poor adherence to medical advice have become a common occurrence outside of China including in the United States,41 the United Kingdom,42 India,43 and other settings.44 Violence in healthcare settings has also attracted concerns in the studies conducted in countries like the United States, Australia, and Japan.45–47 Under such circumstances, the doctor–patient relationship would be better examined from the perspectives of both doctors and patients which is echoed by Sturgiss et al.48 Measuring the doctor–patient relationship from the perspective of medical doctors has the potential to help improve our understanding on the interaction dynamics between doctors and patients, which has implications for the experience and behaviour of both patients and medical doctors. Although this study was triggered by the increasing violent events occurring in China, the value of measuring the doctor–patient relationship beyond episodic clinical encounters from the perspective of medical doctors may vary under different settings and different systems. The scale developed in this study should not be perceived as a predictor of violence in healthcare settings. Violence can be triggered by many factors. Drug abuse and psychiatric disorders have been identified in some countries as a major contributor to violence in healthcare settings.46 The application of the DPRS should have the ultimate goal of improving the doctor–patient relationship, practice compliance with clinical guidelines, patient adherence, and patient care outcomes.
Funding
This study was supported by the National Natural Science Foundation of China (grant numbers 71673073, 71974049, 71333003), special project supported by China Postdoctoral Foundation (grant number 2016T90318).
Acknowledgements
The authors would like to thank all of the medical doctors who participated in this study. We acknowledge the contributions of the staff from the participating hospitals who assisted with the survey and provided administrative support.
Ethical approval and consent to participate
Ethical approval to conduct this study was granted by the research ethics committee of Harbin Medical University (HMUIRB20200005). Informed consent was obtained from each participating hospital and study participant.
Conflict of interest
None declared.
Consent for publication
Not applicable.
Data availability
The datasets analysed during the current study are available from the corresponding author on reasonable request.
References
Author notes
First author: Siyi Tao and Juan Zhao.
