


Abstract
Present-day geographic and phylogenetic patterns often reflect the geological and climatic history of the planet. Neontological distribution data are often sufficient to unravel a lineage’s biogeographic history, yet ancestral range inferences can be at odds with fossil evidence. Here, I use the fossilized birth–death process and the dispersal–extinction cladogenesis model to jointly infer the dated phylogeny and range evolution of the tree fern order Cyatheales. I use data for 101 fossil and 442 extant tree ferns to reconstruct the biogeographic history of the group over the last 220 million years. Fossil-aware reconstructions evince a prolonged occupancy of Laurasia over the Triassic–Cretaceous by Cyathealean tree ferns, which is evident in the fossil record but hidden from analyses relying on neontological data alone. Nonetheless, fossil-aware reconstructions are affected by uncertainty in fossils’ phylogenetic placement, taphonomic biases, and specimen sampling and are sensitive to interpretation of paleodistributions and how these are scored. The present results highlight the need and challenges of incorporating fossils into joint inferences of phylogeny and biogeography to improve the reliability of ancestral geographic range estimation.
Introduction
The present-day patterns of species distributions have been shaped by complex biogeographic processes, such as long-distance dispersal, range fragmentation, and local (regional) extinction (Lomolino et al., 2010; Marshall, 2017). These processes are interrelated with the geological and climatic history of the planet, and observed distribution patterns of organisms often reflect this history. A prominent example of this earth–biota interrelation involves the breakup of the supercontinent Pangea over the last 250 million years (Mcintyre et al., 2017), which is still revealed by the present-day geographic and phylogenetic patterns of animal and plant diversity (Carta et al., 2022; Slik et al., 2018; Zhang et al., 2022).
Based on the distribution of extant species and tectonic models, reconstructions of clades’ biogeographic histories have given credit to the Gondwanan or Laurasian legacies of distinct lineages (Meseguer et al., 2015; Noben et al., 2017; Sanmartin & Ronquist, 2018; Viruel et al., 2016). At their core, these analyses assume that neontological data alone are sufficient to unravel a lineage’s biogeographic history (Hinojosa et al., 2015; Lomolino et al., 2010; Marshall, 2017). However, extinct members of several lineages often show non-overlapping distribution ranges relative to that of their extant relatives (Leopold & Clay-Poole, 2001; Roquet et al., 2013; Wilf et al., 2019; Wood et al., 2013). This is particularly evident for old lineages, such as several ferns orders, whose origin predates the breakup of Pangea (Nitta et al., 2022) and which formerly inhabited the ancient tropical climates of Antarctica and the Northern hemisphere (e.g., Gleicheniales [Klavins et al., 2004; Skog, 2001], Marattiales [Escapa et al., 2019; Wang, 1999], Salviniales [Cúneo et al., 2013; Elgorriaga et al., 2018], Schizeales [Wang et al., 2022], Polypodiales [Conran et al., 2010], and Cyatheales [Collinson, 2001; Dettmann, 1986; Klavins et al., 2004; Li et al., 2022; Mohr & Lazarus, 1994; Pinson et al., 2018; Rees & Cleal, 2004; Smith et al., 2003]).
As with any ancestral state reconstruction, biogeographic inferences are bound to the observed state-space (in this case the present-day geographic distribution of species coded as distinct areas) (Ronquist & Sanmartin, 2011). In the presence of extinct un-sampled lineages (Herrera-Alsina et al., 2022) outside a lineage’s current distribution, the state-space limitation compromises ancestral range estimation and could potentially lead to situations where the geographic distribution of the oldest known fossil of a clade (often used to calibrate the age of the clade) is inconsistent with inferred ancestral ranges (Korall & Pryer, 2014; Yan et al., 2021). To avoid these problems, it is critical to integrate paleontological and neontological data into event-based biogeographical reconstructions (Herrera-Alsina et al., 2022; Marshall, 2017).
Recent strategies and models have been developed to account for past extinction (Herrera-Alsina et al., 2022; Hinojosa et al., 2015; Meseguer et al., 2015), but few studies have directly incorporated geographic data of fossils into biogeographic reconstructions (Hinojosa et al., 2015; Meseguer et al., 2015; Nauheimer et al., 2012; Wood et al., 2013; Yan et al., 2021; Zhang et al., 2022). These reconstructions can further benefit from the possibility of jointly inferring the (dated) phylogeny and geographic range evolution within a single modeling framework (as opposed to the sequential inference of first phylogeny and then range evolution) (Landis et al., 2021). Under this approach, paleodistribution data inform not only ancestral state reconstructions but also influence tree topology and branching times by aiding placement of fossils with few or no morphological data (Landis et al., 2021).
Challenges imposed by the incomplete and fragmentary nature of the fossil record (e.g., taphonomic and sampling biases) underlie difficulties of combining extant and fossil taxa into a joint inference framework. The temporally and geographically patchy fossil record gives an incomplete depiction of paleodistributions, leading to the question how to score the distribution range of fossil species and how to deal with multiple occurrences for a single named fossil species. In addition, when the number of taxa is large (>500 taxa), methodological and practical limitations preclude the joint inference of biogeography and phylogeny. In an attempt to circumvent these limitations, here I implement a variant of the joint inference of Landis et al. (2021), where the geographic distribution of extant and fossil species informs ancestral states while accounting for topological uncertainty.
By using a specimen-level fossilized birth–death (FBD) process and a dispersal–extinction cladogenesis (DEC) model, I employ fossil-aware reconstructions to assess the biogeographic history of the tree fern order Cyatheales. This is the second largest fern order (~750 species), having a global distribution and an estimated age of origin of 210–230 million years (Nitta et al., 2022; Testo & Sundue, 2016). The eight families in the order are currently distributed in tropical and subtropical regions (Korall & Pryer, 2014; Noben & Lehnert, 2013; Schuettpelz et al., 2016) and less than 1% of species extend into Northern temperate regions. The group’s rich fossil history shows high species diversity and a wide spread Pangean distribution during most of the Jurassic and Cretaceous, yet biogeographic reconstructions have suggested a biogeographic history mostly restricted to Gondwanan landmasses (Dettmann, 1986; Korall & Pryer, 2014; Noben et al., 2017). More specifically, I jointly estimate divergence times, tree topology, and the biogeographic history of Cyatheales using distribution data on 101 fossil specimens and 442 extant species. Using tree ferns as a model system, I discuss several of the underlying assumptions and limitations of combining paleontological and neontological data under a joint inference framework.
Materials and methods
Fossils and (paleo)distribution data
I compiled a list of 101 tree fern fossil specimens, including fossilized stems, fertile fronds, and spores (Supplementary Data 1). Briefly, I selected the most reliable fossil specimens from a list of 1,432 entries from the Paleobiological Database, which I revised and complemented with fossil reviews (Cheng & Yang, 2018; Collinson, 2001; Lantz et al., 1999), new fossil discoveries (Bera et al., 2014; Bertoli-Cunha et al., 2008; Cheng & Yang, 2018; Li, Miao, et al., 2019; Li et al., 2022; Pinson et al., 2018; Vera, 2008, 2010, 2013, 2015; Vera & Césari, 2018; Vera & Herbst, 2015), and commonly used fossils for dating (Barrera-Redondo et al., 2018; Korall & Pryer, 2014; Loiseau et al., 2019; Noben et al., 2017); I excluded fossil specimens for which I could not access the original description. The phylogenetic placement of several fossils, mostly stems, has been previously inferred through phylogenetic analyses (Lantz et al., 1999), but other fossil assignments have relied on the presence of clear apomorphies (e.g., spore morphology) or intuitive criteria. Historically, the Cyatheales have been subjected to changing classification schemes and clade circumscriptions, which translates into uncertainties in fossil affinities (e.g., Cyatheaceae sensu lato that refers to a clade including most families currently recognized in the order). I revised the original fossil descriptions and redefined their affinities based on current taxonomic knowledge (Schuettpelz et al., 2016).
I gathered distribution data for Cyatheales from the Global Biodiversity Information Facility (GBIF.org, February 7, 2020, GBIF Occurrence Download https://doi.org/10.15468/dl.xxjpoz), which were cleaned using publicly available scripts (Carta et al., 2022; Ramírez-Barahona et al., 2023). For fossil species, I gathered the geographic occurrence data directly from the fossils’ locality information provided in the original descriptions.
Molecular data, phylogenetic reconstruction, and dating
I assembled a molecular data set with representatives of the eight families and the 13 genera recognized for Cyatheales. For this, I employed PyPHLAWD (Smith & Walker, 2019), an automatic pipeline that retrieves molecular data from NCBI’s GenBank database, generates “clusters” of likely ortholog sequences using the Basic Local Alignment Search Tool (Altschul et al., 1990), and aligns each cluster using the Multiple Alignment using Fast Fourier Transform (MAFFT) algorithm (Katoh & Standley, 2013). I used GenBank’s plant database (last updated June 28, 2020) by querying for “Cyatheales” sequences longer than 400 bp, with a minimum sequence identity of 0.2 and a minimum coverage of 0.65. I complemented the resulting alignments with sequence data retrieved from NCBI’s PopSet database (PopSet numbers: 1722035357, 1722034779, 1722034120) and from previously published data (Barrera-Redondo et al., 2018); I incorporated sequences for additional taxa using Clustal2.0 (Larkin et al., 2007) and AliView (Larsson, 2014) and eliminated species synonyms. The final molecular data set consisted of DNA sequences for 447 species of Cyatheales (60% of the total diversity), with a total length of 15,249 bp for 10 chloroplast regions (protein coding regions: rbcL, atpB, atpA, SQD1, and matK; intergenic spacers: atpB-rbcL, rbcL-accD, trnL-trnF, trnG-trnR, and rps3-rpl16) (Supplementary Data 2).
I estimated a maximum likelihood phylogeny with RAxML v.8 (Stamatakis, 2014), using the GTRCAT model, automatic bootstrap replicates (autoMRE), and substitution parameters estimated for each marker independently. Sequences for Blechnum (Blechnaceae), Odontosoria (Lindsaeaceae), and Hypolepis (Dennstaedtiaceae) were used as out-groups. I used the resulting ML tree to check for “rogue taxa” and evaluate the overall accuracy of the estimated tree topology; five “rogue” taxa were conspicuously out of place and were removed from the alignment. After removing these taxa, I estimated the final ML phylogeny with 442 species (Supplementary Data 3).
I reconstructed and dated the phylogeny under the FBD process (Heath et al., 2014; Stadler, 2010) using the 442 extant species and the 101 fossil specimens. I used a single representative for each fossil taxa in the analyses, with the single exception of Cyatheacidites annulatus† for which I incorporated two specimens due to its wide spread distribution across space and time. The FBD process incorporates fossil data directly into the tree-generating model, effectively treating each fossil as an independent leaf in the tree (Heath et al., 2014); this eliminates fossil redundancy, allows for the inclusion of more than just the oldest fossil for any given clade, and permits the treatment of fossils as either crown or stem members of their corresponding group. Morphological data can be used within the FBD framework to infer fossil placement in the tree (but see Luo et al., 2019, for limitations to this approach). Due to data deficiency, I implemented an FBD without morphological data but with topological constraints imposed on fossils (Heath et al., 2014; Pirie et al., 2011) based on their taxonomic affinities, which appears to reliably estimate divergence times (Barido-Sottani et al., 2023; O’Reilly & Donoghue, 2020). These prior constraints inform the possible positions where each fossil can be placed in the tree, but otherwise fossils can be placed along any branch and their position solely constrained by their age and the tree priors (birth, death, and fossilization parameters).
To explore the placement of fossils and its uncertainty in the FBD analyses, I constructed “rogue plots” (Klopfstein & Spasojevic, 2019) showing the frequency (in a posterior sample of trees) at which fossils tips attach to different branches in the tree. In principle, a fossil that is broadly constrained (i.e., Cyatheaceae) will attach to multiple branches with low frequency, but a fossil that is more narrowly constrained will attach to a few branches with high frequency. To visualize the uncertainty of fossil placement, I constructed rogue plots for each fossil specimen and also summarized the number and frequency of different phylogenetic placements (branch attachment) across all fossils.
I implemented the FBD dating in RevBayes (Höhna et al., 2016) using the following settings (a graphical diagram of the model is available in Supplementary Figure S1): GTR + G nucleotide substitution model with four gamma categories; an uncorrelated exponential clock model; uniform prior in the occurrence time of fossils; and the process conditioned on survival. I defined birth and death rates using priors on the rates of diversification (log-normal distribution) and turnover (beta distribution) and defined the fossilization rate as a beta-distributed fraction of speciation rate. I defined a uniform sampling fraction of 0.60 (442 species of the ~730 recognized extant species) and set the origin time of the process to 215–230 Mya (estimated divergence times between Cyatheales and Polypodiales [Nitta et al., 2022; Testo & Sundue, 2016]). To decrease computational burden, I defined several constraints on the monophyly of genera, families, and major clades (e.g., core tree ferns) that are based on well-supported phylogenetic relationships (Barrera-Redondo et al., 2018; Korall & Pryer, 2014; Korall et al., 2007; Schuettpelz et al., 2016).
Initially, I ran the analyses for 200,000 iterations, but there was poor mixing and several model parameters showed effective sample sizes (ESS) < 100. I used the model parameters (i.e., branch rates, dated tree, origin time, topology) obtained in this “long” run to set the starting values for two final “short” runs; these consisted of MCMC chains ran for 50,000 iterations each, sampling every 10 iterations, and with a period of 2,000 iterations to tune the efficiency of the MCMC proposals. I defined a burn-in fraction of 10% for each run after inspecting the posterior traces using the “coda” package (Plummer et al., 2006) in R (R Core Team, 2022); most parameters had an ESS > 200 after burn-in. I set up the analyses to produce posterior samples of trees including all fossils as tips and the corresponding trees without fossils. I constructed maximum clade credibility (MCC) topologies with node ages defined from the median node heights as implemented in RevBayes (Supplementary Data 4 and 5).
Biogeographic reconstructions
I performed ancestral geographic range reconstruction for Cyatheales using a DEC model (Ree & Smith, 2008) with time-dependent effects on dispersal rates as implemented in RevBayes (a graphical diagram of the model is available in Supplementary Figure S1). I defined four connectivity matrices using eight broad areas: (a) North America; (b) South America; (c) Antarctica; (d) Eurasia; (e) Africa; (f) Southeastern Asia; (g) Australasia; and (h) India. The connectivity matrices do not account for distance among areas and correspond to four time periods: Triassic–Jurassic (250–145 Mya); Cretaceous (145–66 Mya); Paleogene (66–23 Mya); and Neogene–Quaternary (23–0 Mya). I defined the priors on cladogenetic events using a beta distribution on the probability of “sympatry” (Pr(s)) and estimating the probability of allopatry as Pr(a) = 1 − Pr(s). Priors on extirpation rates were defined with a lognormal distribution. For dispersal rates, if two areas were connected, I set the rates to 1, and if these were not connected, I used a beta distribution to define the prior on dispersal. This entails a high probability of dispersal when areas are connected, but allows for the possibility of long-distance dispersal between unconnected areas. Branch rates were estimated from a log-uniform distribution. I set the maximum number of areas to two, which is analytically necessary to reduce the size of the transition matrix and is justified by extant tree ferns being restricted to at most two areas (as delimited here).
I scored the geographic distribution for extant and fossil species across the eight areas using the geographic occurrence database. The distributions of fossil taxa were restricted to the area where each specimen was found, disregarding the possibility of more wide spread distributions. To assess the influence of fossil data on the estimation of range evolution, I performed two separate analyses: (a) extant-only reconstruction including only living species and (b) fossil-aware reconstruction including living and fossil species. For each analysis, I ran 10,000 iterations with sampling of the MCMC chains every ten iterations to obtain a posterior sample of at least 1,000 after burn-in; a period of 200 iterations was established to tune the efficiency of the MCMC proposals. I specified a varying burn-in fraction for each run after inspecting the likelihood traces using the “coda” package (Plummer et al., 2006) in R.
Due to computational and data limitations, I did not perform a joint estimation of the dated phylogeny and range evolution (Landis et al., 2021) and instead performed a pseudo-joint inference. To incorporate uncertainty in tree topology and divergence times, I defined a stochastic “tree” parameter in the model by using an empirical distribution drawn from the posterior sample of trees obtained in the corresponding FBD dating analyses; this parameter was sampled every iteration based on the regular Metropolis–Hastings acceptance ratio. By doing this, the MCMC chain preferentially samples specific tree topologies that maximize the posterior probability of the complete model. In the case of the fossil-aware reconstruction, this allows biogeography to inform the phylogenetic placement of fossils and take into account topological uncertainty. Prior to running the analyses, I filtered the posterior samples of trees to obtain a set of trees (7,072 trees) with the same family-level backbone topology as that of the ML tree and resolved all sampled ancestors as branches with near-zero branch lengths (0.0001). I constructed maximum clade credibility (MCC) topologies with node ages defined from the median node heights as implemented in RevBayes. I constructed rogue plots as described above to assess the frequency of branch attachments of fossils under the filtered FBD trees and the posterior sample of trees resulting from the DEC. The filtered sample of FBD trees showed that the number and frequency of branch attachments across fossils remained highly similar to the unfiltered FBD posterior sample (Supplementary Figure S3).
I sampled ancestral states and stochastic mappings for range reconstructions, which were summarized and visualized using MCC topologies, state-frequency-through-time (SFTT) plots, and transition graphs. The SFTT plots summarize the proportion of lineages found in different states (areas) at a given time while averaging over the posterior sample of trees and stochastic mappings (Landis et al., 2021). These mappings represent realizations (histories) of the biogeographic process that are consistent with ancestral states and model parameters. I constructed the SFTT plots using 2-Myr bins. Transition graphs summarize the number of times a dispersal event is observed between pairs of areas along the tree; dispersal events take the form Area1 → (Area2 + Area1). Extinction events were summarized by tallying the number of inferred events per area, where an extinction event in Area2 would take the form (Area1 + Area2) → Area1. All plots were constructed using the tidyverse (Wickham et al., 2019), ggplot2 (Wickham, 2016), metBrewer (Mills, 2022), and igraph (Csardi & Nepusz, 2006) packages in R; plots were further edited using Adobe Illustrator (Adobe, United States).
Uncertain (paleo)distribution data and sensitivity of reconstructions
A main caveat of the fossil-aware biogeographic reconstruction is that fossil taxa are scored as present only in the area were the sampled specimen was found. However, taphonomic and sampling biases possibly result in unknown (or unknowable) paleodistributions. To account for the possibility of wider, yet unobserved, geographic distributions of fossil taxa, I performed additional DEC analyses using alternative scoring schemes with ambiguous states (?) or fully widespread fossil distributions. Implementing these analyses using eight areas was analytical unfeasible, so I rescored species’ distributions across three areas (Laurasia, Holotropical, and Austral) that broadly follow the floristic regionalization of Carta et al. (2022), except the Indochinese and Malayan regions that I included in Laurasia. This entails a loss of area resolution, leading to restrictions and limitations for the DEC analyses and their interpretation (e.g., single connectivity matrix, undefined source of dispersal, merging of otherwise distant regions). However, these analyses are aimed at gauging the impact of fossil sampling and taphonomic biases in reconstructions by using varying levels of information on the paleodistributions.
I ran four DEC analyses with the three-area scoring scheme (Supplementary Figure S2): (a) reconstructions with the observed distribution of fossils using the geographic data for specimens (e.g., 0 0 1); (b) reconstructions with an uncertain distribution of fossils using the observed distribution and ambiguous states for all other areas (e.g., ?? 1); (c) reconstructions with an unobserved distribution of fossils using ambiguous states for all areas (e.g., ???); and (d) reconstructions with a widespread distribution of fossils with presence in all areas (e.g., 1 1 1). I performed all of these analyses as detailed above, using a single MCC tree for the reconstructions (i.e., MCC tree from the topologies sampled in fossil-aware reconstruction) and employing a maximum area constraint of two (this constraint was relaxed to three areas for the wide spread distribution reconstruction).
Results
Divergence times
The combined analyses of fossils and extant species resulted in a maximum clade credibility (MCC) tree that agrees with previous phylogenetic hypothesis (Supplementary Figure S4; Supplementary Data 4 and 5). Accounting for dating and topological uncertainty, the crown node of Cyatheales was dated to 226–188 Mya, placing the age of the most recent common ancestor of living tree ferns in the Late Triassic–Early Jurassic (Supplementary Figure S4). The origins of tree fern families (stem ages) were estimated in the Jurassic except for the divergence between Plagiogyriaceae and Culcitaceae that occurred during the Late Cretaceous–Paleogene (Supplementary Table S1). The onset of crown group diversification of the largest tree fern family, the Cyatheaceae (~90% of extant species in the order), was estimated in the Early Cretaceous (139–105 Mya), whereas the crown group ages of extant genera were estimated in the Late Cretaceous–Paleocene.
Biogeographical reconstructions
The biogeographical reconstruction based solely on extant species (extant-only, Figure 1) supported a scenario in which the most recent common ancestor of living Cyatheales had Gondwanan affinities; the three most probable reconstructed ancestral ranges were Australasia (p = 0.24), Australasia + South America (p = 0.21), and Australasia + Antarctica (p = 0.12) (Figure 1A and B; Supplementary Data 6). These Gondwanan affinities were shared by tree fern families except for the Culcitaceae and the Plagiogyriaceae whose crown groups showed Laurasian ranges (Figure 1B). The SFTT plot showed a widespread Gondwanan distribution throughout the last 200 My, initially encompassing mostly Australasia during the Early Jurassic and then extending into other landmasses toward the Middle Jurassic (Figure 1A).
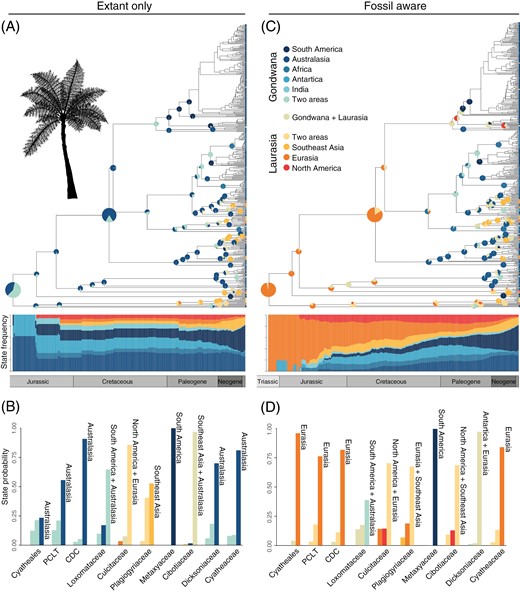
Biogeographic reconstructions for tree ferns (Cyatheales) based on distribution data of extant and fossil species. (A, C) Phylogenetic trees of Cyatheales showing the most probable inferred ancestral ranges for nodes across the phylogeny and state-frequency-through-time (SFTT) plots. SFTTs show the temporal distribution of probable ancestral geographic states based on reconstructions excluding (A, extant only) and including fossils (C, fossil aware); for simplicity, information for several nodes was omitted from the phylogenetic tree. (B, D) Posterior probabilities of the three most probable inferred states for each node under reconstructions excluding (B, extant only) and including fossils (D, fossil aware). CDC represents the node for the most recent common ancestor of the Cyatheaceae, Dicksoniaceae, and Cibotiaceae. PCLT represents the node for the most recent common ancestor of the Plagiogyriaceae, Culcitaceae, Loxomataceae, and Thyrsopteridaceae.
Range expansions mainly happened out of Australasia (mean number of events = 34.6) into the rest of Gondwanan landmasses and Southeast Asia (Figure 2A; Supplementary Table S2). Likewise, South America and Southeast Asia appeared as the source of range expansions of Cyatheales into North America and Eurasia, respectively. Dispersal events across Gondwana appeared to have been low but constant since the Jurassic, whereas dispersals from Gondwana into Laurasia most probably happened during the Neogene (Figure 2B); overall, dispersal events in the Cyatheales appeared to have been more frequent during the last 30 My. There was a higher frequency of regional extinction in Gondwana relative to Laurasia, and Australasia had the largest relative number of regional extinctions (Figure 2A); extinction events appeared to have been constant in Gondwana since the Jurassic but only recently increased in Laurasia (Figure 2B).
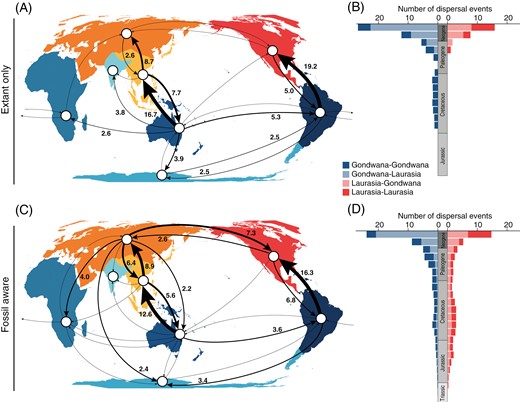
Reconstruction of dispersal events for tree ferns (Cyatheales) across geographic regions based on distribution data of extant and fossil species. (A, C) Number of inferred dispersal events (posterior mean) among geographic regions based on reconstructions excluding (A, extant only) and including fossils (C, fossil aware). Arrows indicate dispersal routes with greater than one event, but for simplicity, numbers are only shown for routes with greater than two events. (B, D) Number of inferred dispersal events through time based on reconstructions excluding (B, extant only) and including fossils (D, fossil aware). Dispersal events through time were estimated in 10 million year bins and grouped according to the direction of movement among major geographic regions (Gondwana and Laurasia).
Incorporating paleodistribution data into the analyses provide an alternative view of the biogeography of the Cyatheales (fossil-aware reconstruction, Figure 1). Here the Gondwanan affinities of crown Cyatheales are not supported and instead the most probable reconstructed ancestral range encompassed Eurasia (p = 0.96), followed by Eurasia + Antarctica with low probability (p = 0.04) (Figure 1C and D; Supplementary Data 6); this reconstruction retrieved mostly Laurasian affinities of tree fern families expect for the Metaxyaceae and the Loxomataceae (Figure 1D). The MCC topologies for the fossil-aware reconstruction included a stem lineage for the Cyatheales, which I omitted while summarizing SFTT plots and transition graphs.
The fossil-aware reconstruction supported constant dispersal events from Laurasia into Gondwanan landmasses (Figure 2C and D; Supplementary Table S3), including the range expansion into Gondwana of the four genera of the Cyatheaceae, the largest tree fern family. The genus Cyathea retained a reconstructed ancestral range that included Laurasian landmasses until the Cretaceous–Paleocene and only later achieved its current distribution predominantly in South America and a few species in Australasia. The most probable ancestral range for stem Dicksoniaceae was Eurasia (Figure 1D), and dispersal into Gondwanan landmasses was also estimated in the Cretaceous.
The SFTT plot showed that Cyatheales had a predominantly Eurasian distribution during the early stages of their evolution (Late Triassic–Early Jurassic) and that the occupancy of Laurasian landmasses gradually subsided toward the present day, a pattern that is also observed for Antarctica (Figure 1C). The model inferred a high frequency of range expansions from Australasia into Southeastern Asia (Figure 2C), but a more complex dispersal network was retrieved with a higher frequency of Laurasian–Laurasian and Laurasian–Gondwanan range expansions (Figure 2D). Under the fossil-aware reconstruction, Australasia had the highest frequency of extinction events among Gondwanan landmasses, but lower than those estimated for Laurasian landmasses (Figure 3C). Extinction events appeared to have been constant since the Jurassic both in Gondwana and Laurasia (Figure 3D), but a slight increase in regional extinctions was inferred in Laurasia during the Cretaceous (Figure 3B).
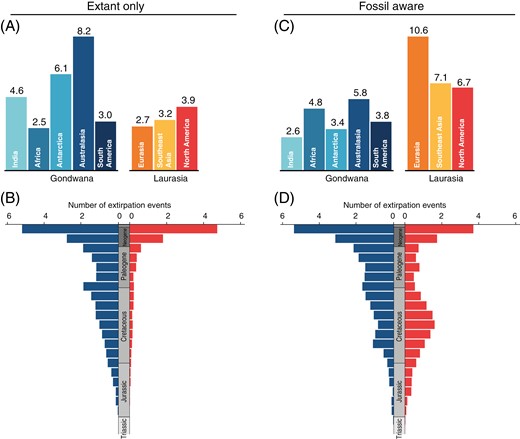
Reconstruction of regional extinction events for tree ferns (Cyatheales) across geographic regions based on distribution data of extant and fossil species. (A, C) Number of inferred regional extinction events (posterior mean) within geographic regions based on reconstructions excluding (A, extant only) and including fossils (C, fossil aware). (B, D) Number of inferred regional extinctions through time based on reconstructions excluding (B, extant only) and including fossils (D, fossil aware). Extinction events through time were estimated in 10 million year bins and grouped according to the major geographic regions (Gondwana and Laurasia).
Phylogenetic placement of fossils under the joint inference
The uncertainty in phylogenetic placement of fossil (branch attachment) in the posterior sample of trees from the FBD and the DEC model varied across specimens (Supplementary Data 7 and 8). The tally of branch attachments (with frequency > 0.01) across the 101 fossils in the FBD posterior sample showed that most specimens attached to multiple branches in the tree with low frequency (Supplementary Figure S5), all within their specific constraints. Several fossils had a high frequency of attachment to single branches in the tree; for example, the monophyletic grouping of extinct Cyatheacidites annulatus† and extant Lophosoria led to the fossil being preferentially attached to the stem branch of the genus.
As observed in the FBD posterior sample, the overall uncertainty in fossil placement remained moderately high in the posterior sample of trees from the DEC model. However, the tally of branch attachments (with frequency > 0.01) in the posterior sample of the DEC model showed that the number of attachments was reduced to less than 10 branches per specimen for all fossils (Supplementary Figure S5), which reflects how biogeography informs the placement of fossils in the tree. Accordingly, the DEC model led to an increase in the frequency of attachment to particular branches across all fossils (Supplementary Figure S5), specifically in cases of high topological uncertainty.
Sampling bias and uncertain (paleo)distributions
The three-area biogeographical reconstructions using observed distributions and uncertain distributions inferred similar ancestral geographic ranges for key nodes in the tree, but with slightly different probabilities for the most likely states. The two most probable ancestral states for crown Cyatheales were Laurasia (observed: p = 0.83; uncertain: p = 0.71) and Laurasia + Antarctica (observed: p = 0.16; uncertain: p = 0.28) (Supplementary Data 6). The SFTT plots for these two reconstructions showed an initial high frequency of occupancy of Laurasia that later shifted toward a higher occupancy of the Holotropics (Figure 4), but scoring uncertain paleodistributions resulted in a higher frequency of occupancy of Laurasia compared to the observed scoring scheme.
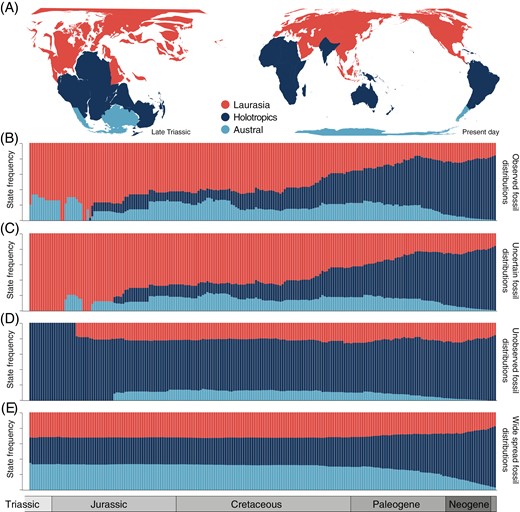
Biogeographic reconstructions for tree ferns (Cyatheales) based on distribution data of extant and fossil species using three areas. (A) Geographic maps of the globe for the Late Triassic period (left) and the present day show the configuration of the three areas used for reconstructions. (B–E) State-frequency-through-time (SFTT) plots showing the temporal distribution of probable ancestral geographic states based on reconstructions using fossil geographic information to varying levels (B, known distributions; C, uncertain distributions; D, unknown distributions; E, widespread distributions).
The three-area reconstruction using unobserved distributions for fossils resulted in ancestral states that were consistent with the extant-only reconstruction, where the most probable ancestral state for crown Cyatheales was Holotropics (p = 0.98) (Supplementary Data 6). Accordingly, the SFTT plot showed a relatively constant frequency of occupancy of the Holotropics since the early stages of Cyathealean evolution (Figure 4). Lastly, the reconstruction using wide spread distributions was less-certain regarding the inferred ancestral range for crown Cyatheales, supporting Laurasia + Holotropics + Antarctica as the most likely state (p = 0.32), followed by Laurasia (p = 0.18) and Holotropics (p = 0.16); in turn, the SFTT plot showed a constant and widespread distribution across all three regions since the Late Triassic (Figure 4).
Discussion
The biogeography of Cyatheales
The dated phylogeny for the Cyatheales here presented provides the most complete account of the timing of evolution and biogeography of this ancient group of ferns. Stem and crown ages for families and genera mostly agree with previously published phylogenies (Barrera-Redondo et al., 2018; Janssen et al., 2008; Korall & Pryer, 2014; Korall et al., 2007; Loiseau et al., 2019; Nitta et al., 2022; Noben et al., 2017; Testo & Sundue, 2016) and provide evidence of a delayed onset of crown group diversification of extant lineages occurring until the Cretaceous. As observed for other groups of ferns (Nitta et al., 2022), the divergence times estimated across the Cyatheales suggest that their origin predates the breakup of Pangea and that major living lineages originated before the Angiosperm Terrestrial Revolution occurring toward the Late Cretaceous (Benton et al., 2022). This fits the narrative of extant ferns diversifying in the shadow of angiosperms (Benton et al., 2022; Nitta et al., 2022; Schneider et al., 2004), suggesting that crown group diversification of Cyathealean genera occurred in synchrony with the rise to ecological dominance of flowering plants during Late Cretaceous–Paleogene and the emergence of modern-day tropical ecosystems (Herrera et al., 2014; Wing et al., 2009).
The biogeographic reconstruction based on extant species (extant-only) is consistent with the presumed Gondwanan origins of the Cyatheales and agrees with previous studies on the Cyatheaceae (Korall & Pryer, 2014) and the Dicksoniaceae (Noben et al., 2017). The SFTT plots show that Cyatheales were initially wide spread across Southern Pangea (later Gondwana) during most of the Jurassic and subsequently occupied Laurasia via secondary dispersal. Today, Eurasia and North America are occupied by a handful of extant species (Plagiogyria, Culcita, and Gymnosphaera), and under this biogeographic scenario, the current occupation of these regions is the result of (relatively) recent events of colonization from the south. However, the occupation of Laurasian landmasses until the Paleocene is at odds with the fossil record placing multiple Cyathealean lineages, and some of the oldest known fossils, within Laurasia during most of the Jurassic and Cretaceous, and up to the Ecocene (Barrington, 1983; Bolchotinova, 1959; Collinson, 2001; Korall & Pryer, 2014, Li, Miao, et al., 2019; Li, Moran, et al., 2019; Li, et al., 2022; Mohr & Lazarus, 1994; Pinson et al., 2018; Skog, 1976; Smith et al., 2003; Tidwell & Ash, 1994; Tidwell & Nishida, 1993; Tidwell et al., 1989). For instance, the Early Cretaceous Kuylisporites mirabilis† and Cyathea cranhamii† are the two oldest known representatives of the Cyatheaceae and were recovered from sites in Siberia (Bolchotinova, 1959) and Canada (Smith et al., 2003), respectively; these fossils have been used to calibrate the age (stem or crown) of Cyatheaceae that form the basis of reconstructions of Gondwanan ancestral ranges (Janssen et al., 2008; Korall & Pryer, 2014; Loiseau et al., 2019).
The presence of extinct Laurasian Cyatheales is not necessarily incompatible with a Gondwanan origin, yet their existence suggests a more complex biogeographic history. By bringing together paleontological and neontological information, my results support the past occupancy of Laurasia by members of the Cyatheales during the Late Triassic and Early Jurassic and into the Cenozoic (Afsaneh et al., 2013; Barbacka et al., 2019; Bonis & Ku, 2012; Diéguez et al., 2010; Li et al., 2022; Pienkowski et al., 2011; van Konijnenburg-van Cittert, 2002; Zhang et al., 2014). This alternative view suggests that the most recent common ancestor of Cyatheales was probably distributed across Northern Pangea (later Laurasia) and then quickly spread into Southern Pangea (later Gondwana) during the Middle to Late Jurassic. Secondary dispersals into Gondwana of the two most speciose families, the Cyatheaceae and the Dicksoniaceae, took place during the Late Jurassic–Cretaceous from Eurasia into Southeast Asia and South America.
It is likely that Cyathealean lineages experienced major geographic range shifts and regional extinctions throughout their evolution associated with the paleogeography of plate tectonics (Ende et al., 2017; Korall & Pryer, 2014; Mcintyre et al., 2017) and changes to global climate (Arakaki et al., 2011; Collinson, 2000; Couvreur et al., 2021; Mcintyre et al., 2017; Zachos et al., 2008), particularly during the Cenozoic. For instance, the Thyrsopteridaceae is now restricted to a single species in the Juan Fernández Island off the coast of South America (Li, Moran, et al., 2019; Schuettpelz et al., 2016), but it is believed to have been more diverse and wide spread in the past (e.g., Cretaceous–Late Eocene of Japan [Nishida & Nishida, 1979], Southeast Asia [Li, Moran, et al., 2019], Australia [Mccurry et al., 2022; Tidwell et al., 1989], and North America [Arnold, 1945]). I hypothesize that the disappearance of (most) tree ferns from Laurasian landmasses was triggered by changing climate during the Cenozoic, which began to shift into the drier and colder conditions that led to the disappearance of tropical climates and the mega thermal Laurasian rain forests (Collinson, 2000; Ying-Lim et al., 2022).
Inferences on specific biogeographical events is likely affected by uneven fossil sampling. The reconstruction supports an ancient vicariant event involving Australasia and North America in Cyathea occurring in the Late to Early Cretaceous (ca. 100 Mya) temporarily coinciding with the final separation of Gondwana and Laurasia (Mcintyre et al., 2017). This disjunct distribution is possibly resulting from taphonomic or sampling bias of fossil data, and the inferred North American range likely included Eurasia as well; instead of a vicariant event, it is possible that a range expansion into North America or Australasia was followed by extinction in Eurasia. In either case, the reconstruction supports the dispersal of Cyathea into South America via a Northern route (~95% of species of Cyathea are found in South America). Coincidentally, the characteristically tropical palm family (Arecaceae) shows a similar biogeographic history (Couvreur et al., 2011; Ying-Lim et al., 2022). The oldest known palm fossils have been discovered in Europe and North America (Couvreur et al., 2011), which points to a Cretaceous origin of the group within the mega thermal rain forests of Laurasia (Boucot et al., 2013; Ying-Lim et al., 2022) and a subsequent dispersal across Gondwanan landmasses during a period of profound climate and vegetation changes (Collinson, 2000; Lupia et al., 1999). Fossil evidence on the distribution of Kuylisporites† (Mohr & Lazarus, 1994), which has close affinities with Cyathea, further supports this scenario. Paleobotanical evidence places Kuylisporites† in Asia, Europe, and North America during the Late Cretaceous, but in South and Central America until the Cenozoic (Mohr & Lazarus, 1994). The inferred Northern route of dispersal of Cyathea into South America disagrees with previous inferences (Korall & Pryer, 2014) and differs from the more recent Southern dispersal routes inferred for the other three genera in the Cyatheaceae (either from Africa or Australasia).
The fossil record and sampling bias
Fossils provide direct evidence about past distributions and have the potential to shed new light on the biogeographic history of clades (Hinojosa et al., 2015; Wood et al., 2013). Indeed, my results show that models of range evolution based solely on living species are unable to account for the past occupation of currently uninhabited regions. These results support the need to account for the impact of extinction in ancestral range reconstructions (Herrera-Alsina et al., 2022), but also of explicitly incorporating geographic information on past distributions. However, data from the fossil record are highly fragmentary and challenging to incorporate into biogeographic reconstructions while accounting for sampling and taphonomic biases.
Fossil-aware biogeographic reconstructions rest on the assumption that fossil sampling is informative and representative of the paleodistribution of lineages. Thus, it is important to ask whether the absence of fossils for a target lineage in a particular time and place is indeed a true reflection of its paleobiogeography. A major issue is the possibility of partially unknown (and unknowable) distribution of extinct taxa, leading to the need to surmise their probable, but unobserved, widespread distribution. As shown by the three-area reconstructions, uncertainty in paleodistributions leads to varying inferences on past occupancy and ancestral areas. It is possible that members of the Cyatheales had wider distributions, particularly early in their evolutionary history, but failed to fossilize or have not yet been recovered in specific regions.
By accepting varying degrees of uncertainty in paleodistributions, my results highlight the sensitivity of reconstructions to assumptions about the fossil data. Naively considering that fossil taxa inhabited all regions leads to highly uncertain ancestral ranges, yet assuming we have either a perfect or a poor depiction of paleodistributions (observed vs. unobserved) leads to substantially different reconstructions. Nonetheless, even with an incomplete portrayal of paleodistributions (uncertain), the available paleobotanical evidence is highly valuable and informs reconstructions. Additional information on the distribution of paleoclimates or vegetation types can be used to further constrain uncertainty in paleodistributions, for instance by scoring an area as ambiguous for a fossil taxon only when past conditions appear to have been suitable for occupancy.
One key feature of a strict exemplar approach is that it can be used to update previous accounts of the biogeography of lineages and inferences of ancestral states with additional fossil specimens, either from already included taxa or new taxa, especially when these challenge our prior beliefs on the biogeography of a given lineage. For instance, the inclusion of fossil specimens of Cyatheales from the Middle Jurassic of Mongolia (Kostina & Herman, 2013), the Paleocene of India (Saxena, 1980), the Late Jurassic of Russia (Markevich & Bugdaeva, 2014), and the Albian of Brazil (Portela et al., 2014) would significantly expand the known paleodistribution of the group.
It would be possible, in principle, to incorporate summarized distribution data from multiple specimens for a single named fossil taxon and account for its widespread geographic distribution. However, specimens assigned to the same taxon often come from different strata with different ages and poor temporal resolution (e.g., a fossil specimen dated to the Late Cretaceous). Subsuming multiple specimens into a single taxonomic unit leads to fossil species with geographically widespread distributions and broad stratigraphic (temporal) ranges. It is debatable whether all specimens for fossil taxa with such characteristics can be validly considered as a single species, raising the questions on the validity of the underlying definition of fossil species (e.g., the species recognition problem [Allmon, 2013; Maddison & Whitton, 2023]) and on the modes of speciation assumed by the analyses (e.g., asymmetric vs. symmetric speciation, sensu Stadler et al., 2018). The fossil taxa Kuylisporites walterbolkii† (Cyatheaceae) and Cyatheacidites annulatus† (Dicksoniaceae) are good examples of this issue, as both taxa have widespread geographic ranges over long stratigraphic (temporal) intervals of more than 50 million years (Hill et al., 2001; Mohr & Lazarus, 1994). A valid alternative would be to incorporate fossil taxa with multiple specimens into the analyses by treating each specimen as a distinct tip (or sampled ancestor) in the tree and enforcing topological constraints to maintain the fossil taxon’s monophyly.
Phylogenetic uncertainty in the placement of fossils can also have non-negligible impacts on the inferred biogeographic history. Many fossils are assigned to very broad taxonomic groups (e.g., Cyatheales), so the associated topological uncertainty will be large and propagate into the ancestral range reconstructions. Ideally, phylogenetic relationships can be inferred with a total evidence approach (Zhang et al., 2016), but high-quality morphological data are needed to make robust inferences (López-Martínez et al., 2023; Luo et al., 2019). This is a complex challenge because of the incomplete and fragmentary nature of fossil specimens, which is compounded in Cyatheales by the lack of comprehensive character matrices for extant members. Accordingly, many fossils had a high topological uncertainty in the FBD tree reconstruction; as was expected due to their loose constraints, several fossils attached to multiple branches with low frequency (Supplementary Figure S5).
Jointly inferring phylogeny and range evolution marginalizes state reconstructions over topological and age uncertainty (Landis et al., 2021), favoring tree topologies that are in harmony with the biogeographic data and model, and effectively restricting the placement of fossils to fewer branches with higher frequencies (e.g., Cyathea porospora†; Supplementary Data 7 and 8; Supplementary Figure S5). These results highlight the utility of a joint approach in cases when morphological data are absent or insufficient to infer fossil placement, while effectively reducing computational burden. However, joint inference approaches like the one implemented here are not methods for phylogenetic inference of fossil affinities and as such should not be considered surrogate to total evidence approaches; in the present case, fossil attachment is determined solely by its agreement with the biogeographical model, is sensitive to the size of the posterior sample of trees (both from the FBD and DEC models), and ultimately depends on prior topological constraints based on presumed taxonomic affinities.
The incorrect taxonomic assignment of fossil species can also mislead inferences on paleodistributions and range evolution. For instance, if a group of fossil taxa from a specific time period is incorrectly assigned to a given lineage under study, the associated distribution data will skew reconstructions toward the particular areas occupied by these fossils, but that otherwise were not occupied by that particular lineage at that specific time period. The degree of bias introduced will depend on the position and age of the “erroneous” fossils in the tree (either toward the base or the tips) and whether the associated area is shared with the rest of species. This problem is exemplified by the fossil genus Coniopteris† whose species appear toward the base of the tree fern phylogeny. Members of Coniopteris† have been traditionally placed within the tree ferns, but several species have been recently aligned with polypod ferns (Polypodiales) based on phylogenetic analyses (Li, Miao, et al., 2019). Assessing the relationship of Coniopteris† with either Polypodiales or Cyatheales is challenging as the key character supporting either placement (i.e., vertical and incomplete annulus vs. oblique and complete annulus) is missing for most specimens (Li, Miao, et al., 2019; Yuan et al., 2018). The majority of the oldest Coniopteris† specimens, which come from Antarctica, are missing these key reproductive characters, whereas several Laurasian specimens show the characteristic oblique (or nearly vertical) and complete annulus of the Cyatheales (Li, Miao, et al., 2019).
In this context, the fossil-aware reconstruction shows an early disjunct distribution between Eurasia and Antarctica, which is largely driven by the paleodistribution of Coniopteris†. This disjunction is consistent with a Gondwanan–Laurasian biotic corridor during the Lower Jurassic throughout ever-wet climates around the Tethys sea (Cirilli, 2010; Dolby & Balme, 1976; Mcintyre et al., 2017). However, apart from the Coniopteris† specimens with less-certain Cyathealean affinities, available paleobotanical evidence does not confidently support Gondwanan Cyatheales during the Lower Jurassic (Bose et al., 1990; Cirilli, 2010; Dolby & Balme, 1976; McLoughlin & Pott, 2009; Quattrocchio et al., 2001). In fact, Cyathealean tree ferns first appear confidently in Gondwanan landmasses toward the Middle Jurassic (Rees & Cleal, 2004) and start to be more frequent into the Late Jurassic–Early Cretaceous (Césari et al., 2001; Olivera et al., 2015; Portela et al., 2014; Villar de Seoane, 1999). This highlights how biases and uncertainty in fossil taxonomic affinities can propagate into ancestral range estimation. In this case, the probability of Antarctica as ancestral will likely drop if the oldest Antarctic Coniopteris† specimens were to be excluded from the analyses.
Conclusions
By combining paleontological and neontological distribution data for Cyatheales, I inferred a more complex biogeographical history than previously depicted based on the distribution of extant species alone. The Cyatheales are witness to the impacts that geographically biased extinctions can have on our capacity to infer ancestral geographic ranges and, very likely, other macroevolutionary trends. The present works not only show how integrating fossils into event-based biogeographic analyses substantially alter biogeographical inferences but also highlight the importance of several conceptual and methodological shortcomings of such an approach. Incorporating fossils into biogeographical analyses is feasible in practice, but this demands confronting several assumptions about taphonomic biases, paleodistributions, and the nature of fossil species. The fossil record is not without temporal, geographic, and phylogenetic bias, yet fossils alone hold information about past distributions and are highly valuable to inform models of range evolution and unveil hidden aspects of the biogeographic history of lineages.
Supplementary material
Supplementary material is available online at Evolution.
Data availability
All data and code used to perform the biogeographical and macroevolutionary analyses are available at https://github.com/spiritu-santi/Biogeography and in Zenodo with the identifier at https://zenodo.org/doi/10.5281/zenodo.8239493.
Conflict of interest: The author declares no conflict of interest.
Acknowledgments
The Zenil Lab at the University of Kentucky, the Laboratorio de Evolución Molecular y Experimental at Universidad Nacional Autónoma de México (UNAM), the Magallón Working Group at UNAM, and Angela P. Cuervo-Robayo for lending of computational resources; Rosana Zenil-Ferguson and Michael Landis for scripts to run the fossilized birth–death and dispersal–extinction cladogenesis analyses in RevBayes; Andrea López-Martínez for sharing scripts to run the rogue taxa analyses in R; and Carrie Tribble and Jaime Gasca Pineda for help setting up and troubleshooting RevBayes.
