


Abstract
Theoretical models predict that sympatric, ecological speciation may be facilitated more readily when so-called ‘magic traits’ are present, linking traits under divergent selection with assortative mating. Such traits might be encoded by pleiotropic genes, that is, genes that affect multiple, apparently unrelated, phenotypes. However, few convincing examples of sympatric speciation exist, and empirical evidence for the role of magic traits in driving such speciation is rare. One of the strongest cases of sympatric speciation is the Howea palms of Lord Howe Island, Australia, comprising the sister species Howea belmoreana and Howea forsteriana, which have diverged due to soil substrate preferences and flowering time displacement. Here we investigate the role that pleiotropy may have played in the speciation process by carrying out high-throughput phenotyping experiments using 1830 Arabidopsis thaliana plants with knockouts of candidate Howea ‘speciation genes’. We identify several genes that show signatures of adaptive divergence between the Howea species and demonstrate pleiotropic roles in soil stress tolerance and flowering time, consistent with the Howea speciation scenario—notably, Howea orthologues of the A. thaliana loci At2-MMP, DCL1, RCD1, SAL1, and SIZ1. Empirical evidence is provided, therefore, for a range of pleiotropic genes with the potential to have driven sympatric speciation by generating magic traits which link divergent selection to non-random mating.
INTRODUCTION
In speciation biology, particularly in the study of speciation with gene flow, a key objective is to identify the genomic mechanisms that underpin species divergence (Wu 2001, Butlin 2008, Jones et al. 2012, Cruickshank and Hahn 2014, Riesch et al. 2017, Foote 2018, Richards et al. 2019). Genomic studies suggest that during speciation with gene flow, regions of differentiation between species are often restricted to a small number of loci (Chapman et al. 2013, Poelstra et al. 2014, Seehausen et al. 2014, Malinsky et al. 2015, Marques et al. 2016, Westram et al. 2018, Papadopulos et al. 2019a, Kautt et al. 2020). This is consistent with theoretical predictions that a limited number of large-effect loci, which link assortative mating and adaptive divergence, are more likely to facilitate speciation with gene flow than a larger number of small effect loci acting cumulatively (Gavrilets 2004, Servedio et al. 2011, Smadja and Butlin 2011).
One scenario in which this may occur is ecological speciation, whereby initial local adaption to different environments can lead to divergent selection and ultimately reproductive isolation (McKinnon et al. 2004, Rundle and Nosil 2005, Funk et al. 2006, Schluter 2009, Nosil 2012, Osborne et al. 2013). There are several mechanisms which could facilitate this. Firstly, colonization of a new environment may lead to local adaptation of a trait at a single locus, which pleiotropically also affects reproductive traits. Such so-called ‘magic traits’ (see Fig. 1A) can lead to adaptive divergence, contribute to non-random mating, and may be frequently involved in speciation processes (Gavrilets 2004, Servedio et al. 2011). Alternatively, loci involved in adaptive divergence in an incipient species may be non-randomly associated with reproductive traits through linkage disequilibrium (Servedio et al. 2011; Fig. 1A).
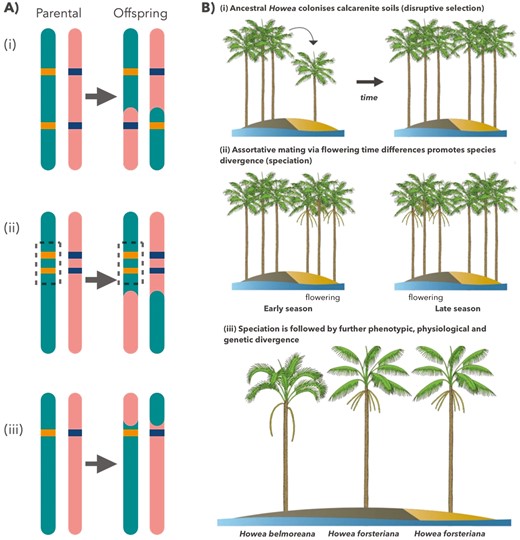
A, alternative genetic mechanisms of sympatric speciation in Howea palms: (i) alleles for stress tolerance and altered flowering time (orange) are located at independent loci on the parental chromosome. Recombination (arrow) breaks up the allele combination in gametes, homogenizing populations and preventing speciation; (ii) alleles for stress tolerance and altered flowering time (orange) are located at tightly linked loci (linkage disequilibrium). Recombination fails to segregate alleles, leading to divergence and potential sympatric speciation; (iii) a single allele (orange) pleiotropically confers stress tolerance and flowering time displacement. Traits cannot be segregated during meiosis, leading to ecological divergence and potential sympatric speciation. B, speciation scenario in Howea palms: (i) ancestral Howea colonizes calcarenite deposits, resulting in disruptive selection via adaptation to environmental stresses and triggering flowering time differences; (ii) assortative mating via displacement of flowering phenology promotes reproductive isolation; (iii) further divergence arises after speciation.
The search for these major effect loci is crucial for advancing our understanding of the mechanisms driving speciation with gene flow. This is particularly true with regards to sympatric speciation, which involves divergence of an ancestral population into multiple new species without any geographical separation of the incipient lineages. It is characterized by overlapping ranges and random mating, with ongoing gene flow during the initial stages of speciation, but its prevalence remains an area of debate, with few convincing examples. However, theoretical studies suggest that speciation can occur in sympatry with initial gene flow (Dieckmann and Doebeli 1999, Kondrashov and Kondrashov 1999, Doebeli et al. 2005, Bolnick and Fitzpatrick 2007, Gavrilets and Vose 2007), and that sympatric speciation may be induced far more readily where a magic trait is present (Dieckmann and Doebeli 1999, Gavrilets 2004).
One of the most convincing examples of sympatric, ecological speciation is found in the palm genus Howea (Savolainen et al. 2006a, Gavrilets and Vose 2007), where divergence between the two extant species appears to have been the result of adaptation to soil type and an associated shift in flowering time (Savolainen et al. 2006a). The two species, Howea belmoreana (the curly palm) and Howea forsteriana (the kentia or thatch palm), are endemic to the minute Lord Howe Island (c. 15 km2), which was formed from volcanic activity around 6.9 Mya (McDougall et al. 1981). It is located in the Tasman Sea, 580 km from the eastern coast of Australia, the closest land mass. Other than Ball’s Pyramid, a sea stack located 23 km southeast of Lord Howe Island which supports limited plant life (Savolainen et al. 2006a), there are no islands nearby. This geographical setting makes for an ideal system to study sympatric speciation, as the small size of the island and its isolation from other land masses make an allopatric phase during speciation unlikely (McDougall et al. 1981, Savolainen et al. 2006a, 2006b, Papadopulos et al. 2014). Coalescence analyses further demonstrated that speciation occurred in the face of high gene flow (Osborne et al. 2019, Papadopoulos et al. 2019b).
Today on Lord Howe Island, H. belmoreana and H. forsteriana have overlapping distributions, dictated by the two predominant soil types on the island. Both H. belmoreana and H. forsteriana are found on volcanic soils across the island, whereas H. forsteriana also inhabits more recently deposited calcareous soils (Brooke et al. 2003), where H. belmoreana is absent. These soils have been found to differ in a range of characteristics: for example, calcarenite has higher concentrations of arsenic, boron, calcium, cadmium, sodium, phosphorus, and sulphur than volcanic soil, and possesses a higher pH and lower water content than volcanic soil (Osborne et al. 2019). Conversely, volcanic soils contain higher concentrations of aluminium, cobalt, chromium, copper, iron, potassium, manganese, nickel, and zinc (Osborne et al. 2019). The two soil types are highly intercalated, with the species often occurring in sympatry (Pickard 1983, Savolainen et al. 2006a).
The two species also differ in flowering time, with H. forsteriana flowering earlier than H. belmoreana, and peak flowering time of each species being separated by approximately 6 weeks (Savolainen et al. 2006a). It is hypothesized that colonization of calcarenite by H. forsteriana may have led to divergence from H. belmoreana through local adaptation to exogenous edaphic stress (Papadopolous et al. 2013; Fig. 1B), which was also associated with a shift in flowering time, generating assortative mating, and driving speciation (Savolainen et al. 2006a, Dunning et al. 2016, Hipperson et al. 2016). In this scenario, it is likely that local adaptation for stress tolerance evolved first, resulting in ecological disruptive selection, and was associated with a near-simultaneous shift in flowering time. This could have occurred through the mechanisms of pleiotropy, linkage disequilibrium, or a plastic response in flowering time which later became canalized (Pfenning et al. 2010).
Previous studies by Dunning et al. (2016) and Osborne et al. (2019) utilized RNA-seq data from various individuals and tissues across both species to analyse differential gene expression, assess genetic divergence, and identify genes under positive selection. In both studies, genes that were differentially expressed between the species, genes which exhibited shifted expression levels in the phylogenetic branches leading to each species, and/or genes under positive selection, were enriched for functions related to soil adaptation, abiotic stress tolerance, and flowering time. Furthermore, in both studies, the authors identified a range of candidate ‘speciation genes’ with the potential to have pleiotropically contributed to both soil substrate adaptation and displaced flowering time during Howea speciation.
A list of 13 putative speciation genes was compiled by Osborne et al. (2019), containing several of those also identified by Dunning et al. (2016) (Supporting information, Table S1). These candidate speciation genes have likely undergone adaptive divergence in Howea (i.e. significantly differential expression between the two species, shifted expression levels in the phylogenetic branches leading to each species, or evidence that the genes are under positive selection). The focus of the present study is to test the hypothesis that these genes act as pleiotropic loci affecting both soil stress tolerance and flowering time under conditions consistent with the Lord Howe Island scenario. If confirmed, this would affirm the viable role of magic traits in facilitating sympatric speciation within this system. To investigate the function of these candidate speciation genes in the ecological speciation of Howea, one would ideally carry out loss-of-function and/or over-expression assays in Howea palms grown on different soil substrates. However, the long generation time of the palms—spanning several years—makes this approach highly challenging. Therefore, we conducted high-throughput phenotyping experiments using 1830 Arabidopsis thaliana plants with T-DNA knockouts in orthologues of the candidate speciation genes identified in the palms.
MATERIAL AND METHODS
T-DNA knockouts of 11 A. thaliana orthologues of the Howea speciation genes (two pairs of the 13 Howea candidates map to single Arabidopsis loci, resulting in only 11 A. thaliana genes) were grown under drought, salt, and cadmium stress treatments—reflecting the abiotic stresses characteristic of calcareous soils on Lord Howe Island (Osborne et al. 2019)—at the Finnish National Plant Phenotyping Infrastructure, University of Helsinki. State-of-the-art technology at the centre, including automated visible light RGB, infrared, and chlorophyll fluorescence imaging systems, makes it possible to track a broad range of morphometric parameters and measure fine-scale stress response in extreme detail. By combining this high-throughput phenotyping with measurements of flowering time, rigorous assessment was made of the pleiotropic role that each of the candidate speciation genes may play in both soil stress tolerance and flowering time displacement. This approach enables us to assess the role of candidate genes in driving the sympatric speciation of Howea palms. We use the following nomenclature: gene names are italicized and capitalized, and knockout mutants are written in italicized lowercase.
Mutant lines
Mutant and wild type Columbia (Col-0) lines of A. thaliana were obtained from the European Arabidopsis Stock Centre (NASC). Col-0 is a widely used wild type accession. All lines were selected from the SALK collection, with T-DNA insertion mutants chosen from the confirmed homozygous SALK stock in a Col-0 background (Supporting information, Table S2). One knockout line per candidate gene was chosen, for a total of 11 mutant accessions in addition to the wild type.
Homozygosity of T-DNA insertions was confirmed via PCR using SALK T-DNA specific primers, following DNA extraction using DNeasy extraction kits (Qiagen, Manchester, UK). When visualized on agarose gels, PCR products homozygous for the T-DNA insert produce a single band at least 200 base pairs shorter than wild type controls, with heterozygous lines producing both fragments. Primer pairs are shown in Supporting information, Table S3. Knockout of expression of the wild type gene for each mutant line was confirmed by RT-PCR following RNA extractions using OneStep RT-PCR (Qiagen, Manchester, UK) kits and purification with Invitrogen Turbo DNA-free (Thermo Fisher Scientific, Massachusetts, USA). When visualized on agarose gels, PCR products for lines in which expression of the relevant wild type gene has been suppressed display no fragment, as opposed to wild type controls where the fragment is present. All mutant lines were confirmed as homozygous for the T-DNA insert with expression of the wild type gene knocked-out.
Experimental set-up
Seeds were sown in bulk on Kekkilä Young Plant Mix (W HS R8017, Kekkilä-BVB Oy, Vantaa, Finland) and vernalized at 4 °C for 3 nights in order to ensure synchronous germination and flowering. After vernalization, seedlings were transferred to a FytoScopeTM walk-in growth chamber (Photon Systems Instruments, PSI, Drásov, Czech Republic) at the Finnish National Plant Phenotyping Infrastructure at the University of Helsinki and grown under long-day lengths (16-hour days, 8-hour nights), at 23 °C, 60% humidity, and photon irradiance of 130 μmol m-2 s-1. Eight days after stratification, seedlings were transplanted to individual pots filled with 50 g Kekkilä Young Plant Mix.
The PlantScreenTM Compact System at the National Plant Phenotyping Infrastructure allows for up to 18 trays of plants to be grown simultaneously on a conveyor belt system which facilitates automated weighing, watering, and imaging. Each of these 18 trays can hold up to 20 individual plant pots. We chose to use 18 plants per tray with the two centre positions left empty, as this improves air circulation which is beneficial for protocols involving water deprivation treatments. A total of up to 324 plants could therefore be assayed per round.
Experiments were carried out over six rounds, with genotypes split into three groups, and each group used in two experimental rounds (Col-0 wild type plants were included in every round). Group 1 contained Col-0 plants (hereafter referred to as Col-0 1), alongside siz1, rcd1, dcl1, ugt87a2, and tic knockout mutants, under control, drought, and salt treatments. Group 2 contained Col-0 (hereafter Col-0 2), alongside dcl4, sal1, nac072, and vel1 knockout lines, also under control, drought, and salt treatments. Group 3 contained Col-0 (hereafter Col-0 3), with akr4c9 and at2-mmp knockout lines, grown under control, drought, salt, and cadmium treatments. Group 1 plants were distributed in a randomized block design, with one plant of every genotype × treatment combination positioned randomly in every tray. Groups 2 and 3 used completely randomized designs across all trays. The total number of replicates for every genotype × treatment combination was between 35 and 50 (each Col-0 group treated as an independent genotype in this regard, rather than one pooled Col-0 group across all rounds; Supporting information, Table S4).
Stress treatments
For each experimental run, soil water holding capacity was determined by fully saturating 10 pots filled with soil, weighing the pots, allowing them to drain for 2 h, and then drying overnight at 80 °C before reweighing. For control, salt, and cadmium treatments, pots were dried to 70% field capacity and maintained at this moisture content throughout the duration of the experiment by automated daily weighing and watering of individual pots. Additionally, for salt treatment, 20 ml of 250 mM NaCl solution was added to pots using a syringe 10 days after stratification. For cadmium treatment, 20 ml of CdCl2 solution was instead added 10 days after stratification at a concentration of 140 mg/l to produce an estimated final soil concentration of 100 mg/kg. Control plants were supplemented with 20 ml of water. Pots for drought treatment were instead left to dry further, until they reached 25% field capacity. Daily weighing and watering allowed maintenance of drought at this level.
Plant phenotyping
Flowering time for every plant was assessed by the number of leaves at the point of bolting, following Pavicic et al. (2017). Bolting transition, as measured by rosette leaf numbers, is a robust indicator of the start of reproductive phase change in A. thaliana (Pouteau and Albertini 2009), with fewer rosette leaves at bolting equating to an earlier shift into the reproductive phase.
To quantify stress response, every tray was imaged daily by top-view visible light RGB, infrared, and chlorophyll fluorescence cameras. This was carried out for a duration of 10 days following the imposition of stress treatments 10 days after stratification. PlantScreenTM Data Analyser software uses a binary mask to distinguish the plant from the background soil and tray, and uses RGB images to automatically calculate morphometric parameters of Rosette Area, Perimeter, Isotropy, Eccentricity, Rotational Mass Symmetry (RMS), Slenderness Of Leaves (SOL), Compactness, Roundness 1 and Roundness 2 (PlantScreenTM DataAnalyzer, PSI). These parameters are described in detail in Pavicic et al. (2017), but in brief: Rosette Area and Perimeter are growth parameters and are calculated based on raw pixel counts taken from binary images and translated to millimetres; Isotropy, Roundness 1, and Roundness 2 are morphological parameters that describe the circularity of plants; Eccentricity and RMS describe plant symmetry; Compactness and SOL give information about petiole and leaf length, and leaf width. Acclimation as well as adaptation to environmental conditions can lead to altered plant morphology. Infrared imaging captures the mean surface temperature of the plants, which can be used as an indicator to detect mutants with altered stomatal control, as transpiration causes leaf cooling (Merlot et al. 2002). For example, plants produce the hormone abscisic acid in response to drought stress, which triggers closure of stomatal pores in order to conserve water by reducing transpiration (Merlot et al. 2002). A reduced ability to close stomata is therefore characterized by a lower temperature. Chlorophyll fluorescence imaging can be used to measure the activity of photosystem II in a dark-adapted state through QY Max (also known as Fv/Fm). QY Max is a measurement of the maximum quantum yield of photosystem II within plant tissue, and is a common indicator of plant stress (Baker 2008, Woo et al 2008), with lowered values typically associated with stress (Kitajima and Butler 1975, Maxwell and Johnson 2000).
Statistical analyses
All statistical analyses were carried out using R software, v.4.0.2 (R Core Team 2022). In all analyses, knockout genotypes were compared only with Col-0 plants from the same experimental group in order to control for variation between rounds. Flowering time was analysed by fitting a linear mixed model to the leaf number data using the lmer function in the R package lme4 (Bates et al. 2015) with genotype as a fixed effect, and treatment, experimental round, tray position in the growth chamber, and position of the plant within the tray as random effects. The contrast function in the package lsmeans (Lenth 2016) was then used to make pairwise comparisons of means between knockout lines and the wild type with Dunnett correction for multiple testing.
Stress response was analysed by fitting linear mixed effects models to loge(x) transformed data from the final day of imaging (20 days after stratification), for each phenotyping parameter and each combination of stress treatment plus control, and single knockout plus wild type, in turn. For example, one model for Rosette Area under drought and control treatments for akr4c9 and Col-0 3 plants, another for Compactness under salt and control treatments for siz1 and Col-0 1 plants, etc. Models were produced using the lmer function from the lmerTest package (Kuznetsova et al. 2017), with genotype, treatment, and their interaction as fixed effects, and tray position and position of plants within the tray as random effects.
Such models allow computation of ANOVA interaction terms to assess whether the response of a trait under stress vs. control treatment differs for a given genotype in comparison to wild type plants, taking into account the value of the relevant phenotypic trait under control conditions. This is necessary due to phenotypic differences existing among genotypes even under control conditions. Therefore, simply measuring differences under stress conditions without taking pre-existing differences into account would fail to measure stress response. Additionally, by first loge(x) transforming data, additive interaction terms in the transformed data are equivalent to multiplicative interactions in the non-transformed dataset. This means that significant loge(x) interactions describe differences in the proportional change in the value of a trait between treatments for a given knockout and wild type, thereby controlling for pre-existing phenotypic differences.
RESULTS
Flowering time
Of the 11 knockout lines investigated, four were found to flower significantly earlier than wild type plants. The four knockout mutants were dcl1 (P < 0.0001), at2-mmp (P = 0.0001), rcd1 (P < 0.0001), and siz1 (P < 0.0001). One Knockout Mutant, Sal1, Showed Severely Delayed Flowering Under All Conditions, With A Mean Of 29.67 Leaves Under Control Conditions, In Comparison To 12.88 Leaves For Col-0 2 Plants Under Control Conditions. With such a clear displacement in flowering time, sal1 was excluded from the linear model fitted to leaf number data in order to improve fit of the model. No significant difference was found in flowering time between Col-0 and any of the remaining knockout lines. Least squares mean numbers of rosette leaves for all lines other than sal1 are shown in Figure 2. Full flowering time test statistics available in Supporting information, Table S5. Raw flowering time data is available in Supporting information, Table S6.
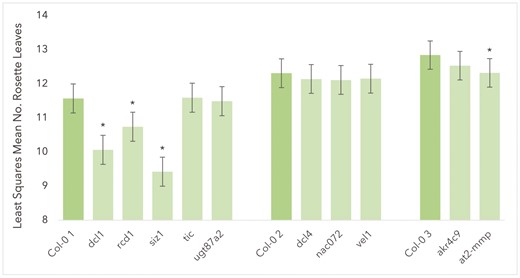
Estimated least squares means for number of rosette leaves at bolting for all Col-0 plants and knockout lines excluding sal1 (excluded from model to improve fit due to severely delayed flowering time). Asterisks represent significant difference in means between knockout genotype and Col-0 plants from the relevant experimental group (P < 0.0001 in all significant cases). Error bars show standard error.
Morphological and physiological variation
Several of the knockout lines demonstrated morphologies and physiologies notably different to wild type across each of the treatment conditions. For example, the knockout mutant sal1 showed a condensed rosette with rounder, waxy-appearing leaves in comparison to Col-0 2 across all treatments. Photos of representative phenotypes for each genotype under control, drought, and salt conditions are shown in Figure 3.
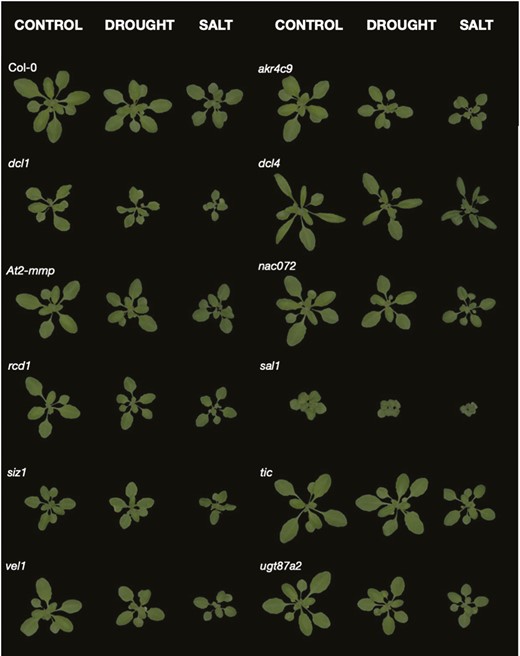
Representative phenotypes of knockout lines and Col-0 wild type under control, drought, and salt conditions.
For all genotypes, Rosette Area and Perimeter were smaller under drought than control conditions, and smaller still under salt conditions. Rosette Area and Perimeter under cadmium treatments were similar to those in drought conditions. Rosette Area and Perimeter increased exponentially over time in all treatments and genotypes, with the exception of knockout mutant sal1, which showed flatter growth, especially under salt conditions (Fig. 4).
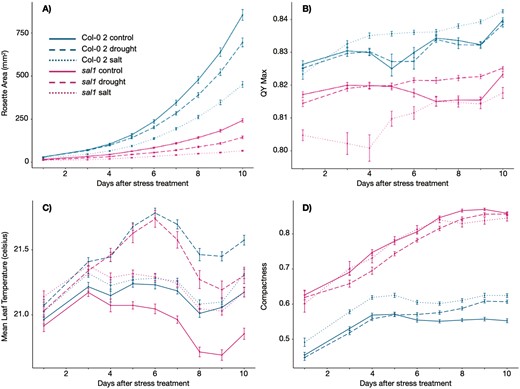
Measurements of phenotypic traits over time for sal1 and Col-0 2 wild type plants. Solid lines represent plants grown under the control treatment; dotted lines represent salt treatment; dashed lines represent drought treatment. Panels show phenotypic traits as follows: (A) Rosette Area (mm2); (B) QY Max; (C) Mean Leaf Temperature (ºC); (D) Compactness. In all charts, the x-axes show days from imposition of stress treatments. Error bars show standard error. Stress response varied over time in sal1 vs. Col-0 2. For example, QY Max for sal1 under salt treatment decreased for the first 4 days following stress treatment, and was always lower than QY Max for drought and control. Conversely, for Col-0 2, QY Max under salt conditions increased over time, and was higher than under drought and control conditions.
For wild type plants under control and drought conditions, QY Max increased over time, indicative of increasing maximum quantum yield of photosystem II. Under salt conditions, QY Max in Col-0 increased sharply over the first 3–4 days (13–14 days after stratification) following the start of treatments, then plateaued until around 18–19 days after stratification, before sharply rising again. Peak QY max under salt conditions was higher than control, drought, and cadmium treatments in all genotypes other than akr4c9 (where it was higher than control, but lower than drought), and sal1, where peak QY Max was lowest under salt conditions (see Fig. 4). For wild type plants, QY Max decreased slightly over time under cadmium treatment, with a peak markedly lower than all other conditions.
For all genotypes and treatments, Mean Leaf Temperature rose sharply over the first 3 days following imposition of stress treatments at 10 days after stratification. Temperature continued to rise further for plants grown in drought conditions, with a peak far higher than other treatments at around 16 days after stratification, indicating closure of stomata and reduced transpiration. Figure 4 shows time series measurements for sal1 knockout mutants vs. the wild type over 10 days following stress imposition, for Rosette Area, QY Max, Mean Leaf Temperature, and Compactness, demonstrating the significant variation in phenotypes between Col-0 2 and sal1. Time-series charts for the remaining phenotypic imaging parameters and other genotypes are provided in Supporting information, Figures S1–S11.
Knockout stress response
At 10 days after imposition of stress treatments, significant multiplicative interactions in at least one measured trait across control and stress conditions were found between Col-0 and every knockout line other than nac072. Figure 5 summarizes these findings as a heatmap of F-statistic test results for ANOVA interaction tests of loge(x) transformed stress phenotype measurements, including annotation of tests where P < 0.05. A summary of flowering time results is shown alongside the stress response heatmap to provide a consolidated view of assays (Fig. 5). Full test statistics can be seen in Supporting information, Table S6. Raw data from automated imaging is available in Supporting information, Tables S7 and S8.
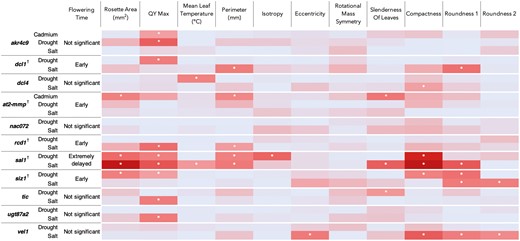
Heatmap showing summary results for ANOVA interactions tests of loge(x) transformed stress phenotype measurements taken 10 days after stress imposition. Summaries of flowering time results also displayed. Knockout mutants differing significantly from wild type in both flowering time and stress response are denoted by †. Colour scale based on F-value test statistics, with dark red indicating the highest F-values, pale blue the lowest F-values. Values shown are comparisons between each knockout genotype and Col-0 wild type, and between control and either cadmium, drought, or salt treatment. Cells with asterisk indicate interaction test F-values where P < 0.05; with sal1 and siz1 demonstrating the greatest number of P < 0.05 interactions and thus differing most significantly from wild type in measured stress response. Full test statistics available in Supporting information, Table S6.
For QY Max, seven knockout genotypes showed significant multiplicative interaction in at least one stress treatment vs. Col-0 and control conditions. There were four such genotypes for each of Perimeter, Compactness and Roundness 1; three for Rosette Area and SOL; two for Mean Leaf Temperature and Roundness 2; and one for Isotropy and Eccentricity. No significant multiplicative interactions were found for RMS between knockout genotypes and Col-0 in any stress treatment vs. the control.
Knockout mutants of SAL1 and SIZ1 differed most from Col-0 with respect to significantly different proportional changes across a range of phenotypic traits between control and stress conditions. Significant multiplicative interactions between sal1 and Col-0 2 were found for QY Max (P = 0.01867), Rosette Area (P = 0.000265), Perimeter (P = 0.0242), Compactness (P < 0.0001), and Isotropy (P < 0.0001) between control and drought conditions, and for QY Max (P < 0.0001), Mean Leaf Temperature (P = 0.04075), Rosette Area (P < 0.0001), Perimeter (P = 0.003542), Compactness (P = <0.0001), SOL (P < 0.0001), and Roundness 1 (P < 0.0001) between control and salt conditions.
For knockout mutant siz1 vs. Col-0 1, significant interactions were found for QY Max (P = 0.04969), Rosette Area (P = 0.01611), Compactness (P = 0.02484), and Roundness 1 (P = 0.0007965) between control and drought conditions, and for Roundness 1 (P = 0.006767) and Roundness 2 (P = 0.01217) between control and salt conditions. Details of the phenotypic stress responses and significant multiplicative interactions for the remaining knockout lines can be seen in Figure 5 and in Supporting information, Table S6.
DISCUSSION
Knockout mutants of At2-MMP, DCL1, RCD1, SAL1, and SIZ1 displayed pleiotropic phenotypes pointing to their potential roles as ‘speciation genes’. Each of these knockouts showed both displaced flowering time and altered soil stress response under conditions consistent with the speciation scenario of Howea. The strength of evidence for each of these five Arabidopsis loci is discussed below, whereas the evaluation of the remaining genes (i.e. those which did not demonstrate differential flowering time) is available as Supporting Information.
At2-MMP
Our results indicate a role for At2-MMP in response to cadmium-induced stress, with proportional changes in Rosette Area, Perimeter, and SOL being significantly different between At2-MMP knockout mutants and Col-0 under control and cadmium treatments. All parameters were lower for the knockout mutant at2-mmp than Col-0 3 under cadmium treatment, but marginally higher than Col-0 3 under control conditions. These results are in agreement with Golldack et al. (2002), who found that in rosette leaves, exposure to cadmium increased the transcript level of At2-MMP, while expression was unaffected by NaCl.
Golldack et al. (2002) also showed that at2-mmp knockout mutants flowered later than the wild type under short-day conditions, and Zhao et al. (2017) found that overexpression mutants of At2-MMP flowered earlier than the wild type under short-day conditions. Conversely, we found that at2-mmp flowered earlier than Col-0 under long-day conditions. Whilst these results appear contradictory, photoperiod significantly alters Arabidopsis flowering time. For example, vel1 knockout mutants have been shown to display delayed flowering in short-day conditions, but flower similarly to the wild type under long day conditions (Kim and Sung 2010; also in the present study). Overall, our results show a clear pleiotropic role for At2-MMP in both flowering time and response to cadmium.
DCL1
Consistent with the phenotype observed by Gasciolli et al. (2005), knockout dcl1 plants exhibited smaller rosettes compared to wild type plants, with notably distorted leaf morphology (Fig. 3).We found evidence for the involvement of DCL1 in both drought and salt stress response, particularly through dcl1 mutants possessing significantly lower QY Max than Col-0 1 under drought conditions, despite showing similar QY Max under control conditions—indicative of greater drought stress in dcl1. This is consistent with Bai et al. (2012), who found that the DCL1 homologue in Solanum lycopersicum was expressed in response to drought stress.
Under our growth conditions, dcl1 mutants possessed significantly fewer leaves than Col-0 1 at bolting (P < 0.0001), indicative of earlier flowering time. Fewer leaves were present in all treatment conditions. Previous studies have shown that in the Landsberg accession (rather than Col-0), mutations in DCL1 instead result in a slight delay in flowering time (Ray et al. 1996, Liu et al. 2004). Differences in alleles which affect flowering time are known to exist between the Landsberg and Col-0 genetic backgrounds (Lee et al. 1994), and contrasting reports on flowering time in different backgrounds have been seen previously. For example, Hall et al. (2003) reported that tic mutants (see Supporting Information for evaluation of tic in the present study) in the C24 ecotype flowered earlier than wild type plants under both long- and short-day conditions, whereas Sanchez-Villarreal et al. (2013) showed that tic mutants in a Col background flowered significantly later than the wild type under long-day conditions. Further investigations are warranted. However, regardless, the combination of evidence for a role in drought tolerance, and the earlier flowering time found here, indicates a pleiotropic effect for DCL1 relevant to the Howea speciation scenario.
RCD1
Consistent with Ahlfors et al. (2004), we found that rcd1 mutants were smaller than wild type plants, possessed altered rosette morphology, and flowered earlier than Col-0. Ahlfors et al. (2004) also reported a possible role for RCD1 in drought tolerance through interaction with partner proteins involved in gene expression changes in response to drought. Whilst the phenotype of rcd1 mutants in our experiments differed in several traits from that of Col-0 under drought conditions (see Supporting information, Fig. S6), our measured parameters did not identify a significantly different proportional change in phenotype between control and drought conditions in rcd1 compared with Col-0 1.
We did, however, find proportional changes in QY Max and Perimeter between control and salt treatments which differed significantly between rcd1 and Col-0 1, indicating a role for rcd1 in salt stress response. Katiyar-Agarwal et al. (2006) found that germination in rcd1 mutants was inhibited under NaCl induced salt stress in comparison to Col-0, and that rcd1 seedlings grown on agar media supplemented with 75 mM NaCl exhibited stunted growth relative to Col-0. Between these results and the earlier flowering of rcd1 mutants, RCD1 is a strong candidate ‘speciation gene’.
Howea homologues of SAL1 and SIZ1 provide the strongest evidence for a role in speciation
In the search for magic traits that may facilitate sympatric speciation, it is crucial to consider the effect size of a locus, including the strength of divergent selection and the extent of assortative mating it imposes during ongoing gene flow (Servedio et al. 2011, Haller et al. 2012). Even when a magic trait is present, if the effect size is weak, its role in driving speciation may be trivial or negligible (Haller et al. 2012). While knockout mutants of At2-MMP, DCL1, RCD1, SAL1, and SIZ1 all exhibited altered flowering times and provided evidence of a role in abiotic stress response, the effect sizes varied among the genes. Specifically, knockouts of SAL1 and SIZ1 showed notably larger effect sizes compared to the other candidate genes, with SAL1 mutants displaying the latest flowering phenotypes and SIZ1 mutants the earliest. Both loci also showed clearly altered responses to both salt and drought stress treatments across a range of measured parameters (Fig. 5).
Knockout mutants of SAL1 flowered several weeks later than Col-0 2 in all treatment conditions, consistent with the late flowering phenotypes reported by Xiong et al. (2001) and Dunning et al. (2016). Alongside this, sal1 mutant plants possessed a strikingly altered rosette morphology, being far smaller and more compact than wild type plants and having far more rounded leaves (Fig. 3). Notably, we found evidence consistent with Wilson et al. (2009), who reported increased drought tolerance in the same sal1 T-DNA knockout line as used here (SALK_020882). Under drought conditions, QY Max in sal1 was actually higher than under control conditions, whereas for the wild type, QY Max was marginally lower than under control conditions. We also found evidence to suggest that SAL1 plays a role in salt stress tolerance, consistent with Quintero et al. (1996). QY Max for sal1 was significantly lower under salt conditions than control conditions, whereas for all other genotypes QY Max was higher under salt conditions. Together with the displaced flowering time, these results make SAL1 a strong putative speciation gene.
For SIZ1 knockout mutants, flowering was significantly earlier than Col-0 1 plants, consistent with the results of Jin et al. (2008), who found that siz1 mutants flowered earlier than the wild type under both long- and short-day lengths. Knockout siz1 plants also demonstrated a clearly altered morphology consistent with both Catala et al. (2007) and Jin et al. (2008), characterized most noticeably by a far smaller rosette and smaller leaves. We found evidence that SIZ1 plays a role in drought tolerance, with both absolute and proportional QY Max lower under drought conditions for siz1 than the wild type. Survival assays carried out by Catala et al. (2007) found that siz1 mutants were far less resilient to water deprivation than wild type plants. Similarly, overexpression of SIZ1 in both dicots and monocots confers enhanced tolerance to multiple stresses including drought and salt (Li et al. 2013, Mishra et al. 2017, 2018). The evidence presented in the present study is highly concordant with these previous results, and highlights SIZ1 as a strong candidate speciation gene.
To further assess the role these loci may have played in facilitating sympatric speciation in Howea, the nature of evidence for adaptive divergence was investigated. For each of the two Howea candidate genes which mapped to SIZ1, previous work by Osborne et al. (2019) had identified a significant shift in expression in the floral tissue of H. forsteriana, through EVE branch expression shift tests (Rohlfs and Nielsen 2015). Additionally, for both Howea loci, expression in each of the inflorescence, leaf, and root tissues was higher in H. forsteriana than H. belmoreana (Fig. 6; unpublished data from Osborne et al. 2019). In inflorescence tissues, the two loci Cluster-5248.1858 and Cluster-5248.2018 (see Osborne et al. 2019) had 1.54-fold and 1.57-fold greater expression in H. forsteriana than H. belmoreana, respectively.
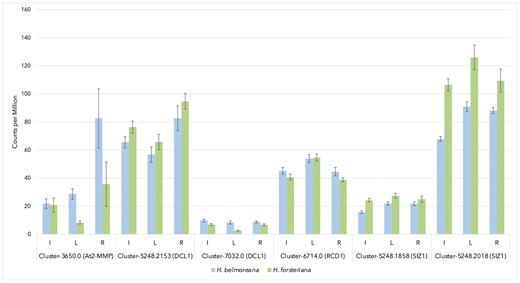
Expression levels (in read counts per million) of Howea orthologues of the Arabidopsis knockout genotypes which demonstrated both significantly altered flowering time and stress response phenotypes in comparison with wild type (unpublished data from Osborne et al. 2019. Excludes A. thaliana locus SAL1, for which the transcriptome used by Osborne et al. did not resolve a putative orthologue). ‘I’ indicates expression in inflorescence tissues, ‘L’ leaf tissues, ‘R’ root tissues. Error bars show standard error.
Such expression patterns reinforce the evidence that these loci could have facilitated sympatric speciation by generating magic traits. Knockout of SIZ1 in A. thaliana caused reduced drought tolerance, consistent with H. belmoreana showing lower expression of the two SIZ1 homologues and being incapable of colonizing calcareous soils.
For SAL1, Dunning et al. (2016) found significantly increased expression of the Howea orthologue in leaf and floral tissues of H. belmoreana relative to H. forsteriana. Increased drought tolerance in SAL1 knockouts is consistent with the Lord Howe Island speciation scenario, with H. forsteriana demonstrating lower expression of the SAL1 orthologue, and able to colonize calcareous soils, which are likely associated with drought stress (Osborne et al. 2019). The reduced salt tolerance of SAL1 knockouts is less consistent with the Howea scenario, given calcareous soils likely also cause salt-induced stress (Osborne et al. 2019). Overall evidence for this locus driving sympatric speciation is, therefore, slightly less clear cut, but still strong.
Such evidence, for both SAL1 and SIZ1, is significant, as the key remaining question in the Howea speciation scenario is the identification of a specific genetic mechanism capable of driving sympatric divergence with gene flow. This question also extends into the wider field of speciation biology, where empirical evidence of the genetic architecture behind sympatric speciation is scant. Examples exist within cichlid radiations, such as the work carried out by Kautt et al. (2020) in identifying a range of monogenic and polygenic traits that likely drove divergence in the Midas cichlids of Central America. This included potential magic traits, arising, for example, from monogenic loci controlling the dark/gold coloration morphs and the hypertrophied lip trait, which contribute to trophic specialization and assortative mating. However, the authors found that population divergence between these ecotypes was low and likely unstable, and concluded that these magic traits probably did not drive sympatric speciation. Additionally, cichlid radiations have repeatedly been shown to have experienced introgression from secondary contact (Malinsky et al 2015, Martin et al. 2015, Kautt et al. 2016, 2020, Meier et al. 2017, Poelstra et al. 2018), raising the question of whether they satisfy strict definitions of sympatric speciation.
Convincingly demonstrating the role of pleiotropic genes in Howea speciation, which link divergent selection and assortative mating, would, therefore, be arguably the most robust example to date of the genetic architecture behind sympatric speciation. The work presented here makes progress in this area, identifying a range of genes which have undergone adaptive divergence in Howea and demonstrate major effect pleiotropic phenotypes in A. thaliana consistent with the Lord Howe speciation process. Such so-called magic traits have long been invoked as the mechanism most likely to facilitate sympatric speciation (Gavrilets 2004, Servedio et al. 2011). A recent study suggests that when assortative mating is tightly linked to an ecologically relevant trait, the strength of ecological disruptive selection may not need to be high to drive sympatric speciation (Venkataraman and Saini 2024). The present study lends support to these findings by providing empirical evidence for the potential role of magic traits in driving sympatric speciation.
It should also be acknowledged that gene function may not be entirely conserved between A. thaliana and Howea. This is an important caveat, and means that evidence for pleiotropic function, relevant to Lord Howe Island speciation, should not be immediately discounted if the directions of phenotypic effects do not show complete concordance with the scenario of divergence in Howea. It is plausible that gain or loss-of-function coding sequence differences in the species would affect the direction of traits. Secondly, it is possible that the A. thaliana loci simply have no role, or only a minor role, in stress tolerance and/or flowering time in Howea. It is challenging to speculate on the likelihood of this; however, Hong et al. (2021) identified and analysed 22 784 putative flowering time genes in 19 species, within three families of flowering plants (Malvaceae, Brassicaceae, and Solanaceae), and found that flowering time genes were highly conserved. Additionally, as summarized by Dunning et al. (2016), flowering time control is widely conserved across diverged species groups, resulting in observable phenotypic effects when genes are transferred between different plant types. Examples include the transfer of genes from monocots to dicots (such as from rice to potato; Navarro et al. 2011), between perennial and annual species (e.g. between Arabidopsis and Populus; Peña et al. 2001), from tropical to temperate plants (like avocado to Arabidopsis; Ziv et al. 2014), and from photoperiodic to nonphotoperiodic species (such as from tomato to Arabidopsis; Ben-Naim et al. 2006).
CONCLUSION
The results presented here demonstrate that multiple loci with evidence of adaptive divergence between Howea species have the potential to have driven sympatric speciation by pleiotropically displacing flowering time and altering abiotic stress response. In particular, one Howea homologue of the A. thaliana gene SAL1 and two homologues of the A. thaliana gene SIZ1 are highlighted due to the strong evidence supporting their potential roles as key speciation genes. The two Howea homologues of SIZ1 are especially noteworthy, as expression of these genes is depleted in H. belmoreana relative to H. forsteriana (Fig. 6). Lower expression in H. belmoreana, which cannot survive in calcareous soils where drought stress may be common, is consistent with the reduced drought tolerance exhibited by the siz1 mutant.
Future research involving phenotype rescue and over-expression assays, using Arabidopsis knockouts transformed with Howea speciation gene coding sequences, could further validate the conserved function between Arabidopsis and Howea. This would strengthen the evidence presented here and solidify the potential role of the highlighted magic traits in driving sympatric speciation.
Finally, the role of mycorrhizae in the speciation process of Howea, as examined by Osborne et al. (2018), warrants further investigation to provide a more comprehensive understanding of speciation mechanisms in the context of gene flow in this now-classical system.
SUPPORTING INFORMATION
Supplementary data is available at Evolutionary Journal of the Linnean Society online.
Figure S1. Phenotypic traits of akr4c9 vs. Col-0 3 over time.
Figure S2. Phenotypic traits of dcl1 vs. Col-0 1 over time.
Figure S3. Phenotypic traits of dcl4 vs. Col-0 2 over time.
Figure S4. Phenotypic traits of At2-mmp vs. Col-0 3 over time.
Figure S5. Phenotypic traits of nac072 vs. Col-0 2 over time.
Figure S6. Phenotypic traits of rcd1 vs. Col-0 1 over time.
Figure S7. Phenotypic traits of sal1 vs. Col-0 1 over time.
Figure S8. Phenotypic traits of siz1 vs. Col-0 1 over time.
Figure S9. Phenotypic traits of tic vs. Col-0 1 over time.
Figure S10. Phenotypic traits of ugt87a2 vs. Col-0 1 over time.
Figure S11. Phenotypic traits of vel1 vs. Col-0 2 over time.
Table S1. List of candidate Howea speciation genes, identified by Dunning et al. (2016) and Osborne et al. (2019).
Table S2. Knockout A. thaliana lines used for phenotyping experiments, acquired from the European Arabidopsis Stock Centre (NASC).
Table S3. Primer pairs used to verify homozygosity of knockout mutants.
Table S4. Arabidopsis thaliana sample sizes for each genotype × treatment combination.
Table S5. Estimated least squares means for number of rosette leaves at bolting for all knockout lines and Col-0 plants excluding sal1.
Table S6. F and P-values for ANOVA interactions tests of loge(x) transformed phenotyping parameter measurements taken 10 days after stress imposition.
Table S7. Flowering Time Data.
Table S8. Plant Imaging Data.
ACKNOWLEDGEMENTS
We thank Alfried Vogler, Simon Hiscock, and two anonymous referees for comments, Luke Dunning and Owen Osborne for advice on methodology, and staff at the National Phenotyping Infrastructure at the University of Helsinki for their help with the experiments.
CONFLICT OF INTEREST
The authors declare no conflict of interest.
FUNDING
This study was funded by a BBSRC Doctoral Training Partnership (UK), NERC (UK), and the Horizon 2020 Programme of the EU (EPPN2020 Grant Agreement 731013).
DATA AVAILABILITY
All data associated with this study are available in Supporting Information.
