


Abstract
Elective cardioversion (ECV) is routinely used in atrial fibrillation (AF) to restore sinus rhythm. However, it includes a risk of thromboembolism even during adequate oral anticoagulation treatment. The aim of this study was to evaluate the risk of thromboembolic and bleeding complications after ECV in a real-life setting utilizing data from a large AF population.
This nationwide register-based study included all (n = 9625) Finnish AF patients undergoing their first-ever ECV between 2012 and 2018. The thromboembolic and bleeding complications within 30 days after ECV were analysed. The mean age of the patients was 67.7 ± 9.9 years, 61.2% were men, and the mean CHA2DS2-VASc score was 2.6 ± 1.6. Warfarin was used in 6245 (64.9%) and non-vitamin K oral anticoagulants (NOACs) in 3380 (35.1%) cardioversions. Fifty-two (0.5%) thromboembolic complications occurred, of which 62% were ischaemic strokes, 25% transient ischaemic attacks, and 13% other systemic embolisms. Thromboembolic events occurred in 14 (0.4%) NOAC-treated patients and in 38 (0.6%) warfarin-treated patients (odds ratio 0.77; confidence interval: 0.42–1.39). The median time from ECV to the thromboembolic event was 2 days, and 78% of the events occurred within 10 days. Age and alcohol abuse were significant predictors of thromboembolic events. Among warfarin users, thromboembolic complications were more common with international normalized ratio (INR) <2.5 than INR ≥2.5 (0.9% vs. 0.4%, P = 0.026). Overall, 27 (0.3%) bleeding events occurred.
The rate of thromboembolic and bleeding complications related to ECV was low without significant difference between NOAC- and warfarin-treated patients. With warfarin, INR ≥2.5 at the time of cardioversion reduced the risk of thromboembolic complications.
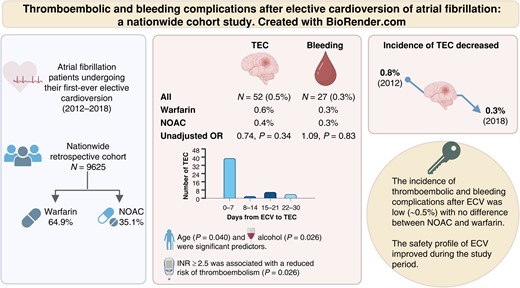
In this nationwide study, thrombotic and bleeding complications after elective cardioversion were uncommon (≤0.5%).
Advanced age and alcohol use disorder were independent risk factors for thromboembolic complications.
In warfarin-treated patients, INR ≥ 2.5 at the time of cardioversion was associated with a reduced risk of thromboembolic complications without increasing the risk of bleeding complications.
An improvement of the safety profile of elective cardioversions was observed over the study period.
Introduction
Atrial fibrillation (AF) is the most common sustained cardiac arrhythmia.1 Recent studies report that the prevalence of AF is increasing2–4 and reaching up to 5% in many studies.5 Electrical cardioversion (CV) is a common treatment to restore sinus rhythm in patients with acute and persistent AF, and the increased risk of thromboembolic complications (TECs) after CV is well acknowledged.1,6 The risk of TEC without preceding anticoagulation is 6–7%,7 while the risk is reduced to 0.5–1.6% with adequate periprocedural anticoagulation.8–10 Nearly all thromboembolic events occur within 10 days after the electrical CV with a peak 2–3 days after the procedure.11 Therefore, oral anticoagulation (OAC) treatment is recommended for at least 3 weeks before and 4 weeks after CV in patients with AF lasting for >48 h or with unknown duration.1
The use of non-vitamin K oral anticoagulants (NOACs) has been rapidly increasing in patients with AF and CV since their introduction in 2009.12,13 Warfarin requires frequent international normalized ratio (INR) controls and often prolongs the time to elective cardioversion (ECV), and therefore, NOACs provide a more feasible alternative and have overtaken warfarin as the primary choice of anticoagulation.14 Large randomized controlled trials have demonstrated the safety of utilizing NOACs for stroke prevention in patients undergoing CV with a thromboembolic risk <1%.15–17 Furthermore, recently, real-life studies have shown similar results with low rates of thromboembolic and bleeding events.10,18–21 However, in previous studies, the number of patients undergoing ECV has been low and the lack of laboratory data (e.g. INR) has often precluded evaluation of the quality of warfarin therapy.10,20 Additionally, the population has not been precisely defined and has often included both acute and elective CVs.10
The purpose of this study was to analyse the risk of thromboembolic and major bleeding complications associated with warfarin and NOAC therapy in a real-life setting utilizing data from a large, nationwide AF population undergoing ECV and using guideline-recommended anticoagulation treatment. In addition, we investigated temporal trends in the CV procedures during the study period.
Methods
Study design
This study is part of the Finnish AntiCoagulation in Atrial Fibrillation (FinACAF) study, a nationwide retrospective registry-based cohort study including all Finnish patients diagnosed with AF (n = 411 387) from 2004 to 2018. Details of the study have been described previously.5 The population of the present study is strictly defined and consists of all new-onset AF patients in Finland starting OAC and undergoing their first-ever ECV earliest 21 days from the AF diagnosis between 1 January 2012 and 30 November 2018. Patient data were collected from national healthcare registers: the Care Register of Health Care for hospitalizations and outpatient care (HILMO), the Care Register of Health for primary healthcare visits (AvoHILMO), the National Reimbursement Register maintained by the Social Insurance Institution (KELA) for drug prescriptions, and National Causes of Death Register.22–24 The inclusion criteria were International Classification of Diseases 10th edition (ICD-10) diagnosis code I48, including both AF and atrial flutter, in any of the registers. The patient selection process is presented in Figure 1. Laboratory data were collected from the six largest national central laboratories (includes 77% of Finnish population). The primary healthcare register (AvoHILMO) was introduced in Finland in 2011, and therefore, our study begins in 2012 to ensure the identification of AF patients diagnosed outside hospital care registers. The study population and the data from databases and registers were connected by utilizing the national identification number assigned to all residents of Finland to ensure accurate integration of patient data.
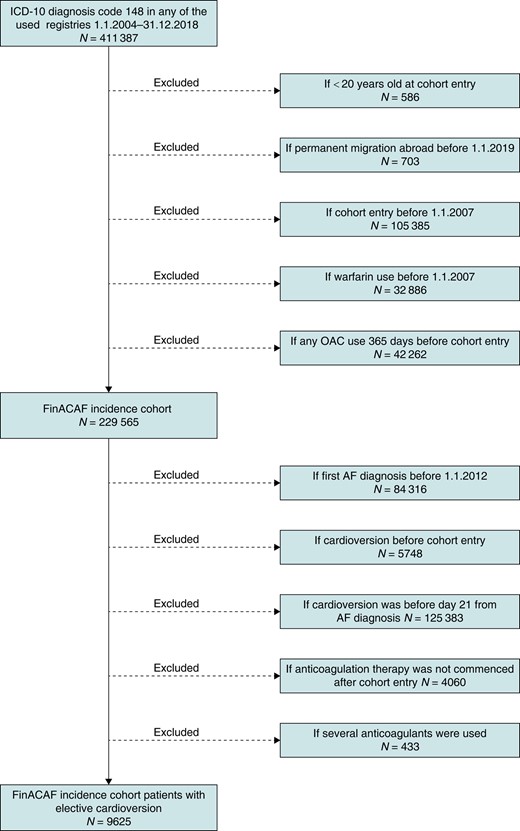
Flowchart of the patient selection process. Created with BioRender.com.
The hospital diagnoses are registered according to the ICD-10 and primary healthcare diagnoses according to the International Classification of Primary Care (ICPC-2). Oral anticoagulation treatment was defined as any filled prescription between the time of cohort entry and index ECV. The INR level (target 2.0–3.0) was defined as the last recorded INR measurement before ECV and during TEC. The CHA2DS2-VASc [congestive heart failure, hypertension, age 65–74, diabetes, vascular disease, female sex gives 1 point each; age >75, previous stroke/transient ischaemic attacks (TIAs) give 2 points] or CHA2DS2-VA score (without sex category) was used to stratify the risk of stroke in AF patients. The procedure code identified for CV was TFP20, according to the Nordic Classification of Surgical Procedures.25
Endpoints
The primary outcome was TEC within 30 days from the index ECV in patients using NOAC (dabigatran, rivaroxaban, apixaban, and edoxaban) or warfarin. A TEC was defined as an ischaemic stroke (ICD-10 codes I63, I64, and I69.3–I69.8), TIA (ICD-10 code G45), or another systemic embolism (ICD-10 codes I74, K55.0, and N28.0). Both new and recurrent thromboembolic events after ECV were included in the outcome analysis. Moreover, factors associated with increased risk of TEC were identified. The secondary outcome of interest was intracranial, gastrointestinal, or any other severe bleedings within the 30-day follow-up. All diagnosis codes for comorbidities, thromboembolic and bleeding events used for the analyses are listed in Supplementary material online, Table S1.
Ethical considerations
The study protocol was approved by the Ethics Committee of the Medical Faculty of Helsinki University, Helsinki Finland (15/2017), and granted research permission from the Helsinki University Hospital (HUS/46/2018 and updated as HUS/60/2019). Respective permissions were obtained from KELA (138/522/2018), Finnish Institute for Health and Welfare (THL; THL/2101/5.05.00/2018), Population Register Center (VRK/1291/2019-3), Statistics Finland (TK-53-1713-18/u1281), and Tax Register (VH/874/07.01.03/2019). Informed consent was not required due to the register-based nature of the study. All patient data were pseudonymized, ensuring full data protection of the patients according to European General Data Protection Regulation (EGDPR).
Statistical analysis
SPSS Statistics for Windows, version 28.0, was used for the statistical analyses. Continuous variables were tested for normal distribution by Kolmogorov–Smirnov test and presented as mean [± standard deviation (SD)], if normally distributed. Normally distributed continuous data were analysed using Student’s t-test, whereas skewed continuous data were analysed using the Mann–Whitney U test and presented as the median [interquartile range (IQR)]. χ2 test was used to compare categorical variables. A P < 0.05 was considered statistically significant. Rates of thromboembolic and bleeding events were calculated by dividing the number of events by the number of procedures.
For identifying potential confounding variables requiring adjustment in the analysis, directed acyclic graphs (DAGs) were constructed (see Supplementary material online, Figure S1). The selection of variables to DAG was chosen based on prior knowledge of factors known to potentially impact the thromboembolic risk. After univariate analysis, a multivariable logistic regression analysis was used to assess the predictors of thromboembolic and bleeding events. Patients receiving warfarin therapy were used as reference. Each model was adjusted and reported as both unadjusted and adjusted odds ratios (ORs) with corresponding 95% confidence intervals (95% CI).
Results
We identified a total of 9625 patients undergoing their first ECV. The mean age of the patients was 67.7 (SD ± 9.9) years, and 61.2% were men (Table 1). Mean CHA2DS2-VASc score was 2.6 (SD ± 1.57, range 0–9), and 74.6% of the patients had a CHA2DS2-VASc score ≥2, indicating a high risk of stroke. CHA2DS2-VASc score in the NOAC-treated patients was lower as compared to the warfarin-treated group. Moreover, patients in the warfarin group had higher prevalence of hypertension and congestive heart failure. Alcohol use disorder, mental health disorders, and thyrotoxicosis were more common in the NOAC-treated patients. The number of annual ECVs steadily decreased during the study period (2012–18) from 1774 to 931.
Characteristics of the entire cohort of 9625 patients undergoing elective cardioversion and comparison between patients treated with NOAC and warfarin
| Variables | All procedures | NOAC | Warfarin | P-value |
|---|---|---|---|---|
| n = 9625 | n = 3380 (35.1%) | n = 6245 (64.9%) | ||
| Age (years)a | 68.4 (62–75) | 67.9 (61–74) | 68.7 (62–74) | <0.001 |
| Female sex | 3733 (38.8) | 1251 (37.0) | 2482 (39.7) | 0.009 |
| CHA2DS2-VASc scoreb | 2.62 ± 1.57 | 2.53 ± 1.58 | 2.67 ± 1.57 | <0.001 |
| HAS-BLED scoreb | 1.84 ± 1.0 | 1.82 ± 1.02 | 1.85 ± 0.97 | 0.130 |
| Comorbidity | ||||
| Congestive heart failure | 1192 (12.4%) | 375 (11.1%) | 817 (13.1%) | 0.005 |
| Hypertension | 6870 (71.4%) | 2357 (69.7%) | 4513 (72.3%) | 0.009 |
| Diabetes mellitus | 2012 (20.9%) | 700 (20.7%) | 1312 (21.0%) | 0.731 |
| Hyperlipidaemia | 4472 (46.5%) | 1536 (45.4%) | 2936 (47.0%) | 0.140 |
| Previous stroke or TIA | 670 (7.0%) | 237 (7.0%) | 433 (6.9%) | 0.885 |
| Vascular disease | 1721 (17.9%) | 560 (16.6%) | 1161 (18.6%) | 0.013 |
| Chronic kidney disease | 190 (2.0%) | 57 (1.7%) | 133 (2.1%) | 0.136 |
| Abnormal liver function | 26 (0.3%) | 8 (0.2%) | 18 (0.3%) | 0.642 |
| Coronary heart disease | 1336 (13.9%) | 443 (13.1%) | 893 (14.3%) | 0.106 |
| Previous myocardial infarction | 432 (4.5%) | 170 (5.0%) | 262 (4.2%) | 0.059 |
| Previous pulmonary embolism | 67 (0.7%) | 27 (0.8%) | 40 (0.6%) | 0.373 |
| Previous venous thromboembolism | 486 (5.0%) | 189 (5.6%) | 297 (4.8%) | 0.074 |
| Alcohol overuse | 337 (3.5%) | 145 (4.3%) | 192 (3.1%) | 0.002 |
| Previous bleeding tendency | 705 (7.3%) | 266 (7.9%) | 439 (7.0%) | 0.131 |
| Thyrotoxicosis | 106 (1.1%) | 50 (1.5%) | 56 (0.9%) | 0.009 |
| Cancer | 1425 (14.8%) | 487 (14.4%) | 938 (15.0%) | 0.420 |
| Dementia | 41 (0.4%) | 15 (0.4%) | 26 (0.4%) | 0.844 |
| Mental health disorder | 1146 (11.9%) | 488 (14.4%) | 658 (10.5%) | <0.001 |
Values are means ± SD or medians (IQR) for continuous variables and n (%) for categorical variables.
CHA2DS2-VASc, congestive heart failure, hypertension, age 65–74 years, diabetes, stroke/TIA, vascular disease, age >75 years, sex category; HAS-BLED, hypertension, abnormal renal or liver function, stroke/TIA, bleeding history, labile INR (not available, maximum score 8), elderly (age >65 years), drugs or alcohol; IQR, interquartile range; NOAC, non-vitamin K oral anticoagulants; TIA, transient ischaemic attack.
aMann–Whitney U test was used to analyse skewed continuous data.
bStudent’s t-test was used to analyse normally distributed continuous data.
Anticoagulation:
Warfarin was used in 6245 (64.9%) and NOACs in 3380 (35.1%) patients. Of patients using NOACs, 1453 (15.1%) were on rivaroxaban, 1246 (12.9%) on apixaban, 635 (6.6%) on dabigatran, and 46 (0.5%) on edoxaban. The utilization of NOACs consistently increased each year, starting from 0.6% in 2012 and eventually comprising 83.7% of the procedures by the end of the study period (Figure 2).
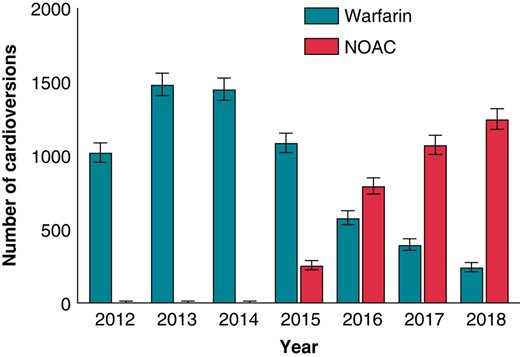
The trends of used oral anticoagulants (with 95% CI) in patients undergoing their first-ever elective cardioversion during 2012–18. CI, confidence interval; NOAC, non-vitamin K oral anticoagulants.
The use on NOACs was associated with a significantly shorter delay to ECV compared with the use of warfarin. The median time from the diagnosis of AF to the index ECV was 91 days (IQR 56–176) in warfarin and 43 days (IQR 33–70) in NOAC-treated patients (P < 0.001). Of all ECVs, 69.7% of patients treated with NOAC and 34.7% of those treated with warfarin were performed within 60 days from AF diagnosis (P < 0.001). The time to ECV became shorter during the study period in both groups, i.e. the waiting times in 2015 in warfarin and NOAC group were 86 and 63 days (P = 0.002), respectively, and at the end of the study period 77 and 28 days (P < 0.001).
Outcomes
Primary outcome
There were 52 (0.54%; 95% CI: 0.40–1.37%) TECs within 30 days after ECV, of which 32 (61.5%) were ischaemic strokes, 13 (25.0%) TIAs, and 7 (13.5%) other systemic embolisms (Table 2). Of the 7 patients experiencing other systemic embolisms, 3 had arterial embolism and thrombosis, 2 ischaemia and infarction of the kidney, and 2 acute infarction of the intestine. Twenty-eight (0.3%) of the ischaemic strokes were first-ever events, whereas 4 were recurrent. All TIA episodes were first-ever events. No deaths occurred during the 30 days follow-up after the ECV. The characteristics of patients with TEC or bleeding complications are described in Table 3. The significant independent predictors of thromboembolic event were age (OR 1.04; 95% CI: 1.00–1.07, P = 0.040) and alcohol overuse disorder (OR 3.33; 95% CI: 1.16–9.60, P = 0.026; see Supplementary material online, Table S2). The risk of TEC in patients over 75 years old tended to be higher than in patients under 75 years old (OR: 1.74; CI 0.96–3.14, P = 0.066), and the cumulative incidence for patients over 75 years old was 0.8%. The incidence of TEC decreased over the time from 0.8% in 2012 to 0.3% in 2018 (Figure 3). The median time of a TEC after ECV was 2 days (IQR 1–6), and 78% of the events occurred within 10 days (Figure 4). The number of patients on edoxaban was limited, and their complication rate was null. Therefore, these patients were removed from further endpoint analyses.
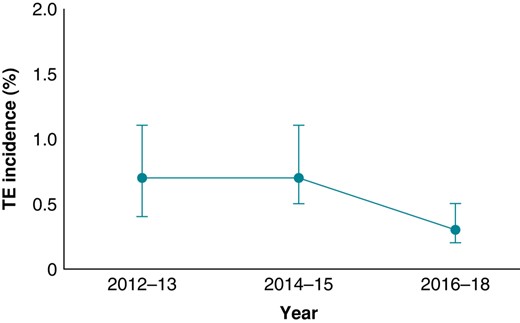
Incidence of thromboembolic complications (with 95% CI) after elective cardioversion during 2012–18. TE, thromboembolic.
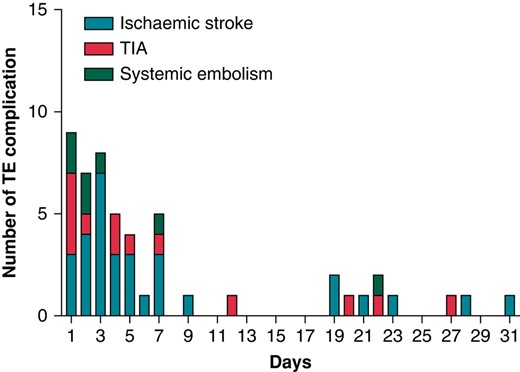
The time distribution of thromboembolic complications during 30 days after cardioversion. TE, thromboembolic; TIA, transient ischaemic attack.
Logistic regression analysis on the choice of oral anticoagulation (NOAC vs. warfarin) on thromboembolic complications (warfarin as reference)
| Unadjusted OR | Adjusted ORa | ||||||
|---|---|---|---|---|---|---|---|
| All 9625 (%) | NOAC 3380 (%) | Warfarin 6245 (%) | Odds ratio (95% CI) | P-value | Odds ratio (95% CI) | P-value | |
| All complications | 52 (0.5) | 14 (0.4) | 38 (0.6) | 0.738 (0.397–1.373) | 0.338 | 0.768 (0.424–1.392) | 0.384 |
| Ischaemic stroke | 32 (0.3) | 11 (0.3) | 21 (0.3) | 0.968 (0.466–2.009) | 0.930 | 1.031 (0.514–2.067) | 0.931 |
| TIA | 13 (0.1) | 1 (0.0) | 12 (0.2) | 0.154 (0.020–1.183) | 0.072 | 0.147 (0.019–1.129) | 0.065 |
| Systemic embolism | 7 (0.1) | 2 (0.1) | 5 (0.1) | 0.739 (0.143–3.811) | 0.718 | 0.603 (0.114–3.202) | 0.553 |
| Myocardial infarction | 39 (0.4) | 8 (0.2) | 31 (0.5) | 0.476 (0.218–1.036) | 0.061 | 0.613 (0.307–1.222) | 0.165 |
CI, confidence interval; NOAC, non-vitamin K oral anticoagulants; OR, odds ratio; TIA, transient ischaemic attack.
aAdjusted for sex, age, hypertension, diabetes, heart failure, vascular disease, coronary heart disease, previous ischaemic stroke/TIA, alcohol overuse, cancer, and chronic kidney disease.
Characteristics of patients with thromboembolic or bleeding complications after elective cardioversion
| Variables | Thromboembolic complication n = 52 (0.5%) | Bleeding complication n = 27 (0.3%) |
|---|---|---|
| Female sex | 24 (46.2) | 10 (37.0) |
| Age (years) | 70.8 ± 10.9 | 68.9 ± 10.1 |
| Warfarin | 38 (73.1) | 17 (63.0) |
| NOAC | 14 (26.9) | 10 (37.0) |
| INR | 2.1 ± 0.8 | 2.1 ± 0.9 |
| ECV to event, days | 2 (1–6) | 10 (2–20) |
| CHA2DS2-VASc score | 2.9 ± 1.8 | 3.3 ± 1.4 |
| HAS-BLED score | 2.0 ± 1.2 | 2.1 ± 0.8 |
Values are means ± SD or medians (IQR) for continuous variables and n (%) for categorical variables.
CHA2DS2-VASc, congestive heart failure, hypertension, age 65–74 years, diabetes, stroke/TIA, vascular disease, age >75 years, sex category; ECV, elective cardioversion; HAS-BLED, hypertension, abnormal renal or liver function, stroke/TIA, bleeding history, labile INR (not available, maximum score 8), elderly (age >65 years), drugs or alcohol; INR, international normalized ratio; NOAC, non-vitamin K oral anticoagulants.
The mean CHA2DS2-VASc score was higher in patients who experienced a TEC than in those without a TEC (2.9 ± 1.75 vs. 2.6 ± 1.57, P < 0.001). The distribution of CHA2DS2-VASc score is shown in Supplementary material online, Figure S2, and the absolute risk of TECs by CHA2DS2-VA is presented in Figure 5.
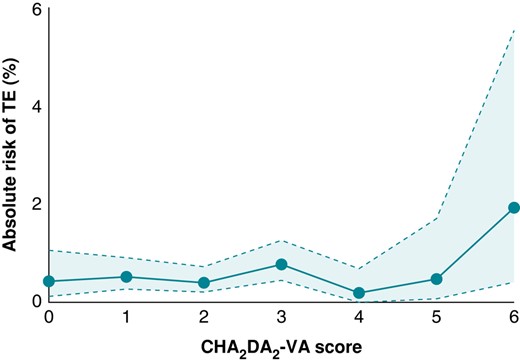
The risk of thromboembolism after elective cardioversion by CHA2DS2-VA score. CHA2DS2-VA, congestive heart failure, hypertension, age 65–74 years, diabetes, stroke/TIA, vascular disease, age >75 years; TE, thromboembolic.
Thromboembolic complications occurred in 38 patients (0.6%) in the warfarin group and in 14 patients (0.4%) in the NOAC group without significant difference between the groups (OR 0.738; CI: 0.397–1.373, P = 0.338). In addition, no difference between the individual OACs was found (see Supplementary material online, Figure S3 and Table S3).
In the warfarin-treated patients experiencing TEC, the mean INR value before ECV and at the time of stroke or TIA was 2.6 (±0.6) and 2.4 (±0.6), respectively. The incidence of TEC was higher in patients with INR < 2.5 before ECV than in those with INR ≥ 2.5 (0.9% vs. 0.4%, OR 2.41; CI: 1.11–5.23, P = 0.026).
Secondary outcomes
In total, 27 (0.3%) bleeding events occurred, of which 17 (0.3%) in patients treated with warfarin and 10 (0.3%) in patients receiving NOAC with no difference between the groups (OR 1.09; CI: 0.50–2.38; Table 4, Supplementary material online, Figure S3). All (n = 4) intracranial haemorrhagic events were non-traumatic and occurred in patients on warfarin. Of all bleedings, 24 (88.9%) were first-ever and 3 (11.1%) recurrent bleedings. No recurrent intracranial haemorrhagic or gastrointestinal bleedings were found. The mean HAS-BLED score was 2.0 (SD ± 1.18) in patients with a bleeding complication. No statistically significant factors associated with bleeding complications were found (see Supplementary material online, Table S4).
Bleeding complications after elective cardioversion (warfarin as reference)
| All, 9625 (%) | NOAC, 3380 (%) | Warfarin, 6245 (%) | Odds ratio (95% CI) | P-value | |
|---|---|---|---|---|---|
| Any bleeding | 27 (0.3) | 10 (0.3) | 17 (0.3) | 1.087 (0.497–2.377) | 0.834 |
| Intracranial bleeding | 4 (0.0) | 0 (0.0) | 4 (0.1) | 0.000 (0.000−) | 0.984 |
| Gastrointestinal bleeding | 17 (0.2) | 4 (0.1) | 3 (0.0) | 2.465 (0.551–11.021) | 0.238 |
| Other bleeding | 17 (0.2) | 6 (0.2) | 11 (0.2) | 1.008 (0.372–2.727) | 0.988 |
CI, confidence interval; NOAC, non-vitamin K oral anticoagulants.
Discussion
This study is one of the largest real-world studies comparing thromboembolic and bleeding complications in NOAC- and warfarin-treated AF patients undergoing their first ECV and using anticoagulation treatment in accordance with the contemporary guidelines. Our study provides a comprehensive and accurate analysis by containing patient information not only from hospitalizations and outpatient specialist visits but also from primary healthcare and the National Reimbursement Register.
In our study, the incidences of thromboembolic and clinically relevant bleeding events were low, 0.5 and 0.3%, respectively. There were no significant differences in TEC or bleeding complications between NOAC and warfarin groups during the 30-day follow-up after ECV, although numerically, the event rates were slightly lower in patients treated with NOACs.
In our study, the incidence of TEC decreased over the study period from 0.8 to 0.3%, showing that ECV has become safer during the study period. Together with the decrease in TEC risk, we observed a transition from warfarin to NOACs as the periprocedural anticoagulant. The increased utilization of NOACs might have tentatively contributed to a decrease in the incidence of TEC, notwithstanding the absence of statistically significant reductions in TECs. The decreased number of both ECVs and TECs during the study period may be a result of a better patient selection and perhaps that rate control strategy was more often chosen in AF patients with poor likelihood for sustaining sinus rhythm. More intensive and earlier use of antiarrhythmic medication and catheter ablations may also have contributed to the reduced need of ECVs. The increasing awareness of the thromboembolic risk of CV and better patient education may also contribute to the observed improvement of the safety profile of ECVs. In a recent study, almost 20% of ECVs involved an admission for ≥1 night, indicating that complications may have occurred during the CV procedure.26 The percentage of prolonged admission is surprisingly high and is at odds with our study. However, there may be several other explanations for a non-day case ECV.
Our study covered a 6-year period during which a gradual shift in anticoagulation treatment from warfarin to NOAC was observed. Accordingly, NOACs were used in over 80% of the CV procedures by the end of the study period. This transition is in line with contemporary guidelines, where NOACs are recommended in preference to warfarin for stroke prevention in all NOAC-eligible patients with AF.1,6 The advantages of NOACs are their rapid onset of action, fixed dosing without routine laboratory monitoring, and fewer interactions compared with warfarin.
The independent risk factors for TEC were old age and alcohol overuse disorder. In recent Danish and Finnish studies,10,27 age was also a significant risk factor of TEC after ECV. In the present study, the risk of TEC was almost two-fold in patients over 75 years compared to patients under 75 years. Thus, caution should be exercised in elderly and high-risk patients undergoing ECV, but in young and healthy patients, CV seems to be rather safe during adequate periprocedural anticoagulation. In our study, excessive alcohol consumption was associated with a three-fold risk of TEC. Lower drug adherence could explain the higher complication rate in these patients. Furthermore, alcohol has causal links with other thromboembolic risk factors, such as hypertension and systolic heart failure, that can increase the risk of TECs. Therefore, importance of periprocedural OAC adherence should be emphasized in patients with known excessive alcohol consumption scheduled for CV.
As expected, NOACs were associated with a significantly shorter waiting time to ECV than warfarin. This is consistent with previous studies, in which a longer waiting time was also an independent risk factor for both TEC and AF recurrence.20,28 One of the main advantages of NOACs in this context is that scheduled ECVs can be performed as planned without cancellations due to subtherapeutic INR.
The risk of TEC is significantly (three to four times) higher during the 30-day period after ECV compared to general risk in AF.29,30 Despite the temporary higher risk of TEC post-CV, the current recommendations regarding peri-CV INR level (2.0–3.0) align with the general anticoagulation guidelines for long-term AF management. In line with the present findings, two earlier studies have shown that the risk of TEC in warfarin-treated patients is higher in patients with INR < 2.5 than in those with INR ≥ 2.5 prior to ECV.30,31 Importantly, we observed no increase in the risk of bleedings in patients having an INR ≥ 2.5. Our findings support the view that CV during a higher intensity periprocedural anticoagulation could reduce the risk of TECs without increasing the risk of bleeding complications.
It is known that the first week after CV is the most vulnerable period regarding TECs.32 This was true also in our study; most of the TECs occurred within 1 week after ECV. Notably, another cluster of complications occurred ∼3 weeks post-CV. Previous studies have shown that a drop in the INR value after CV is fairly common (22–40%) and has been associated with increased incidence of TECs.33,34 Furthermore, compliance problems have also been observed with NOACs.35 In our study, three patients experiencing a TEC had an INR value < 2.0 at the time of thromboembolism. Considering previous research, subtherapeutic anticoagulation, possible anticoagulation interruptions, and poor drug compliance after ECV could serve as an explanation for the additional cluster of TECs 3 weeks post-ECV. This suggests that there is a need for patient education to highlight the importance of continuous anticoagulation treatment after ECV. The significance of implementing measures to ensure treatment adherence has also been emphasized in previous studies.36 Our results support current recommendations that periprocedural OAC therapy should be continued at least 4 weeks after ECV regardless of TEC risk factors.
Our study has some limitations. Given the nature of retrospective study, we were dependent on the recorded data. In addition, given that ICD-10, ICPC-2, and TFP20 codes were used to identify diagnoses and procedures, some variables may lack clinical accuracy due to human data entry errors. Also, the nature of our study being a register study based on administrative data, we did not have information regarding left ventricular ejection fraction or left atrial diameter. Further, since our inclusion criteria relied solely on the ICD-10 code I48, we were unable to differentiate between AF and atrial flutter patients. Lastly, patient adherence to NOAC therapy was based on purchase information. However, this study represents a real-life setting focused on a strictly defined cohort of patients with a new-onset AF, starting an OAC and undergoing their first-ever ECV, and achieving also almost 10 000 patients that seems to be a minimum to reasonably estimate the incidence of these infrequent endpoints. Strengths of the study include a precisely defined cohort population containing comprehensive patient information from both primary and special healthcare, thus providing a large population with as accurate information as possible.
In conclusion, our results based on a large and comprehensive cohort show that the incidence of thromboembolic and bleeding complications in patients scheduled for ECV is quite low (∼0.5%). Importantly, the safety of ECVs improved during the study period, but there was no significant difference in the risks between the NOAC- and warfarin-treated patients. Advanced age and alcohol use disorder increase the risks of ECV and should be considered when deciding the treatment strategy.
Supplementary material
Supplementary material is available at Europace online.
Funding
This work was supported by Helsinki and Uusimaa Hospital District research fund (grant numbers TYH2019309, TYH2023319); The Finnish Foundation for Cardiovascular Research; Aarne Koskelo Foundation; and Sigrid Juselius Foundation. Einar och Karin Stroems Foundation and Otto A. Malm Foundation to S.I.-S.
Data availability
The data underlying this article cannot be shared publicly due to its sensitive nature and in accordance with the agreements made with the Finnish registries. Requests to access the data set from qualified researchers trained in human subject confidentiality protocols may be sent to the Finnish national register holders (KELA, Finnish Institute for Health and Welfare, Population Register Centre, and Tax Register).
References
Finnish Institute for Health and Welfare - THL [Internet]. Care Register for Health Care. Available from: https://thl.fi/en/statistics-and-data/data-and-services/register-descriptions/care-register-for-health-care.
National Reimbursement Register maintained by the Social Insurance Institution - KELA [Internet]. Data permits and data requests. Available from: https://tietotarjotin.fi/en/service/2936881/data-permits-and-data-requests.
National Causes of Death Register [Internet]. Causes of death: documentation of statistics. Available from: https://stat.fi/en/statistics/documentation/ksyyt#Source%20data%20and%20data%20collections.
Author notes
Conflict of interest: S.I.-S.: research grants: Finnish Foundation for Cardiovascular Research, Einar och Karin Stroems Foundation, and Otto A. Malmin Foundation. M.Le.: consulting fees: BMS-Pfizer Alliance, Bayer, Boehringer Ingelheim, and MSD; speaker: BMS-Pfizer Alliance, Bayer, Boehringer Ingelheim, MSD; supporting of meetings and/or travel: BMS-Pfizer Alliance, Bayer, Boehringer Ingelheim, and MSD; and advisory board: BMS-Pfizer Alliance, Bayer, Boehringer Ingelheim, and MSD. J.P.: research grants: Helsinki and Uusimaa Hospital District, Academy of Finland, The Finnish Foundation for Cardiovascular Research, Sigrid Juselius Foundation, Bayer, and Amgen; speaker: Bayer, Boehringer Ingelheim, BMS-Pfizer, and Abbott; advisory board: Novo Nordisk and Herantis Pharma; visiting editor: Terve Media; and stock ownership: Vital Signum. Ju.H.: research grants: The Finnish Foundation for Cardiovascular Research and EU Horizon 2020, EU FP7; advisory board member: BMS-Pfizer Alliance and Novo Nordisk; and speaker: Novo Nordisk. K.E.J.A.: research grants: The Finnish Foundation for Cardiovascular Research; and speaker: Bayer, Pfizer, and Boehringer Ingelheim. A.L.A.: research grants: Finnish Foundation for Cardiovascular Research and Sigrid Juselius Foundation. All remaining authors have declared no conflicts of interest.
