


Abstract
To investigate the exact prevalence of glucose metabolism disorders, and their impact on left atrial (LA) remodelling and reversibility in patients with atrial fibrillation (AF).
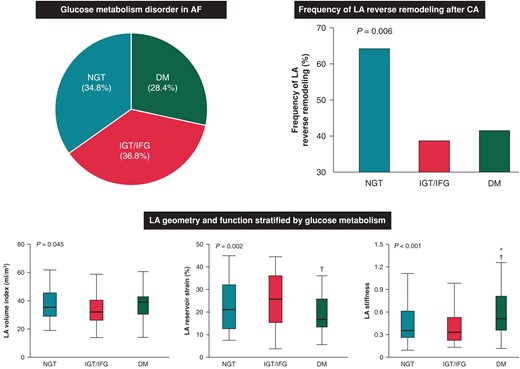
We examined 204 consecutive patients with AF who underwent their first catheter ablation (CA). Oral glucose tolerance test was used to evaluate glucose metabolism disorders in 157 patients without known diabetes mellitus (DM). Echocardiography was performed before and 6 months after CA. Oral glucose tolerance test identified abnormal glucose metabolism in 86 patients [11 with newly diagnosed DM, 74 with impaired glucose tolerance (IGT) and 1 with impaired fasting glucose (IFG)]. Ultimately, 65.2% of patients had abnormal glucose metabolism. Diabetes mellitus group had the worst LA reservoir strain and LA stiffness (both P < 0.05), while there was no significant difference in baseline LA parameters between normal glucose tolerance (NGT) group and IGT/IFG group. The prevalence of LA reverse remodelling (≥15% decrease in the LA volume index at 6 months after CA) was significantly higher in NGT group compared with IGT/IFG and DM group (64.1 vs. 38.6 vs. 41.5%, P = 0.006). Both DM and IFG/IGT carry a significant risk of lack of LA reverse remodelling independent of baseline LA size and AF recurrence.
Approximately 65% of patients with AF who underwent their first CA had abnormal glucose metabolism. Patients with DM had significantly impaired LA function compared with non-DM patients. Impaired glucose tolerance/IFG as well as DM carries significant risk of unfavourable LA reverse remodelling. Our observations may provide valuable information regarding the mechanisms and therapeutic strategies of glucose metabolism-related AF.
Approximately 65% of patients with atrial fibrillation (AF) and 55% of those who had no history of diabetes mellitus (DM) had abnormal glucose metabolism including DM, impaired glucose tolerance (IGT) and impaired fasting glucose (IFG).
Patients with DM had significantly reduced left atrial (LA) function and increased LA stiffness compared with those with non-DM. Impaired glucose tolerance/IFG was not associated with unfavourable LA remodelling at baseline, while IGT/IFG carried a significant risk for unfavourable LA reverse remodelling after catheter ablation, independent of AF recurrence and baseline LA size.
Introduction
Atrial fibrillation (AF), the most frequent sustained cardiac arrhythmia, is an emerging epidemic and conveys profound morbidity and mortality.1–4 Furthermore, AF and its comorbidities impose economic consequences, with annual health care costs of 26 billion dollars in the USA.5 Left atrial (LA) structural and functional remodelling plays a pivotal role in the pathogenesis of the occurrence, persistence, and recurrence of AF.6–10 Furthermore, successful catheter ablation (CA) of AF and restoration of a stable sinus rhythm can result in a significant LA volume reduction; LA reverse remodelling11,12 is a surrogate marker of favourable outcomes, although the degree of reverse remodelling varies among individuals.13,14
Epidemiological studies have identified diabetes mellitus (DM) as an independent risk for AF occurrence conferring a 40% increased risk,15 while impaired glucose tolerance (IGT) and impaired fasting glucose (IFG) provided conflicting results.16–18 However, the prevalence of abnormal glucose metabolism and its association with LA morphological and functional remodelling in the setting of AF is not well described. Furthermore, the impact of abnormal glucose metabolism on LA reverse remodelling after CA is also unknown. Evaluation of the exact prevalence of glucose metabolism disorder in patients with AF, and its association with LA remodelling before and after CA, might provide useful information regarding the pathogenic mechanisms linking abnormal glucose metabolism and AF, and may enhance therapeutic strategies for AF. Accordingly, the aim of this study was to investigate: (i) the prevalence of abnormal glucose metabolism, including IGT, IFG, and DM, (ii) the association of abnormal glucose metabolism with LA size and function, and (iii) the impact of glucose metabolism disorders on LA reverse remodelling in patients with AF who underwent first CA.
Methods
Study population
This study prospectively included 204 consecutive patients with AF, who underwent first CA between May 2019 and March 2022 at the University of Tokyo Hospital. The exclusion criteria were as follows: (i) congenital heart disease, (ii) moderate or severe valvular disease, (iii) dilated or hypertrophic cardiomyopathy, (iv) history of cardiothoracic surgery within 3 months, (v) history of pacemaker implantation, and (vi) renal insufficiency on haemodialysis. Atrial fibrillation was defined as ‘paroxysmal’ when the arrhythmia self-terminated within 7 days, and ‘persistent’ when the AF episode persisted for 7 days or pharmacological or electrical cardioversion was required to terminate the arrhythmia.19 All study participants gave written informed consent. The investigation conformed to the principles outlined in the Declaration of Helsinki, and the study was approved by the institutional ethics committee of the University of Tokyo (2018120NI).
Risk factor assessment and laboratory examination
Hypertension was defined as systolic blood pressure ≥140 mmHg or diastolic blood pressure ≥90 mmHg or the use of antihypertensive drugs. Dyslipidaemia was defined as total serum cholesterol >240 mg/dL or the use of lipid lowering medications. Body mass index (BMI) was calculated as body weight (kg) divided by height-squared (m2). All blood samples were collected with patients in the sitting position, and measurements included fasting serum glucose, insulin, total cholesterol, low-density lipoprotein cholesterol, high-density lipoprotein cholesterol, γ-glutamyl transpeptidase, uric acid, C-reactive protein (CRP), and B-type natriuretic peptide (BNP). The estimated glomerular filtration rate (eGFR) was calculated using the abbreviated Modification of Diet in Renal Disease formula: eGFR (mL/min/1.73 m2) = 194 × (serum creatinine)−1.094 × (age)−0.287 ×(0.739 if woman). Interleukin-6 (IL-6) and carboxy-terminal telopeptide of procollagen Type I (ICTP) levels in all patients were measured at a commercial laboratory (IL-6; electrochemiluminescence immunoassay, ICTP; radioimmunoassay; SRL, Inc., Tokyo, Japan).
Definition of abnormal glucose metabolism
Patients without known DM underwent a standardized procedure of 75 g oral glucose tolerance test (OGTT). The abnormalities in glucose metabolism were defined according to the 2006 WHO criteria20: DM was defined as fasting glucose ≥126 mg/dL, the use of insulin or hypoglycaemic agents, or 2 h plasma glucose ≥200 mg/dL; IGT as fasting plasma glucose <126 mg/dL, and 2 h plasma glucose ≥140 mg/dL but <200 mg/dL; IFG as fasting plasma glucose 110–125 mg/dL and 2 h plasma glucose <140 mg/dL; normal glucose tolerance (NGT) as fasting plasma glucose <110 mg/dL and 2 h plasma glucose <140 mg/dL. Homeostatic model assessment of insulin resistance (HOMA-IR) was also calculated from the following validated formula: HOMA-IR = fasting insulin (μU/mL) × fasting blood glucose (mg/dL)/405.21
Echocardiographic examination
Transthoracic echocardiography was performed using a commercially available system, Vivid E95 (GE Vingmed Ultrasound, Horten, Norway) or EPIQ 7 (Koninklijke Philips NV, The Netherlands), 1–4 days before and 6 months after CA. All images were acquired according to a standardized protocol by experienced and registered cardiologists, who were blinded to clinical information. The dimensions of the cardiac chambers were measured in the standard manner.22 Left ventricular (LV) mass was calculated by a validated Devereux’s formula22: LV mass = 0.8{1.04[(SWT + LVEDD + PWT)3-LVEDD3]} + 0.6, where SWT = LV end-diastolic septal wall thickness, LVEDD = LV end-diastolic diameter, and PWT = LV end-diastolic posterior wall thickness. Left atrial volume was measured from the apical two- and four-chamber views, using the biplane Simpson’s rule.22 Left ventricular mass and LA volume were indexed for body surface area. Pulsed-wave Doppler examination of mitral inflow was performed to measure early peak velocity (E). Peak early diastolic mitral annular velocity (e′) was also measured from tissue Doppler imaging in the septal and lateral mitral annulus. The ratio of E to mean e′ was then calculated (E/e′).
Speckle-tracking analysis was performed off-line using vendor independent and commercially available software (2D Cardiac Performance Analysis; TomTec Imaging System, Germany). Semi-automated border detection was performed, and the LA border was tracked throughout the cardiac cycle. Manual correction was performed in case of inadequate endocardial detection. Left atrial reservoir strain was obtained by averaging peak values of LA segmental strains from the apical two- and four-chamber views with the onset of the QRS complex used as the zero-reference point (R-R gating), according to guideline recommendations.23,24 Left atrial stiffness was also estimated by the ratio of E/e′ to LA reservoir strain.25,26
Catheter ablation procedure and assessment of left atrial reverse remodelling
Catheter ablation was performed under sedation. All patients underwent pulmonary vein isolation by point-by-point radiofrequency energy (N = 128) or the balloon technique (N = 76) to restore sinus rhythm, with an endpoint of bidirectional block between the LA and the inside of the circumferential pulmonary vein isolation area. Additional procedures including cavotricuspid isthmus ablation, superior vena cava isolation, roof line, and mitral isthmus line ablation were performed according to the physician’s discretion. After the first procedure, patients underwent a follow-up evaluation every 1–2 months in the outpatient clinic. The presence of AF and/or atrial tachycardia was evaluated on the basis of symptoms, electrocardiogram (ECG) recordings, event recordings, and 24 h ambulatory monitoring (3 and 6 months after CA). Arrhythmia recurrence was identified by ECG documentation of an atrial tachyarrhythmia lasting ≥30 s on a 12-lead ECG, or Holter monitor recording after a 2-month blanking period from the CA procedure. The presence of LA reverse remodelling was defined as a ≥15% decrease in the LA volume index 6 months after CA according to previous studies.11,12
Statistical analysis
Continuous variables were presented as mean ± standard deviation (SD) or median (interquartile range) and compared using analysis of variance with the Tukey–Kramer post hoc analysis, or a Kruskal–Wallis test with the post-test Dunn correction, as appropriate. Categorical variables were described as numbers and proportions, and compared using the χ2 test or Fisher’s exact test. Associations between glucose metabolism and LA parameters were assessed by univariable and multivariable linear regression analyses. Factors related at the P < 0.05 level were selected as independent variables for multivariable analysis. Kaplan–Meier survival curve was used to represent AF-free survival and was compared with a log-rank test. Univariable and multivariable logistic regression models were also constructed to investigate the impact of abnormal glucose metabolism on the lack of LA reverse remodelling (<15% decrease or an increase in the LA volume index after CA). Inter-observer variability for LA reservoir strain was analysed in 15 randomly selected patients assessed by 2 independent and blinded observers. The results were analysed using Pearson correlation analysis and the Bland–Altman method. A value of P < 0.05 was considered significant. Statistical analyses were performed using JMP 14 software (SAS Institute, Cary, NC, USA).
Results
Prevalence of abnormal glucose metabolism
The median age was 66 (25th–75th percentile, 58–72) years, and 152 (74.5%) of the patients were men. Atrial fibrillation was paroxysmal in 108 patients (52.9%) and persistent in 96 patients (47.1%). Among the study participants, 47 patients were diagnosed with Type 2 DM before the 75 g OGTT. All patients without a diagnosis of DM (N = 157) underwent the 75 g OGTT. Eleven patients were newly diagnosed with DM, 74 patients had IGT, 1 patient had IFG, and 71 patients had NGT (Figure 1). As a result, abnormal glucose metabolism was detected in 133 (65.2%) patients with AF, including 58 (28.4%) with DM and 75 (36.8%) with IGT/IFG.
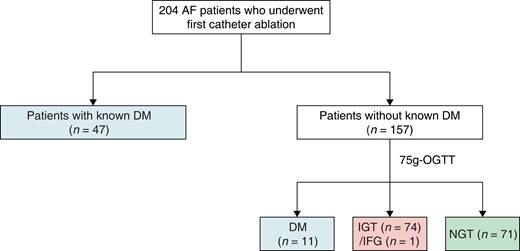
Flow chart of the study population illustrating the diagnostic process of abnormal glucose metabolism. AF, atrial fibrillation; DM, diabetes mellitus; IFG, impaired fasting glucose; IGT, impaired glucose tolerance; NGT, normal glucose tolerance; OGTT, oral glucose tolerance test.
Association of glucose metabolism with demographics and biomarkers
Clinical characteristics of the study population stratified by glucose metabolism are summarized in Table 1. Patients with IGT/IFG and DM were older than those with NGT. The prevalence of hypertension, dyslipidaemia, and current smoking was significantly different among the three groups (all P < 0.05), while AF type, BMI, and heart rate were not. As for the laboratory parameters, circulating BNP and IL-6 levels were highest in the DM group (both P < 0.05). On the other hand, ICTP concentration, which reflects collagen degradation, showed no significant differences across the three groups.
Baseline characteristics and echocardiographic measures of the study population stratified by glucose metabolism
| NGT (n = 71) | IGT/IFG (n = 75) | DM (n = 58) | P-value | |
|---|---|---|---|---|
| Age, years | 60 (51–69) | 67 (61–73)* | 68 (64–73)* | <0.001 |
| Men, n (%) | 47 (66.2) | 54 (72.0) | 51 (87.9) | 0.016 |
| Persistent AF, n (%) | 38 (53.5) | 28 (37.3) | 30 (51.7) | 0.103 |
| Duration of AF, months | 8 (3–24) | 4 (3–10)* | 7 (4–24) | 0.014 |
| Duration of DM, years | — | — | 6 (1–12) | N/A |
| Hypertension, n (%) | 27 (38.0) | 42 (56.0) | 36 (62.1) | 0.015 |
| Dyslipidaemia, n (%) | 23 (32.4) | 29 (38.7) | 31 (53.4) | 0.048 |
| Current smoking, n (%) | 9 (12.7) | 2 (2.7) | 11 (19.0) | 0.009 |
| Body mass index, kg/m2 | 23.5 (21.8–26.0) | 24.7 (22.4–27.0) | 24.8 (23.2–26.7) | 0.103 |
| Systolic blood pressure, mmHg | 112 (104–132) | 124 (112–138)* | 120 (108–131) | 0.037 |
| Diastolic blood pressure, mmHg | 64 (60–72) | 70 (62–78) | 68 (60–74) | 0.056 |
| Heart rate, beats/min | 74 (66–83) | 77 (65–83) | 77 (67–84) | 0.828 |
| CHADS2 score | 0 (0–1) | 1 (0–1) | 2 (1–2)*,† | <0.001 |
| CHA2DS2-VASc score | 1 (0–2) | 2 (1–3) | 3 (2–4)*,† | <0.001 |
| Laboratory parameters | ||||
| White blood cell, /μL | 5700 (4700–6600) | 5500 (4800–6400) | 6350 (5300–7300) | 0.039 |
| Red blood cell distribution width, % | 12.8 (12.2–13.2) | 13.0 (12.6–13.7) | 13.2 (12.6–13.8)* | 0.026 |
| Fasting glucose, mg/dL | 91 (85–95) | 98 (92–101)* | 123 (99–174)*,† | <0.001 |
| Fasting insulin, μU/mL | 4.8 (3.0–6.0) | 5.6 (3.4–8.2) | 7.8 (4.4–15.7)*,† | <0.001 |
| HOMA-IR | 1.01 (0.65–1.41) | 1.27 (0.81–2.04) | 2.28 (1.24–5.96)*,† | <0.001 |
| HbA1c, % | 5.7 (5.4–5.9) | 5.8 (5.6–5.9) | 6.7 (6.2–7.3)*,† | <0.001 |
| Total cholesterol, mg/dL | 204 ± 36 | 199 ± 32 | 185 ± 37* | 0.012 |
| LDL cholesterol, mg/dL | 120 ± 32 | 118 ± 28 | 103 ± 30*,† | 0.003 |
| HDL cholesterol, mg/dL | 62 (51–75) | 56 (48–68) | 55 (45–67) | 0.062 |
| eGFR, mL/min/1.73 m2 | 68 ± 14 | 67 ± 15 | 63 ± 14 | 0.173 |
| γ−GTP, IU/L | 31 (20–64) | 40 (26–81) | 35 (20–59) | 0.089 |
| Uric acid, mg/dL | 6.1 ± 1.3 | 6.2 ± 1.5 | 5.9 ± 1.4 | 0.579 |
| C-reactive protein, mg/dL | 0.05 (0.03–0.10) | 0.06 (0.03–0.11) | 0.08 (0.03–0.19) | 0.179 |
| B-type natriuretic peptide, pg/mL | 57.7 (26.1–132.0) | 43.7 (22.5–95.0) | 89.9 (36.8–181.8)† | 0.005 |
| Interleukin-6, pg/mL | 1.1 (0.8–1.9) | 1.2 (0.8–1.9) | 1.9 (1.3–3.1)*,† | <0.001 |
| ICTP, ng/mL | 3.9 (3.2–4.9) | 3.9 (3.0–5.1) | 4.1 (3.3–5.3) | 0.427 |
| Medications | ||||
| RAAS blocker, n (%) | 15 (21.1) | 24 (32.0) | 28 (48.3) | 0.005 |
| β-Blocker, n (%) | 25 (35.2) | 37 (49.3) | 23 (39.7) | 0.209 |
| Calcium channel blocker, n (%) | 16 (22.5) | 29 (38.7) | 27 (46.6) | 0.013 |
| Statin, n (%) | 13 (18.3) | 17 (22.7) | 26 (44.8) | 0.002 |
| Oral anti-diabetic drug, n (%) | 0 (0.00) | 0 (0.00) | 36 (62.1) | <0.001 |
| Insulin, n (%) | 0 (0.00) | 0 (0.00) | 6 (10.3) | <0.001 |
| Antiarrhythmic drug, n (%) | 25 (35.2) | 20 (26.7) | 18 (31.0) | 0.536 |
| Ablation procedure characteristics | ||||
| PV isolation, n (%) | 71 (100.0) | 75 (100.0) | 58 (100.0) | N/A |
| Line lesion, n (%) | 1 (1.4) | 3 (4.0) | 5 (8.6) | 0.136 |
| SVC isolation, n (%) | 2 (2.8) | 1 (1.3) | 1 (1.7) | 0.802 |
| Cavotricuspid isthmus, n (%) | 13 (18.3) | 17 (22.7) | 17 (29.3) | 0.335 |
| Echocardiographic parameters | ||||
| LV end-diastolic diameter, mm | 46.5 ± 4.7 | 45.2 ± 5.5 | 47.5 ± 4.6† | 0.031 |
| LV end-systolic diameter, mm | 30.6 (28.3–34.1) | 28.3 (25.8–32.1)* | 31.9 (28.3–34.2)† | 0.007 |
| LV ejection fraction, % | 62.4 (55.3–67.0) | 63.9 (58.0–68.3) | 61.7 (55.4–65.1) | 0.240 |
| LV mass index, g/m2 | 78.8 (71.9–92.8) | 78.3 (70.3–98.9) | 95.9 (79.7–108.8)*,† | <0.001 |
| E wave, cm/s | 72.4 (59.0–85.3) | 66.5 (58.7–80.5) | 74.1 (63.0–85.3) | 0.093 |
| e′, cm/s | 9.3 (7.7–11.3) | 8.4 (6.7–9.6)* | 8.0 (7.0–9.2)* | <0.001 |
| E/e′ ratio | 7.7 (6.3–9.7) | 7.9 (6.8–9.8) | 9.5 (7.8–11.5)*,† | 0.001 |
| LA diameter, mm | 40.0 (34.3–43.0) | 39.4 (33.7–42.7) | 40.9 (37.1–44.4) | 0.168 |
| LA volume index, mL/m2 | 35.5 (29.0–45.5) | 32.0 (26.2–40.2) | 39.2 (30.6–43.1) | 0.045 |
| LA reservoir strain, % | 21.1 (12.6–32.0) | 25.5 (15.1–36.0) | 16.7 (13.2–25.8)† | 0.002 |
| LA stiffness | 0.36 (0.26–0.61) | 0.33 (0.23–0.53) | 0.52 (0.36–0.81)*,† | <0.001 |
Values are mean ± SD, n (percentage), or median (25th–75th percentile).
AF, atrial fibrillation; DM, diabetes mellitus; E, early diastolic transmitral flow velocity; e′, early diastolic mitral annular velocity; eGFR, estimated glomerular filtration rate; GTP, glutamyl transpeptidase; HDL, high-density lipoprotein; ICTP, carboxy-terminal telopeptide of procollagen Type I; IFG, impaired fasting glucose; IGT, impaired glucose tolerance; HOMA-IR, homeostatic model assessment of insulin resistance; LA, left atrium; LDL, low-density lipoprotein; LV, left ventricle; NGT, normal glucose tolerance; PV, pulmonary vein; RAAS, renin-angiotensin-aldosterone system; SVC, superior vena cava.
P < 0.05 compared with NGT group.
P < 0.05 compared with IGT/IFG group.
Glucose metabolism and left atrial remodelling before catheter ablation
Table 1 also shows the echocardiographic parameters. Left ventricular ejection fraction was similar in the three groups, whereas larger LV mass index and higher E/e′ ratio were observed in patients with DM (both P < 0.05). In terms of LA parameters, patients with DM had the largest LA volume (P = 0.045) and the worst LA reservoir strain (P = 0.002) and LA stiffness (P < 0.001; Figure 2). On the other hand, there was no significant difference in LA morphology and function between the NGT group and the IGT/IFG group. Therefore, we combined the IGT/IFG and NGT groups, and patients were classified into a DM group and a non-DM group to investigate the independent association between DM and LA functional remodelling. In the multivariable linear regression analysis, DM was significantly associated with reduced LA reservoir strain independent of pertinent biomarkers and echocardiographic parameters (standardized β = −0.14, P = 0.004; Table 2). In addition, persistent AF was independently related to worse LA reservoir function. Diabetes mellitus was also significantly associated with LA stiffness in the univariable model (standardized β = 0.16, P = 0.025), which became not significant after multivariable adjustment. Representative cases are presented in Figure 3. The right case with DM had reduced LA reservoir strain compared with the middle case with IGT and the left case with NGT. Patients with DM had worse AF-free survival at 1 year compared with NGT and IGT/IFG groups (log-rank P = 0.005; Figure 4).
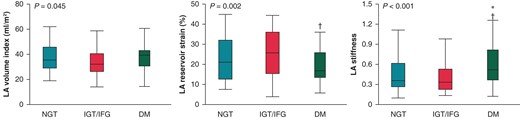
LA volume index, LA reservoir strain, and LA stiffness stratified the glucose metabolism. *P < 0.05 compared with NGT group. †P < 0.05 compared with IGT/IFG group. DM, diabetes mellitus; IFG, impaired fasting glucose; IGT, impaired glucose tolerance; LA, left atrium; NGT, normal glucose tolerance.
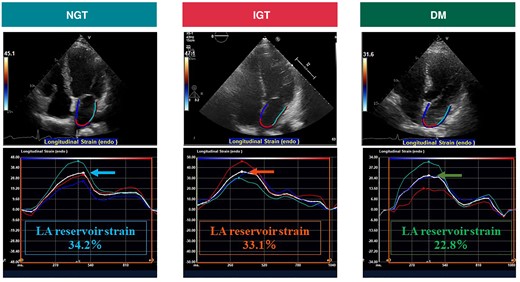
Representative images of LA reservoir strain in three cases with AF. The arrow indicates the average LA reservoir strain. AF, atrial fibrillation; DM, diabetes mellitus; IGT, impaired glucose tolerance; LA, left atrium; NGT, normal glucose tolerance.
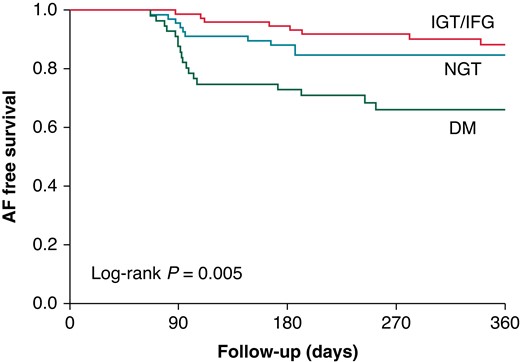
Kaplan–Meier curve for AF-free survival. AF, atrial fibrillation; DM, diabetes mellitus; IFG, impaired fasting glucose; IGT, impaired glucose tolerance; NGT, normal glucose tolerance.
Determinants of LA reservoir strain by univariable and multivariable linear regression analysis
| Univariable | Multivariable | |||
|---|---|---|---|---|
| Sβ (95% CI) | P-value | Sβ (95% CI) | P-value | |
| Age, years | −0.16 (−0.29 to −0.02) | 0.022 | −0.02 (−0.13 to 0.08) | 0.650 |
| Men | −0.10 (−2.75 to 0.47) | 0.164 | ||
| Persistent AF | −0.64 (−7.60 to −5.43) | <0.001 | −0.30 (−4.17 to −1.91) | <0.001 |
| Diabetes mellitus | −0.23 (−4.06 to −1.11) | 0.001 | −0.14 (−2.59 to −0.51) | 0.004 |
| Hypertension | 0.03 (−1.14 to 1.68) | 0.704 | ||
| Dyslipidaemia | 0.01 (−1.30 to 1.57) | 0.850 | ||
| Current smoking | −0.08 (−3.64 to 0.89) | 0.232 | ||
| Body mass index, kg/m2 | −0.06 (−0.59 to 0.24) | 0.284 | ||
| Heart rate, beats/min | −0.27 (−0.30 to −0.10) | <0.001 | −0.11 (−0.16 to −0.01) | 0.026 |
| eGFR, mL/min/1.73 m2 | 0.25 (0.08 to 0.27) | <0.001 | 0.07 (−0.03 to 0.12) | 0.196 |
| Log (CRP), mg/dL | −0.03 (−3.87 to 2.43) | 0.679 | ||
| Log (BNP), pg/mL | −0.64 (−15.37 to −11.04) | <0.001 | −0.19 (−6.59 to −1.32) | 0.004 |
| Log (IL-6), pg/mL | −0.16 (−9.72 to −0.85) | 0.020 | 0.06 (−1.50 to 5.38) | 0.268 |
| Log (ICTP), ng/mL | −0.22 (−23.53 to −5.34) | 0.002 | −0.04 (−9.59 to 4.71) | 0.501 |
| LV mass index, g/m2 | −0.25 (−0.20 to −0.06) | <0.001 | 0.03 (−0.03 to 0.07) | 0.485 |
| LV ejection fraction, % | 0.49 (0.38–0.62) | <0.001 | 0.17 (0.07–0.28) | 0.002 |
| LA volume index, mL/m2 | −0.59 (−0.55 to −0.37) | <0.001 | −0.31 (−0.33 to −0.15) | <0.001 |
| E/e′ ratio | −0.20 (−1.26 to −0.25) | 0.003 | 0.06 (−0.16 to 0.60) | 0.265 |
AF, atrial fibrillation; BNP, B-type natriuretic peptide; CI, confidence interval; CRP, C-reactive protein; E, early diastolic transmitral flow velocity; e′, early diastolic mitral annular velocity; eGFR, estimated glomerular filtration rate; ICTP, carboxy-terminal telopeptide of procollagen Type I; IL-6, Interleukin-6; LA, left atrium; LV, left ventricle; Sβ, standardized β.
Glucose metabolism and left atrial reverse remodelling after catheter ablation
Six months after CA, HbA1c levels were 5.6 (25th–75th percentile, 5.3–5.7) in NGT group, 5.6 (25th–75th percentile, 5.4–5.8) in IGT/IFG group, and 6.7 (25th–75th percentile, 6.2–7.1) in DM group, respectively. Among the 204 patients included in the study, 187 patients (64 in NGT group, 70 in IGT/IFG group and 53 in DM group, respectively) underwent follow-up echocardiography at 6 months after CA. During 6 months of follow-up, AF recurrence rate was higher in the DM group compared with NGT and IGT/IFG groups (28.3 vs. 15.6 vs. 7.1%, P = 0.007). Ninety (48.1%) patients exhibited LA reverse remodelling with ≥15% reduction of LA volume index. The prevalence of LA reverse remodelling was significantly higher in the NGT group compared with the IGT/IFG and DM groups (64.1 vs. 38.6 vs. 41.5%, P = 0.006; Figure 5). Table 3 shows the univariable and multivariable logistic regression analysis for the risk of impaired LA reverse remodelling: a <15% decrease or an increase in the LA volume index after CA. Multivariable analysis demonstrated that both DM [adjusted odds ratio (OR) 2.49, P = 0.040] and IGT/IFG (adjusted OR 2.39, P = 0.032) carry a significant risk for lack of LA reverse remodelling independent of AF type, pertinent biomarkers, baseline LA size, and AF recurrence. Among the DM group, patients with newly diagnosed DM tended to have smaller LA size compared with those with known DM [30.5 (25th–75th percentile, 24.5–45.9) mL/m2 vs. 39.6 (25th–75th percentile, 30.9–43.0) mL/m2, P = 0.191] at baseline. Follow-up echocardiography demonstrated that LA size was comparable between the two groups [32.2 (25th–75th percentile, 28.0–41.1) mL/m2 vs. 32.3 (25th–75th percentile, 27.4–38.9) mL/m2, P = 0.804].
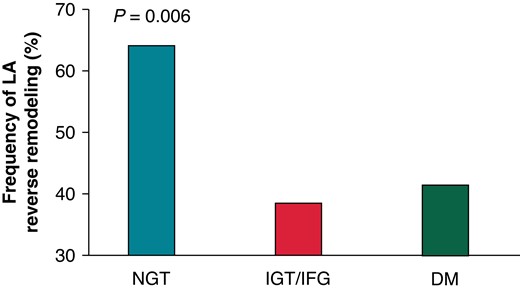
Frequency of LA reverse remodelling according to the glucose metabolism. DM, diabetes mellitus; IFG, impaired fasting glucose; IGT, impaired glucose tolerance; LA, left atrium; NGT, normal glucose tolerance.
Risk factors for lack of LA reverse remodelling by univariable and multivariable logistic regression analysis.
| Univariable | Multivariable | |||
|---|---|---|---|---|
| Odds ratio (95% CI) | P-value | Odds ratio (95% CI) | P-value | |
| Age, years | 1.02 (0.99–1.05) | 0.181 | ||
| Men | 0.74 (0.38–1.43) | 0.366 | ||
| Persistent AF | 0.35 (0.19–0.63) | <0.001 | 0.70 (0.31–1.60) | 0.402 |
| IGT/IFG (Ref.; NGT) | 2.78 (1.37–5.60) | 0.005 | 2.39 (1.08–5.27) | 0.032 |
| Diabetes mellitus (Ref.; NGT) | 2.51 (1.19–5.31) | 0.016 | 2.49 (1.04–5.96) | 0.040 |
| Hypertension | 1.03 (0.58–1.84) | 0.909 | ||
| Dyslipidaemia | 1.54 (0.85–2.79) | 0.149 | ||
| Current smoking | 1.05 (0.40–2.71) | 0.925 | ||
| Body mass index, kg/m2 | 1.04 (0.95–1.13) | 0.414 | ||
| Heart rate, beats/min | 0.99 (0.97–1.01) | 0.390 | ||
| eGFR, mL/min/1.73 m2 | 1.01 (0.99–1.03) | 0.455 | ||
| Log (CRP), mg/dL | 1.92 (1.01–3.70) | 0.046 | 2.22 (1.04–4.71) | 0.035 |
| Log (BNP), pg/mL | 0.33 (0.17–0.64) | <0.001 | 0.77 (0.29–2.05) | 0.596 |
| Log (IL-6), pg/mL | 1.81 (0.71–4.62) | 0.207 | ||
| Log (ICTP), ng/mL | 1.21 (0.16–8.97) | 0.854 | ||
| LV mass index, g/m2 | 1.00 (0.98–1.01) | 0.828 | ||
| LV ejection fraction, % | 1.05 (1.02–1.09) | 0.001 | 1.05 (1.002–1.09) | 0.033 |
| LA volume index, g/m2 | 0.95 (0.92–0.97) | <0.001 | 0.96 (0.92–0.99) | 0.010 |
| E/e′ ratio | 0.92 (0.83–1.03) | 0.146 | ||
| AF recurrence | 2.52 (1.09–5.85) | 0.026 | 4.07 (1.48–11.14) | 0.004 |
AF, atrial fibrillation; BNP, B-type natriuretic peptide; CI, confidence interval; CRP, C-reactive protein; E, early diastolic transmitral flow velocity; e′, early diastolic mitral annular velocity; eGFR, estimated glomerular filtration rate; ICTP, carboxy-terminal telopeptide of procollagen Type I; IFG, impaired fasting glucose; IGT, impaired glucose tolerance; IL-6, Interleukin-6; LA, left atrium; LV, left ventricle; NGT, normal glucose tolerance.
Reproducibility of left atrial strain measurement
An excellent correlation was observed in the analysis of inter-observer variability of LA reservoir strain (r = 0.94). In the Bland–Altman analysis, agreement between the inter-observer measurements was 1.1 ± 4.9% (mean ± 1.96 SD, respectively).
Discussion
The major findings of the present study were as follows: (i) ∼65% of patients with AF who underwent first CA had abnormal glucose metabolism including IGT, IFG, and DM, (ii) patients with DM had significantly impaired LA function, while similar LA morphology and function were observed between the IGT/IFG group and the NGT group, and (iii) IGT/IFG as well as DM carried significant risk for lack of LA reverse remodelling after CA, independent of AF recurrence and baseline LA size.
Prevalence of abnormal glucose metabolism and its association with left atrial remodelling
Previous studies have explored the prevalence of glucose metabolism disorders, particularly in atherosclerotic cardiovascular diseases (e.g. coronary artery disease and ischaemic stroke). Norhammar et al.27 reported that a 75 g OGTT identified DM in 31% and IGT in 35% of 181 non-diabetic patients who were hospitalized for acute myocardial infarction. In terms of cerebrovascular disease, Kernan et al.28 examined 98 patients with transient ischaemic attack or non-disabling ischaemic stroke and found that 28% had IGT and 24% had DM. However, very limited data are available regarding the prevalence of abnormal glucose metabolism in the setting of AF, although DM carries a significant risk of AF and subsequent stroke, and is a potentially modifiable risk factor.15,29 Johansen et al.30 studied 46 elderly patients with AF and reported that 40% of patients had prediabetes/diabetes in Norway. The prevalence is lower than our observations, although we included Asian patients with AF with relatively low BMI (median: 24.6 kg/m2). This discrepancy may be partly explained by the fact that Asians are susceptible to glucose metabolism disorders compared with Westerners.31,32 Recent studies clearly demonstrated that reduced LA function is closely related to the occurrence and recurrence of AF.7–9 We observed significantly reduced LA function in patients with AF with DM compared with those without DM, and the association was independent of pertinent biomarkers and LV morphology and function. Previous studies explored the impact of DM on LA functional remodelling in selected populations. Mondillo et al.33 demonstrated significantly reduced LA reservoir function in individuals with DM free of cardiac disease and LA dilatation. Steele et al.34 showed impaired LA strain in obese adolescents and young adults with DM. Our findings are in line with these previous observations and extend them to patients with AF. On the other hand, we also found that the IGT/IFG group exhibited similar LA morphology and function as the NGT group. This finding suggests that long-term cumulative exposure to hyperglycaemia may adversely affect LA remodelling. However, ∼25% of individuals with IGT develop DM within 5 years,35 implying that lifestyle intervention to delay the onset of DM may prevent unfavourable LA remodelling.
Impact of abnormal glucose metabolism on left atrial reverse remodelling after CA
Previous studies explored the frequency of LA reverse remodelling and its clinical significance in patients with AF who underwent CA. Tops et al.11 demonstrated that 63% of patients exhibited LA reverse remodelling (15% or more reduction in LA volume) in 148 patients with AF. Another study also showed that 47% of patients with AF experienced LA reverse remodelling 6 months after CA using cardiac computed tomography.12 The prevalence of LA reverse remodelling of 48% in the present study is consistent with these previous observations. In addition, patients who exhibited LA reverse remodelling after CA had favourable outcomes.13,14 We demonstrated for the first time that IGT/IFG as well as DM had a negative effect for LA reverse remodelling independent of baseline LA size and AF recurrence, although LA size and function were similar between the IGT/IFG and NGT groups. Our observations may provide valuable information for the management of patients with AF with glucose metabolism disorders before and after CA. Indeed, Pathak et al.36 reported that an intensive risk factor management programme, including weight and glycaemic control, resulted in a significant improvement in long-term ablation outcomes in the ARREST-AF Cohort Study.
The underlying mechanisms by which glucose metabolism disorder affects unfavourable LA remodelling are not entirely clear, but there are several hypotheses. First, abnormal glucose metabolism is related to enhanced angiotensin II and transforming growth factor-β signalling leading pro-fibrotic environment and subsequent LA dysfunction.37 Second, imbalance in autonomic nervous system and predominance of sympathetic nervous system in patients with hyperglycaemia can contribute to LA functional impairment.38 Third, renal dysfunction accompanied by abnormal glucose metabolism which may adversely affect LA function.39,40 Finally, enhanced inflammation in abnormal glucose metabolism can be associated with LA remodelling.41 Indeed, significantly higher level of CRP at 6 months after CA was observed in patients with lack of LA reverse remodelling rather than those with LA reverse remodelling [0.06 (25th–75th percentile, 0.04–0.14) mg/dL vs. 0.04 (25th–75th percentile, 0.03–0.10) mg/dL, P = 0.018] in the present study.
Study limitations
Our study has several limitations. First, we included patients who underwent CA, which may limit the applicability of the findings to populations with different profiles, such as long-standing AF who were ineligible for CA. Second, detailed information on the history of therapeutic intervention for DM (lifestyle intervention and medications) and trajectories of HbA1c levels are not uniformly available in the present study. In addition, we cannot evaluate the impact of glycaemic fluctuations on LA remodelling in the present study, although recent studies suggested the association between glycaemic fluctuations and AF.42 Third, only nine patients (4.4%) had history on ischaemic heart disease with revascularization and no patients had symptomatic coronary artery disease in this study. However, we cannot conclusively exclude the presence of subclinical/asymptomatic coronary artery disease, which might affect our observations. Fourth, the AF recurrence rate may have been underestimated because asymptomatic AF episodes may not have been detected. Our monitoring methods were less able to detect AF episodes than other longer term monitoring such as implantable loop recorders, which can evaluate the AF burden more accurately after CA. In addition, impact of AF burden after CA on LA reverse remodelling was unable to address in this study because of limited number of patients who experienced AF recurrence. Furthermore, the mixing of radiofrequency ablation and balloon technique might affect our observations. In this study, baseline LA size was larger in patients treated with radiofrequency CA compared with those with balloon technique, LA size at 6 months after CA and recurrence of AF were comparable between the two groups. Finally, although we applied the 15% reduction of LA volume index as LA reverse remodelling in the present study according to the previous studies,11,12,43,44 there is no established cut-off value of LA reverse remodelling. Future studies are warranted to investigate the optimal definition of LA reverse remodelling and utility of LA reservoir strain in patients with AF.
Conclusions
Abnormal glucose metabolism was observed in 65% of patients with AF who underwent CA. Patients with DM had significantly reduced LA function and increased LA stiffness compared with those with non-DM. Impaired glucose tolerance/IFG carries significant risk for persistence of LA enlargement after CA, although IGT/IFG was not associated with unfavourable LA remodelling at baseline. Our findings may provide valuable information regarding the pathogenic mechanisms linking glucose metabolism disorders and AF and may enhance therapeutic strategies for glucose metabolism-related AF.
Authors’ contribution
K.N. contributed to the conception and design of the work. K.N., M.D., K.F., K.I., Y.Y., K.H., Y.M., Y.Y., T.N., T.O., T.M., Y.S., G.O., T.K., and E.H. contributed to the acquisition, analysis, and interpretation of the data for the study. K.N. drafted the manuscript. M.D., K.F., K.I., Y.Y., K.H., Y.M., Y.Y., T.N., T.O., T.M., Y.S., G.O., T.K., E.H., H.M., and I.K. critically revised the manuscript. All authors provided final approval and agreed to be accountable for all aspects of the work, ensuring integrity and accuracy.
Acknowledgement
The authors thank Megumi Hirokawa, MD, Jumpei Ishiwata, MD, and Naoko Sawada, MD for the general support.
Funding
This work was supported in part by Grants-in-Aid for Scientific Research 19K20707 and 22K12859.
Data Availability
The data that support the findings of this study are available from the corresponding author upon reasonable request.
References
Author notes
Conflict of interest: None declared.
