


Abstract
Reduction of atrial fibrillation (AF) burden is the preferred outcome measure over categorical AF rhythm recurrence after AF ablation. In this sub-analysis of the TeleCheck-AF project, we tested the feasibility of smartphone app-based approximation of time spent with AF and/or symptoms.
Patients scheduled for at least one teleconsultation during the 12-month follow-up after AF ablation were instructed to use a smartphone photoplethysmography-based application for simultaneous symptom and rhythm monitoring three times daily for 1 week. Proxies of time spent with AF and/or symptoms (% recordings, load, and % days), temporal aggregation of AF and/or symptoms (density), and symptom–rhythm correlation (SRC) were assessed. In total, 484 patients (60% male, 62 ± 9.9 years) were included. Adherence, motivation, and patient satisfaction were high. %AF recordings, AF load, and %AF days (rs = 0.88–0.95) and %symptom recordings, symptom load, and %symptom days (rs = 0.95–0.98) showed positive correlations. The SRC correlated negatively with time spent with symptoms (rs = −0.65–0.90) and with time spent with AF (rs = −0.31–0.34). In patients with paroxysmal AF before ablation and AF during the monitoring period, 87% (n = 39/44) had a low-density score <50% (‘paroxysmal AF pattern’) while 5% (n = 2/44) had a high-density score >90% (‘persistent AF pattern’). Corresponding numbers for patients with persistent AF before ablation were 48% (n = 11/23) and 43% (n = 10/23), respectively.
On-demand, app-based simultaneous rhythm and symptom assessment provides objective proxies of time spent with AF and/or symptoms and SRC, which may assist in assessing AF and symptom outcomes after AF ablation.
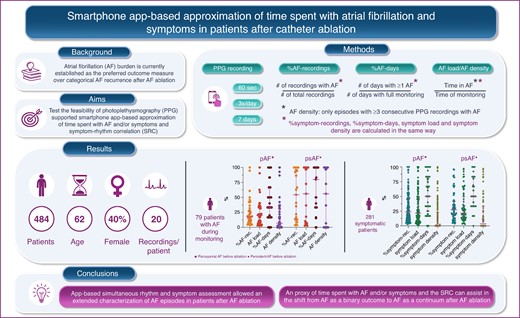
Using on-demand app-based simultaneous rhythm and symptom assessment is feasible and allows extended characterization of AF episodes in patients after AF ablation.
Herein, we provide three metrics, covering different time domains (from recordings to days) to approximate time spent with AF. Additionally, we introduce AF density that is a measure of temporal aggregation of AF.
Time spent with symptoms are approximated with corresponding symptom metrics.
Above-mentioned approximations of time spent with AF and time spent with symptoms as well as SRC may help in the shift from AF as a binary outcome to AF as a continuous outcome after AF ablation.
Introduction
Catheter ablation is the cornerstone of modern comprehensive atrial fibrillation (AF) treatment.1 Reduction of AF burden, which is defined as the proportion of time spent in AF during a monitoring period,2,3 is currently established as the preferred outcome measure over categorical AF rhythm recurrences after rhythm control interventions.2,4–7
Notably, the assessment of AF patterns during clinical history taking poorly correlates with AF burden after catheter ablation, and the rate of AF recurrence varies based on the arrhythmia monitoring strategy employed.8 While continuous rhythm monitoring is the most accurate method to evaluate AF burden, long-term intermittent monitoring by one to three short-term wearable recordings per day provides an effective alternative within a non-invasive, low-cost, accessible, and user-friendly method.9–12 Nevertheless, systematic AF burden assessment by smartphone applications has mainly been used within clinical trials,13,14 and the feasibility and patient experience in a real-life scenario remain unclear.
Recently, the 2024 European Heart Rhythm Association/Heart Rhythm Society/Asia Pacific Heart Rhythm Society/Latin American Heart Rhythm Society expert consensus statement on catheter and surgical ablation of AF stated that follow-up after AF ablation does not need to take place face to face. Remote consultations are feasible, and digital devices can be used to record AF ablation outcomes.15,16 A mobile health approach for remote AF management covering most requirements outlined by expert consensus statements is TeleCheck-AF, which includes a teleconsultation combined with a smartphone application that uses photoplethysmography (PPG) technology for on-demand monitoring of heart rate, heart rhythm, and symptoms.17,18 Simultaneous smartphone app-based heart rate, heart rhythm, and symptom evaluation helps to assess symptom–rhythm correlation (SRC) around electrical cardioversion.19 This approach may also provide an opportunity to approximate time spent with AF and/or symptoms and the derived SRC in patients after AF ablation. This, however, has not yet been introduced and evaluated in the clinical scenario of post-AF ablation follow-up.
In patients scheduled for at least one remote TeleCheck-AF follow-up after AF catheter ablation, we tested the feasibility and patient experience of smartphone app-based approximation of time spent with AF and introduce the principle of smartphone app-based approximation of time spent with symptoms derived from simultaneous intermittent symptom and rhythm monitoring.
Methods
Study design
This is a sub-analysis of the TeleCheck-AF project.20 In brief, TeleCheck-AF is an international, multicentre, on-demand mobile health infrastructure, initially dedicated to allowing continuous and comprehensive AF management and to support integrated care during the COVID-19 pandemic. TeleCheck-AF involves a structured teleconsultation (‘Tele’), preceded by a smartphone app-based on-demand heart rate, heart rhythm, and symptom monitoring infrastructure (‘Check’) to provide comprehensive AF management (‘AF’). The retrospective data collection was conducted in accordance with the Declaration of Helsinki and approved by the local ethics committees of the participating centres.
Study population
From April 2020 to July 2021, patients were included in the TeleCheck-AF project in eight European cardiology centres: (i) Maastricht University Medical Centre + (MUMC+), Maastricht, The Netherlands; (ii) Radboud University Medical Center, Nijmegen, The Netherlands; (iii) Hannover Heart Rhythm Center, Hannover, Germany; (iv) University Hospital Cologne, Cologne, Germany; (v) Medical University of Graz, Graz, Austria; (vi) Ziekenhuis Oost-Limburg, Genk, Belgium; (vii) University Hospitals Leuven, Leuven, Belgium; and (viii) Medical University of Warsaw, Warsaw, Poland. Participating patients were eligible if they were ≥18 years, scheduled for at least one teleconsultation for the follow-up after AF ablation, had a smartphone, and were willing to use the on-demand mobile application. Informed consent was retrieved from all participants. To avoid too low sampling rate in the calculations of time spent with AF and/or symptoms, only patients with ≥7 PPG recordings with adequate signal quality (i.e. recordings with sufficient signal quality for heart rhythm assessment) within the 7-day monitoring period were included in the analysis.
The remote follow-up approach after atrial fibrillation ablation
Patients scheduled for at least one teleconsultation during the 12-month follow-up after AF ablation were provided with a CE-marked smartphone application using PPG technology (FibriCheck®, Qompium, Hasselt, Belgium). Routinely, patients are scheduled for appointments at 3, 6, and 12 months after AF ablation. Each individual patient’s analysis included only the first seven consecutive days of monitoring, which means that mainly the 7-day monitoring period at the 3-month follow-up was used. However, if any patient missed his/her 3-month follow-up, the 7-day monitoring period at the 6- or 12-month follow-up was used.
On-demand access to the smartphone application was prescribed in the form of a temporary QR code, and an instruction for heart rate and heart rhythm measurements was provided. A case coordinator was responsible for sending the prescription and instructing the patients on how to use the application. Within 24 h of sending the prescription, the case coordinator evaluated whether the patients could activate and use the application. Once the application was activated, the PPG recordings and corresponding symptom statuses were instantly synchronized to a secured and certified cloud (www.fibricheck.com), to which the treating physician and research team had access.
Patients were instructed to record a 60-s PPG recording through their smartphone’s built-in camera three times daily and when experiencing symptoms. Further, after completing a recording, patients had to specify if they encountered any of the following symptoms: no symptoms, palpitations, chest pain, dyspnoea, confusion, light-headedness, fatigue, and/or others. Patients received regular reminders to assess their heart rate/heart rhythm and to actively report the presence/absence of symptoms via pop-up notifications. Additionally, patients were given instructions on how to improve the quality of measurements.17
Data collection
Baseline patient demographic and comorbidity data were retrieved from medical records and entered into the electronic case report form stored in the web-based central Castor EDC database. All records were labelled with an individual number. The key list with record numbers was accessible only to the local coordinating researcher of each centre. Heart rate/heart rhythm status and corresponding symptom status of each PPG recording were retrieved from the secured and certified cloud.
Data analysis
Smartphone app-based assessment of time spent with atrial fibrillation
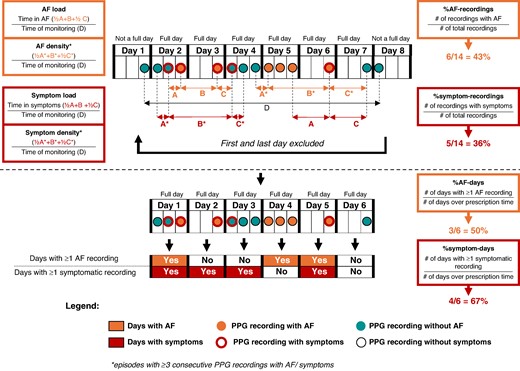
The presence of AF during the respective PPG recording was determined by a validated PPG algorithm (FibriCheck®, Qompium, Hasselt, Belgium) with a sensitivity of 98.3% and a specificity of 99.9% for AF detection,21 followed by an additional overread by a certified technician. Time spent with AF was approximated using the four following definitions: (i) %AF recordings: proportion of AF recordings per all recordings; (ii) AF load: the proportion of time spent with AF to the total monitoring time (time spent with AF/total monitoring time). Time spent with AF respective total monitoring time are calculated as follows: time spent with AF = sum of time between the last PPG recording with non-AF and the first PPG recording with AF divided by two, plus time between the first and last consecutive PPG recording with AF, plus time between last PPG recording with AF and the first PPG recording with non-AF divided by two; total monitoring time = the time between the first and the last PPG recording during the monitoring period; (iii) %AF days: proportion of days with at least one recording with AF per all complete monitoring days (i.e. 6 days; the first and last day of monitoring was removed, as these were non-complete days); (iv) AF density is a measure of time spent with AF to total monitoring time, just like AF load, and the calculation is the same with the exception that in the sum of time spent with AF, only AF episodes with at least three consecutive PPG recordings with AF are included. We defined a low-density score <50% as ‘paroxysmal AF pattern’ and a high-density score ≥90% as ‘persistent AF pattern’. For more details, see Figure 1.
Smartphone app-based assessment of time spent with atrial fibrillation and/or symptoms.
Smartphone app-based assessment of time spent with symptoms
Time spent with symptoms was approximated using the four following definitions: (i) %symptom recordings: proportion of symptomatic recordings per all recordings; (ii) symptom load: the proportion of time spent with symptoms to the total monitoring time (time spent with symptoms/total monitoring time). Time spent with symptoms respective total monitoring time are calculated as follows: time spent with symptoms = sum of time between the last PPG recording without symptoms and the first PPG recording with symptoms divided by two, plus time between the first and last consecutive PPG recording with symptoms, plus time between last PPG recording with symptoms and the first PPG recording without symptoms divided by two; total monitoring time = the time between the first and the last PPG recording during the monitoring period; (iii) %symptom days: proportion of days with at least one recording with symptoms per all complete monitoring days (i.e. 6 days; the first and last day of monitoring was removed, as these were non-complete days); (iv) symptom density is a measure of time spent with symptoms to total monitoring time, just like symptom load, and the calculation is the same with the exception that in the sum of time spent with symptoms, only symptomatic episodes with at least three consecutive PPG recordings with symptoms are included. For more details, see Figure 1.
Symptom–rhythm correlation assessment
Symptom–rhythm correlation was assessed through the SRC index.19 The SRC index is defined as the ratio between the number of symptomatic AF recordings and asymptomatic non-AF recordings to all recordings regardless of symptom status.
Statistical analysis
Continuous variables are presented as mean ± standard deviation (SD) if normally distributed and as median [interquartile range (IQR)] if not normally distributed. Normality was assessed by visual inspection of graphs and plots and by the Shapiro–Wilk test. Categorical variables are presented as counts (n) and proportions (%). Continuous variables were compared using independent samples t-test (normally distributed) or the Mann–Whitney U test (non-normally distributed). To compare medians for more than two paired variables, Friedman test was used and Dunn’s multiple comparisons test for between-group comparisons. Categorical variables were compared using Pearson’s χ2 test or Fisher’s exact test. Spearman’s correlation was used to quantify the relationship between %AF recordings, AF load, %AF days, AF density, %symptom recordings, symptom load, %symptom days, symptom density, and SRC index.
All tests were two sided with a significant threshold of P < 0.05. Statistical analyses were performed using IBM SPSS Statistics version 29.0 (IBM, NY, USA) and GraphPad Prism 10.0.2 (GraphPad Inc., CA, USA).
Results
In eight TeleCheck-AF centres, 530 consecutive AF patients were available in the database, of whom 484 patients had ≥7 PPG recordings with adequate signal quality within the 7-day monitoring period. These were included in the analysis. The mean age was 62 ± 9.9 years, 60% of participants being male. The clinical AF phenotype pre-ablation was paroxysmal in 69% and persistent in 31%. The baseline demographic, comorbidity, medication, and echocardiographic parameters were comparable between patients with and without AF during the 7-day monitoring period. However, patients with symptoms during the 7-day monitoring period had higher prevalence of hypertension and chronic obstructive pulmonary disease compared to patients without symptoms (Table 1). Moreover, symptomatic patients were more often female and were more often on class IC antiarrhythmic treatment (Table 1). For all patients, the median number of PPG recordings was 20 (IQR: 16–24, range: 7–99), and for patients with at least one episode with AF (n = 79; 16%), it was 23 (IQR 19–28, range: 7–99). The overall median (IQR) patient motivation and adherence22 were 67% (17–83%) and 89% (67–100%) (Supplementary material online, Figure S1). Patient experience was assessed in the 126 patients who responded to the electronic patient experience survey,20 98% agreed or strongly agreed that the application was easy to use, while 70% agreed or strongly agreed that the daily reminders on making a recording were useful and 59% agreed or strongly agreed that they would like to use the application in the future (Supplementary material online, Figure S2).
Baseline characteristics of the total study population and divided categorically for the occurrence of AF and/or symptoms during the 7-day monitoring period
| All patients | AF categorical | Symptom categorical | |||||
|---|---|---|---|---|---|---|---|
| Variable | (n = 484) | No AF (n = 405) | AF (n = 79) | P-value | No symptoms (n = 203) | Symptoms (n = 281) | P-value |
| Demographics | |||||||
| Age (years), mean ± SD | 62.2 ± 9.9 | 62.1 ± 10.1 | 62.9 ± 9.1 | 0.490 | 61.1 ± 10.2 | 63.0 ± 9.6 | 0.044 |
| Male | 290 (60%) | 246 (61%) | 44 (56%) | 0.452 | 148 (73%) | 142 (51%) | <0.001 |
| BMI (kg/m2), median (IQR) | 26.8 (4.9); n = 482 | 26.7 (5.1); n = 403 | 27.2 (4.6) | 0.564 | 26.9 (4.4); n = 201 | 26.9 (5.6) | 0.999 |
| AF | |||||||
| Paroxysmal AF | 251 (69%); n = 364 | 207 (70%); n = 297 | 44 (66%); n = 67 | 0.560 | 99 (69%); n = 144 | 152 (69%); n = 220 | 0.518 |
| Persistent AF | 113 (31%); n = 364 | 90 (30%); n = 297 | 23 (34%); n = 67 | 45 (31%); n = 144 | 68 (31%); n = 220 | ||
| Previous cardioversion | 198 (53%); n = 373 | 156 (51%); n = 306 | 42 (63%); n = 67 | 0.104 | 79 (53%); n = 149 | 119 (53%); n = 224 | 0.534 |
| Previous AF ablation | 249 (67%); n = 374 | 203 (66%); n = 307 | 46 (69%); n = 67 | 0.776 | 103 (69%); n = 149 | 146 (65%); n = 225 | 0.230 |
| Medical history | |||||||
| Hypertension | 245 (51%) | 203 (50%) | 42 (47%) | 0.625 | 93 (46%) | 152 (54%) | 0.044 |
| Diabetes mellitus | 32 (6.6%) | 24 (5.9%) | 8 (10%) | 0.340 | 12 (5.9%) | 20 (7.1%) | 0.370 |
| Congestive heart failure | 57 (12%) | 46 (11%) | 11 (14%) | 0.556 | 27 (13%) | 30 (11%) | 0.229 |
| Ischaemic stroke/TIA | 36 (7.4%) | 32 (8.0%) | 6 (8%) | 0.747 | 12 (3.4%) | 24 (3.6%); n = 280 | 0.272 |
| Coronary artery disease | 58 (12%) | 51 (13%) | 7 (9%) | 0.450 | 23 (11%) | 35 (13%) | 0.410 |
| Valvular heart disease | 88 (18.1%) | 72 (18%) | 16 (20%) | 0.400 | 35 (18%); n = 200 | 47 (17%); n = 278 | 0.480 |
| Congenital heart disease | 13 (3.4%); n = 374 | 10 (3.2%); n = 307 | 3 (5%); n = 67 | 0.203 | 6 (4.0%); n = 149 | 7 (3.1%); n = 225 | 0.636 |
| Chronic obstructive pulmonary disease | 22 (4.5%) | 18 (4.4%) | 4 (5%) | 0.769 | 5 (2.5%) | 17 (6.0%) | 0.047 |
| Sleep apnoea | 36 (9.5%); n = 377 | 30 (9.4%); n = 320 | 6 (11%); n = 57 | 0.807 | 11 (6.8%); n = 161 | 25 (11.6%); n = 216 | 0.084 |
| Chronic kidney disease | 26 (5.4%) | 23 (5.7%) | 3 (4%) | 0.784 | 10 (4.9%) | 16 (5.7%) | 0.438 |
| Peripheral vascular disease | 7 (1.4%) | 6 (1.5%) | 1 (1%) | 1.000 | 4 (2.0%) | 3 (1.1%) | 0.327 |
| Smoking (current/former) | 121 (36%); n = 338 | 103 (38%); n = 275 | 18 (29%); n = 63 | 0.194 | 55 (40%); n = 136 | 66 (33%); n = 202 | 0.090 |
| Thromboembolic risk | |||||||
| CHA2DS2-VASc score median (IQR) | 2 (2); n = 476 | 2 (2); n = 397 | 2 (2) | 0.394 | 1 (2); n = 200 | 2 (2); n = 276 | <0.001 |
| CHA2DS2-VASc score ≥2 (m), ≥3 (f) | 203 (47%); n = 435 | 168 (47%); n = 360 | 35 (47%); n = 75 | 1.000 | 78 (44%); n = 177 | 125 (48%); n = 258 | 0.211 |
| TTE measurements | |||||||
| LVEF (%), median (IQR) | 60 (12); n = 261 | 60 (11); n = 216 | 55 (12); n = 45 | 0.050 | 60 (11); n = 110 | 60 (12); n = 151 | 0.917 |
| LA volume (mL), median (IQR) | 81 (34); n = 170 | 82 (37); n = 144 | 76 (34); n = 26 | 0.493 | 83 (28); n = 73 | 79 (41); n = 97 | 0.442 |
| LA diameter (mm), median (IQR) | 42.5 (13); n = 198 | 42.5 (12); n = 162 | 42.5 (14); n = 36 | 0.608 | 42 (15); n = 81 | 43 (13); n = 117 | 0.544 |
| Medication | |||||||
| Oral anticoagulants | 421 (87%); n = 483 | 348 (86%); n = 404 | 73 (92%) | 0.144 | 173 (86%); n = 202 | 248 (88%) | 0.238 |
| Antiplatelets | 8 (1.7%); n = 483 | 7 (1.7%); n = 404 | 1 (1%) | 1.000 | 3 (1.5%); n = 202 | 5 (1.8%) | 0.552 |
| RAAS blockade | 205 (42%); n = 483 | 173 (43%); n = 404 | 32 (41%) | 0.804 | 87 (43%); n = 202 | 118 (42%) | 0.443 |
| MRA | 24 (5.0%); n = 483 | 19 (4.7%); n = 404 | 5 (6%) | 0.570 | 10 (5.0%); n = 202 | 14 (5.0%) | 0.582 |
| Diuretics | 74 (15%); n = 482 | 57 (14%); n = 403 | 17 (22%) | 0.123 | 26 (13%); n = 202 | 48 (17%); n = 280 | 0.124 |
| Beta-blockers | 261 (54%); n = 483 | 214 (53%); n = 404 | 47 (60%) | 0.324 | 104 (52%); n = 202 | 158 (56%) | 0.194 |
| Dihydropyridine CCB | 45 (9.3%); n = 482 | 37 (9.2%); n = 403 | 8 (10%) | 0.832 | 16 (7.9%); n = 202 | 29 (10%); n = 280 | 0.228 |
| Non-dihydropyridine CCB | 15 (4.0%); n = 372 | 13 (4.3%); n = 305 | 2 (3%); n = 67 | 1.000 | 6 (4.1%); n = 148 | 9 (4.0%); n = 224 | 0.593 |
| Digitalis | 12 (2.5%); n = 483 | 7 (1.7%); n = 404 | 5 (6%) | 0.032 | 3 (1.5%); n = 202 | 9 (3.2%) | 0.185 |
| Class IC antiarrhythmic drugs | 82 (22%); n = 374 | 63 (21%); n = 306 | 19 (28%); n = 67 | 0.192 | 24 (16%); n = 149 | 58 (26%); n = 225 | 0.018 |
| Class III antiarrhythmic drugs | 88 (24%); n = 373 | 74 (24%); n = 306 | 14 (21%); n = 67 | 0.636 | 33 (22%); n = 149 | 55 (25%); n = 224 | 0.342 |
Reported values are n (%), mean ± SD, and median (IQR). Data provided after semicolon indicated available data per variable. Statistical tests used: independent samples t-test, non-parametric Mann–Whitney U test, χ2 test, and Fisher’s exact test. P ≤ 0.05 was regarded as significant. Significant values are depicted in bold text.
AF, atrial fibrillation; BMI, body mass index; CCB, calcium channel blocker; CHA2DS2-VASc, congestive heart failure, hypertension, age >75 years (2 points), diabetes mellitus, stroke (2 points), vascular disease, age 65–74 and sex (female); IQR, interquartile range; LA, left atrial; LVEF, left ventricular ejection fraction; MRA, mineralocorticoid receptor antagonist; RAAS, renin–angiotensin–aldosterone system; SD, standard deviation; TIA, transient ischaemic attack; TTE, transthoracic echocardiography.
Smartphone app-based assessment of time spent with atrial fibrillation
The median (IQR) of %AF recordings, AF load, %AF days, and AF density was all 0 (0–0%) as 405 patients had no AF episode during the 7-day monitoring period (Supplementary material online, Figure S3). The three metrics %AF recordings, AF load, and %AF days correlated positively with each other (rs = 0.88–0.95). Atrial fibrillation density, which rather is a measure of temporal aggregation of AF, also correlated positively to the other metrics (rs = 0.75–0.83) (Figure 2; correlation matrix separately for patients with paroxysmal and persistent AF before ablation in Supplementary material online, Figure S4).
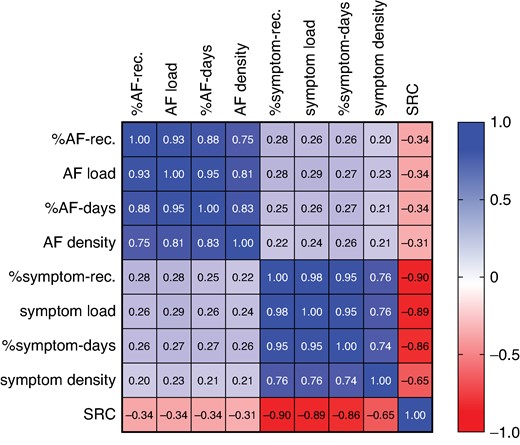
Spearman’s correlation matrix for all patients (n = 484) including the following variables: %AF-rec., AF load, %AF days, AF density, %symptom-rec., symptom load, %symptom days, symptom density, and SRC. AF, atrial fibrillation; rec., recordings; SRC, symptom–rhythm correlation.
In patients with at least one AF episode (n = 79), the median (IQR) %AF recordings, AF load, %AF days, and AF density were 20% (11–46%), 20% (7–56%), 33% (17–83%), and 9% (0–50%) (P < 0.0001), respectively (Figure 3A; between-group comparisons in Supplementary material online, Table S1A). The individual variation in the four different AF metrics is displayed in Figure 4A. In patients with paroxysmal AF (n = 44) before the ablation, the median (IQR) %AF recordings, AF load, %AF days, and AF density were 18% (11–28%), 20% (7–33%), 33% (17–67%), and 7% (0–32%) (P < 0.0001), respectively. In patients with persistent AF (n = 23) before the ablation, the corresponding numbers were 55% (13–96%), 56% (7–100%), 80% (33–100%), and 56% (0–100%) (P < 0.0001) (Figure 3B; between-group comparisons in Supplementary material online, Table S1B and C). Patients with persistent AF before the AF ablation had significantly higher %AF recordings [55% (13–96%) vs. 18% (11–28%), P = 0.018] and %AF days [80% (33–100%) vs. 33% (17–67%), P = 0.012] than patients with paroxysmal AF before the AF ablation. This was also seen for AF load [56% (7–100%) vs. 20% (7–33%), P = 0.073] and AF density [56% (0–100%) vs. 7% (0–32%), P = 0.073], although it did not turn out to be significant.
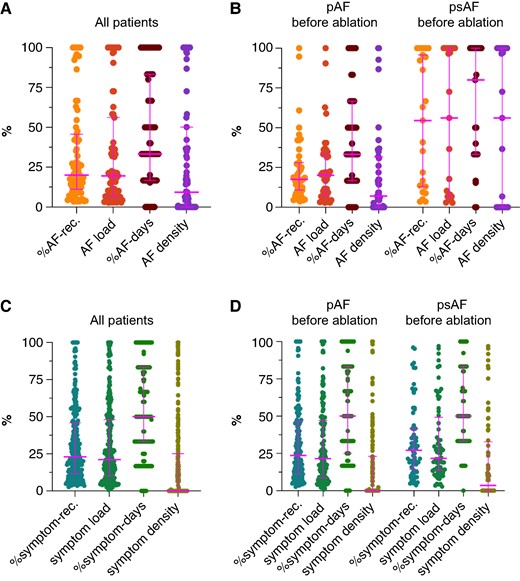
(A + B) Median and interquartile range for %AF-rec., AF load, %AF days, and AF density. (A) All patients with at least one episode of AF during the 7-day monitoring period (n = 79). (B) Patients with at least one episode of AF during the 7-day monitoring period are divided in patients with paroxysmal (n = 44) and persistent (n = 23) AF before the AF ablation. (C + D) Median and interquartile range for %symptom-rec., symptom load, %symptom days, and symptom density. (C) All patients with at least one symptomatic episode during the 7-day monitoring period (n = 281). (D) Patients with at least one symptomatic episode during the 7-day monitoring period are divided in patients with paroxysmal (n = 152) and persistent AF (n = 68) before the AF ablation. AF, atrial fibrillation; pAF, paroxysmal AF; psAF, persistent AF; rec., recordings.
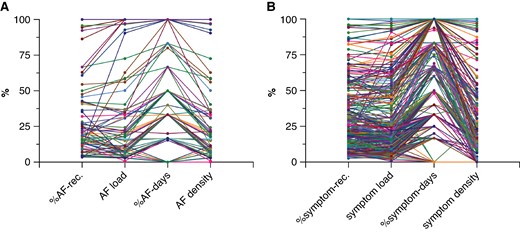
(A) Individual variation in %AF-rec., AF load, %AF days, and AF density for each patient with at least one episode of AF during the 7-day monitoring period (n = 79). (B) Individual variation in %symptom-rec., symptom load, %symptom days, and symptom density for each patient with at least one symptomatic episode during the 7-day monitoring period (n = 281). AF, atrial fibrillation; rec., recordings.
In patients with paroxysmal AF before the ablation and with at least one AF episode, 87% (n = 39/44) had a low-density score <50% (‘paroxysmal AF pattern’) while 5% (n = 2/44) had a high-density score above 90% (‘persistent AF pattern’). In patients with persistent AF before the ablation, 48% (n = 11/23) had a low-density score and 43% (n = 10/23) a high-density score.
Smartphone app-based assessment of time spent with symptoms
The medians (IQR) of %symptom recordings, symptom load, %symptom days, and symptom density were 7% (0–29%), 6% (0–26%), 17% (0–50%), and 0 (0–7%) (P < 0.0001) (Supplementary material online, Figure S3). The three metrics %symptom recordings, symptom load, and %symptom days correlated positively with each other (rs = 0.95–0.98). Symptom density, which rather is a measure of temporal aggregation of symptoms, also correlated positively to the other metrics (rs = 0.74–0.76) (Figure 2; correlation matrix separately for patients with paroxysmal and persistent AF before ablation in Supplementary material online, Figure S4).
In patients with at least one symptomatic recording (n = 281), the median (IQR) %symptom recordings, symptom load, %symptom days, and symptom density were 23% (12–46%), 21% (10–48%), 50% (33–83%), and 0 (0–25%) (P < 0.0001), respectively (Figure 3C; between-group comparisons in Supplementary material online, Table S1D). The individual variation in the four different symptom metrics is displayed in Figure 4B. In patients with paroxysmal AF (n = 152) before the ablation, the median (IQR) %symptom recordings, symptom load, %symptom days, and symptom density were 24% (11–47%), 21% (9–47%), 50% (25–83%), and 0 (0–23%) (P < 0.0001), respectively. In patients with persistent AF (n = 68) before the ablation, the corresponding numbers were 27% (14–42%), 22% (14–49%), 50% (33–83%), and 4% (0–33%) (P < 0.0001) (Figure 3D; between-group comparisons in Supplementary material online, Table S1E and F). No difference in %symptom recordings, symptom load, %symptom days, and symptom density were seen between patients with paroxysmal AF and persistent AF before ablation (Figure 3D).
App-based assessment of symptom–rhythm correlation
In total, there were 10 052 PPG recordings. Twenty per cent (n = 2052) were symptomatic, of which 16% (n = 319) were recorded during AF and 62% (n = 1267) during sinus rhythm. The most common symptoms during AF were palpitations 55% (175/319) and racing heart 20% (65/319). For sinus rhythm, fatigue 32% (407/1267) and palpitations 26% (334/1267) were the most frequent symptoms.
The median (IQR) proportion of symptomatic AF PPG recordings to all AF PPG recordings was 67% (12–100%), whereas the median (IQR) proportion of asymptomatic non-AF PPG recordings to all non-AF PPG recordings was 94% (75–100%), resulting in a high median (IQR) SRC index of 93% (72–100%).
The four different symptom variables showed negative correlations to the SRC index (rs = −0.65–0.90), indicating that SRC drops with more symptomatic recordings. Likewise, the four different AF variables showed negative correlations to the SRC index (rs = −0.31–0.34), indicating that SRC drops with more AF recordings (Figure 2; correlation matrix separately for patients with paroxysmal and persistent AF before ablation in Supplementary material online, Figure S4).
Discussion
In a large patient population from eight European high-volume centres for AF ablation procedures, we showed that an on-demand 7-day monitoring period with three times daily measurements using a PPG-supported smartphone application is feasible and allowed extended characterization of AF episodes in patients after AF ablation by introducing proxies for time spent with AF (%AF recordings, AF load, %AF days, and AF density) and time spent with symptoms (%symptom recordings, symptom load, %symptom days, and symptom density). Additionally, the simultaneously rhythm and symptom assessment allowed evaluating SRC with a favourable patient experience.
Classically, AF burden is derived from continuous rhythm monitoring and defined as percentage of monitoring time with AF.4 Nevertheless, a wider clinical implementation requires exploration of additional, potentially more suitable and scalable methods for approximating AF burden.4 In the DECAAF II trial, the ‘smartphone atrial fibrillation burden (SMURDEN)’ was defined as the proportion of days with electrocardiogram (ECG) strips showing AF out of the total days with submitted ECG strips.14 A prior definition of AF burden within the DECAAF II trial defined AF burden as the proportion of single-lead ECG strips containing AF events to the total number of ECG strips submitted.13 The key difference is that the latter definition uses the proportion of individual ECG strips showing AF, whereas the recent definition classifies AF burden based on daily presence of AF.
In the TeleCheck-AF project, we used data collected during on-demand 7-day monitoring period with three times daily measurements using a PPG-supported smartphone application and analysed three metrics to approximate time spent with AF: (i) number of recordings with AF per number of total recordings (%AF recordings); (ii) time in AF per time of monitoring (AF load); and (iii) number of days with at least one AF recording per number of complete days (%AF days). One new finding is that all three metrics correlated strongly with each other, suggesting that findings from studies using different ways to assess time spent with AF through a smartphone application could be compared to each other. However, %AF recordings, AF load, and %AF days cover different time domains (from recordings to days). While the DECAAF II trial13,14 used a daily recording and additional recordings in case of symptoms, our approach used three daily recordings, which enables the introduction of time-dependent metrics, like AF load and AF density, which allow a more detailed characterization of AF episodes. Yet, our approach with three daily recordings requires a greater patient effort and even though the overall adherence and motivation in our study population was high, we cannot exclude it would decrease with longer follow-up times as in the DECAAF II trial.13,14 We acknowledge that these proxies do not capture the exact time spent with AF, but instead use a time average, that might be subjected to over- or underestimation of time spent with AF. However, the three times daily measurements and the possibility of symptom-triggered additional PPG recordings minimize the time window between non-AF and AF recordings. The novel definitions presented in the current analysis therefore offer a detailed and scalable method for approximating time spent with AF.
Traditionally, follow-up after AF ablation has involved repeated continuous rhythm monitoring for a short duration by 24–48 h Holter monitors. While the continuous rhythm monitoring is a strength, the short duration makes them prone to underestimating AF recurrence,11 and the assessment of AF burden unreliable as the arrhythmia burden varies considerably on a day-to-day basis.23 On the contrary, on-demand PPG-based rhythm monitoring, as used in our study, enables longer monitoring periods at the expense of no continuous monitoring. However, with PPG recordings three times daily and in case of symptoms, the AF episode needs to be short and asymptomatic to be missed. With longer monitoring periods, the day-to-day variability in arrhythmia occurrence can be captured and time spent with AF can be approximated.
The type of AF recurrence (paroxysmal and persistent AF) is an emerging endpoint in AF ablation trials. We introduce AF density as a novel variable reflecting the temporal aggregation of AF derived from three-daily on-demand 7-day monitoring period using a PPG-supported smartphone application: a high AF density (>90%) is suggesting a persistent AF pattern, and low AF density (<50%) is suggesting a paroxysmal AF pattern. We found that AF recurrences in patients classified as persistent AF before AF ablation are predominantly characterized by paroxysmal AF episodes. This is in line with the observation from the CAPLA study, where AF recurrence was more often paroxysmal after catheter ablation for persistent AF.24 Interestingly, in the CAPLA study,24 recurrent persistent AF was associated with higher AF burden, increased healthcare utilization, and antiarrhythmic drug use. Additionally, AF recurrences in patients classified as paroxysmal AF before AF ablation were almost never characterized by persistent AF episodes. This is in line with the observations from the 3-year follow-up of the EARLY-AF trial,25 where the incidence of persistent AF or recurrent atrial tachyarrhythmias was lower among patients who underwent initial cryoballoon ablation than among patients who received first-line antiarrhythmic treatment. Additionally, the assessment of AF progression is important, as AF progression26 is associated with more healthcare utilization, reduced quality of life, and increased numbers of hospitalizations.
Besides the detailed assessment of AF episodes during follow-up after AF ablation, we also introduced the principle of smartphone app-based assessment of symptoms and the approximation of time spent with symptoms. In TeleCheck-AF, we used an active interrogation of the presence of symptoms. Patients were asked to score if a symptom was present, and asymptomatic patients were clearly identified as they were scoring ‘no symptoms’. This is different to other approaches, e.g. in the case of symptom assessment in patients with implantable loop recorders or Holters, patients are not actively approached for systematic symptom assessment, but symptoms are just logged, when patients decide to report them. In this scenario, absence of scored symptoms cannot be taken as absence of symptoms. Besides this, also the quality of symptoms was interrogated.27 Interestingly, the simultaneous rhythm and symptoms assessment allowed to determine the SRC, which was generally high with a median SRC index of 93% (72–100%). As the patients score their symptoms after the PPG recording, this approach minimizes false-negative SRCs from self-terminating episodes before being able to start a PPG recording. Nevertheless, just 67% of AF episodes were symptomatic, which resulted in an overall poor correlation between the time spent with symptoms and time spent with AF, irrespective of the definition used. The SRC drops with more symptomatic recordings and with more AF recordings due to increasing symptomatic non-AF recordings and asymptomatic AF recordings.
Clinical implications and perspectives
Implementation of the above 7-day monitoring period by the on-demand use of a PPG-supported smartphone application may support clinical decision-making. In the DECAAF study, a high AF burden assessed by a wearable ECG device (within a 90-day blanking period) was a predictor for post-ablation arrhythmia recurrences.13,14 We previously showed that PPG rhythm telemonitoring during the first week after AF ablation often triggered clinical interventions.28 In the case of low proportion of time spent with AF, but high proportion of time spent with symptoms and/or overall low SRC, focusing on management of comorbidities in addition to rhythm control strategies should be triggered. Also, the timing of AF initiation and termination may be of interest.29
We acknowledge that continuous rhythm monitoring is the most accurate way to assess AF burden, but serial long-term ECG measurements provide reasonable quantification of AF burden after AF ablation.11 With increasing numbers of patients with AF and patients undergoing AF ablation, non-invasive PPG-supported on-demand monitoring is a low-cost, accessible, and scalable alternative compared to continuous (invasive) monitoring as follow-up strategy after AF ablation. We provide proxies for AF burden, which do not strictly provide the exact time spent with AF, but rather approximate the average time spent with AF. Nevertheless, our approach allows extensive characterization of AF episodes into frequent and short episodes (paroxysmal AF pattern) or few and long (persistent AF pattern) episodes that can provide an idea of the underlying arrhythmia substrate and help guide clinical decisions. Furthermore, a user-friendly mobile health solution for AF ablation follow-up has potential to facilitate patient involvement as an integral part of multidisciplinary AF management.1
In a recent European Heart Rhythm Association survey, reimbursement appeared as one major limitation to widespread implementation of mobile health applications.30 In The Netherlands, a detailed analysis of changes in healthcare utilization during the implementation of remote AF management within the TeleCheck-AF project31 created the basis for a new national reimbursement code in The Netherlands, which may serve as a roadmap for future development of digital AF care reimbursement models. Besides this, assessment of self-reported risk factors and response through wearables may constitute an extension of the TeleCheck-AF approach32 and the basis for novel innovative strategies of performance-based and value-based reimbursement of AF ablation procedures.33
Limitations
Our study has several limitations. First, although the motivation and adherence of patients to perform three PPG recordings daily for 1 week was good in the TeleCheck-AF project, variations in numbers of recordings may impact the assessment of the time spent with AF and symptoms. The 7-day monitoring period of intermittent measurements might not capture the full variability of time spent with AF over longer periods, potentially missing intermittent or rare AF episodes. However, while longer monitoring durations may provide more comprehensive data and give insights into the long-term utility, motivation and adherence to use the smartphone application will drop (‘mobile fatigue’). Future studies should test the utility to include repeated 7-day monitoring periods in the assessment of the time spent with AF and/or symptom as well as SRC. Nevertheless, the clinical relevance of rare AF episodes and low AF burden remains unclear. Second, different technologies and approaches for smartphone app-based approximation of time spent with AF limit the generalizability of these approaches, but these novel approaches can offer advantages such as cost-effectiveness and ease of use. Third, there may be selection bias, as we only included patients who had undergone AF ablation and were willing to use the smartphone application. A certain amount of digital competence and access to a smartphone were required to participate, and a selection bias may have been created regarding age, gender, digital competence, and socioeconomic status. Fourth, most, but not all patients were included at the 3-month follow-up, and thus, some patients performed rhythm monitoring at a later stage of their follow-up. The likelihood of AF recurrence may vary depending on the time point for assessment. Therefore, we do not refer to ‘AF recurrence’, but focus on the description of ‘the presence and pattern of AF’ at one scheduled follow-up time point after AF ablation. Finally, future studies are required to validate time spent with AF and/or symptom as well as SRC against clinical outcomes.
Conclusions
Within the TeleCheck-AF approach, a 7-day monitoring period by the on-demand use of a PPG-supported smartphone application for simultaneous rhythm and symptom assessment allowed an extended characterization of AF episodes in patients after AF ablation. The ability to provide objective proxies of time spent with AF, time spent with symptoms, SRC, and AF patterns (paroxysmal vs. persistent) may help to accelerate the current shift from evaluating AF in a binary fashion (present or absent) to the assessment of AF burden and symptom burden as clinical endpoints after AF ablation procedures.
Supplementary material
Supplementary material is available at Europace online.
Acknowledgements
The mobile health infrastructure was provided for free within the TeleCheck-AF project by the MUMC+ and additionally supported by FibriCheck® and Biosense Webster®.
Funding
The funder was not involved in the study design, collection, analysis, interpretation of data, the writing of this article, or the decision to submit it for publication.
Data availability
The data underlying this article will be shared on reasonable request to the corresponding author.
References
Author notes
Emma Sandgren, Astrid N L Hermans, Monika Gawalko and Konstanze Betz contributed equally to this work.
Conflict of interest: E.S., A.N.L.H., M.G., K.B., A.So., C.H.F., R.M.J.v.d.V., D.V., D.Sc., A.Su., D.St., R.P., M.H., P.L., D.G., H.G., N.A.H.A.P., J.M.H., M.N., M.M., and D.L. declared no conflict of interests. D.D. received modest lecture honorary, travel grants, and/or a fellowship grant from Abbott, AstraZeneca, Biotronik, Boehringer Ingelheim, Boston Scientific, Bristol Myers Squibb, CVRx, Medtronic, Microport, Pfizer, Sanofi, and Zoll. H.A.K.H. received modest lecture honorary and/or a fellowship grant from AstraZeneca, Boston Scientific, and Zoll.
