


Abstract
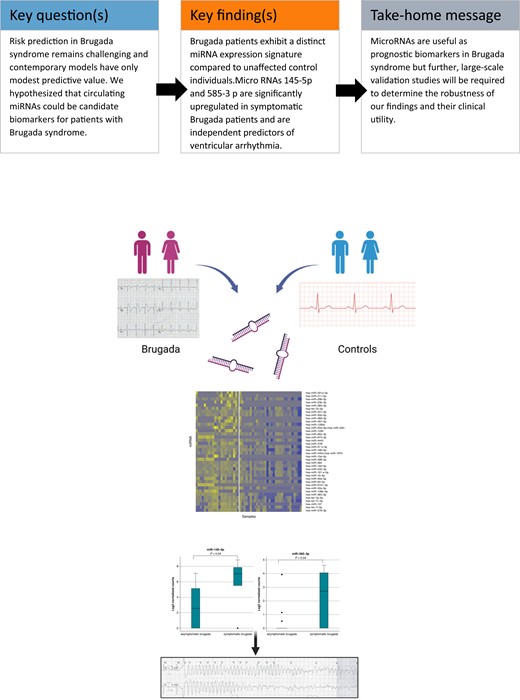
Risk stratification for sudden cardiac death in patients with Brugada syndrome remains a major challenge. Contemporary risk prediction models have only modest predictive value. The aim of this study was to assess the role of micro-RNAs from peripheral blood as candidate biomarkers in Brugada syndrome.
In this prospective study, Brugada patients and unaffected control individuals were enrolled for analysis of leucocyte-derived microRNAs (miRNAs) levels. Expression levels of 798 different circulating miRNAs were analysed on the NanoString® nCounter platform. All results were cross-validated by using a quantitative polymerase chain reaction. Micro-RNA expression levels of Brugada patients were compared with clinical data. A total of 21 definite Brugada patients (38% with a history of ventricular arrhythmia or cardiac arrest) and 30 unaffected control individuals were included in the study. Micro-RNA analysis showed a distinct expression profile in Brugada patients with 42 differentially expressed markers (38 up-regulated, 4 down-regulated miRNAs). The symptom status of Brugada patients was associated with a distinct miRNA signature. Micro-RNAs 145-5p and 585-3p were significantly up-regulated in symptomatic Brugada patients (P = 0.04). Incorporating miRNAs 145-5p and 585-3p into a multivariable model demonstrated significantly increased symptom prediction (area under the curve = 0.96; 95% confidence interval: 0.88–1.00).
Brugada patients display a distinct miRNA expression profile compared with unaffected control individuals. There is also evidence that certain miRNAs (miR-145-5p and miR-585-3p) are associated with the symptom status of Brugada patients. The results suggest the principal utility of leucocyte-derived miRNAs as prognostic biomarkers for Brugada syndrome.
Brugada patients display a distinct microRNA (miRNA) expression profile compared with unaffected control individuals.
There is evidence that certain miRNAs are associated with the symptom status of Brugada patients.
Our results suggest the principal utility of leucocyte-derived miRNAs as candidate biomarkers for Brugada syndrome.
Introduction
Brugada syndrome is a rare, potentially life-threatening primary electrical disease and an important cause of sudden unexplained death/cardiac arrest in otherwise healthy individuals.1–3 While the majority of Brugada patients remain asymptomatic, cardiac arrest is the presenting manifestation in ∼63–70% of symptomatic individuals.4 Risk prediction in Brugada syndrome remains challenging, and current risk prediction models have significant limitations.5–7 Conventional risk prediction models typically include clinical and electrophysiological parameters such as the presence of a spontaneous Type 1 electrocardiogram (ECG) pattern, male sex, unexplained syncope, or inducible ventricular fibrillation (VF), but the predictive value of these models is modest at best.5,6,8
Because of these limitations, there has been a call for circulating biomarkers that may refine our approach to risk stratification in Brugada syndrome. Circulating micro-ribonucleotide acids [microRNAs (miRNAs)] represent a family of candidate biomarkers for non-invasive assessment of complex cardiac disorders.9–11 MicroRNAs are small, non-coding RNA strands of up to 20–25 nucleotides that bind messenger RNA (mRNA), resulting in either mRNA degradation or translational repression, and thus play an important role in post-transcriptional gene regulation.11 Over the past decade, an increasing number of miRNAs and their complex diagnostic and prognostic roles in various cardiovascular diseases, including myocardial fibrosis and remodelling, have been identified.11–14
The role of circulating miRNA in the diagnosis and prognostic stratification of patients with Brugada syndrome remains unknown. The aim of the present study was to demonstrate the feasibility of assessing miRNA expression profiles from peripheral blood in Brugada patients. We hypothesized that Brugada patients present a distinct miRNA signature compared with unaffected control individuals. We also hypothesized the presence of distinct miRNA expression signatures between symptomatic and asymptomatic Brugada patients.
Methods
Study population
The present study was a prospective case–control study that was conducted at a single tertiary university centre (Institut universitaire de cardiologie et pneumologie de Québec—Université Laval, IUCPQ-UL). The study population was recruited from our local Inherited Arrhythmia Clinic. Eligible study subjects were ≥18 years old and included symptomatic or asymptomatic individuals with Brugada syndrome. For the diagnosis of Brugada syndrome, the documentation of a spontaneous or inducible Type 1 Brugada pattern was required as per current guidelines.2,15 For the purpose of this study, we prioritized individuals with a Shanghai score ≥3.0.2 Symptomatic Brugada patients were defined as individuals with at least one of the following cardiac manifestations: history of resuscitated ventricular tachycardia (VT)/VF arrest, unexplained cardiac syncope, documented sustained polymorphic VT/VF, or appropriate implantable cardioverter defibrillator (ICD) therapy for polymorphic VT/VF. In accordance with current guidelines, all Brugada patients underwent genetic testing for SCN5A.16 The control group consisted of unrelated age- and sex-matched individuals without evidence of any inherited arrhythmia, genetic cardiomyopathy, and no history of ventricular arrhythmia or unexplained syncope. None of the control individuals had a family history of unexplained sudden cardiac arrest/death. All control individuals had a normal resting ECG. All study participants provided written informed consent. The study was approved by the institutional ethics and review board.
Clinical data
Clinical data of Brugada patients were collected from the electronic medical records, including standard demographic variables (age, sex, ethnicity, etc.), ECG data (resting ECGs with standard and high-precordial leads, signal-averaged ECGs), results of cardiac imaging (echocardiogram, cardiac magnetic resonance), ICD status, and follow-up as well as genetic test results.
Peripheral blood sample collection and RNA extraction
Blood samples were collected using PAXgene® Blood RNA tubes (BD Biosciences) as per manufacturer protocol and stored at −80°C until the day of RNA extraction. Total RNA was extracted from peripheral blood samples using a commercially available extraction kit (PAXgene Blood RNA Kit; QIAGEN). Photometric control of RNA quantity and purity was performed by measuring ultraviolet absorbance at different wavelengths to monitor contamination with proteins (Abs 260/280 nm ratio) or other organic compounds (Abs 260/230 nm ratio). A total of 100 ng total RNA per sample was used for miRNA expression studies.
Measurement of circulating microRNA expression levels
Assessment of the expression profiles of miRNAs in biofluids is technically challenging due to their low abundance, the small size of mature miRNAs, and the high degree of sequence similarity between different miRNA family members.17 Because of this and with the intention to apply a broad unbiased screening approach, we chose NanoString technology which provides a sensitive, reproducible, and highly multiplexed method for detecting multiple specific miRNAs within purified RNA isolated from body fluids. Expression levels of different miRNAs were assessed using the NanoString® nCounter Human v3 miRNA Panel which contains 798 unique miRNA barcodes (NanoString Technologies, Seattle, WA, USA). The NanoString technology is a novel high-throughput technology for the analysis and quantification of various types of nucleic acids including miRNAs. The nCounter platform does not require enzymatic amplification of nucleic acids.18 Hallmark of this technology is the target detection by colour-coded probe pairs that hybridize with the target miRNA (see Supplementary material online, Figure S1). The probe pair consists of a capture probe that is biotinylated at the 3′ end and a reporter probe with a colour-coded signal at the 5′ end. After set-up hybridization, excess probes are washed away using complementary magnetic bead–based purification. Each target-probe pair is individually resolved and counted on the instrument.
Using the nCounter platform, a total of 798 different miRNAs were analysed (see Supplementary material online, Table S1). The NanoString miRNA panel also contains five housekeeping genes (ACTB, B2M, GAPDH, RPL19, and RPL0), six positive control probes, eight negative control probes, five spike-in controls, and six ligation controls. All samples were analysed in triplicates.
Quantitative polymerase chain reaction cross-validation of microRNA expression
To demonstrate the robustness of the miRNA expression results obtained using the NanoString platform, we performed orthogonal cross-validation using real-time quantitative polymerase chain reaction (qPCR) for a subset of selected miRNAs. One of the top differentially expressed miRNAs between cases and controls and with the lowest P-value was selected for cross-validation (test miRNA): hsa-miR-106b-5p. Relative quantification was performed using the calibration curve method. Thus, three miRNAs were selected as sample calibrator (reference miRNA): hsa-miR-451a, hsa-miR-423-5p, and hsa-miR191-5p. The selection was based on NanoString® expression stability independently of case or control samples (P > 0.2). First, 185 ng of RNA from each sample was reverse transcribed to complementary DNA (cDNA) using miRCURY LNA RT Kit (QIAGEN), as per manufacturer protocol. Quantitative real-time polymerase chain reaction (PCR) was performed in triplicates, in 10 µL volume using miRCURY LNA SYBR Green PCR Kit (QIAGEN) and Bio-Rad CFX384 Real-Time PCR Detection System. Cycling conditions include 2 min at 95°C for initial heat activation, followed by 40 repetitions of a two-step annealing/elongation cycle (95°C 10 s, 56°C 60 s). The miRNA qPCR assay primers were ordered from GeneGlobe (see Supplementary material online, Table S2), QIAGEN. Copy numbers were calculated for each sample based on a nine-point calibration curve built from a cDNA pool prepared by mixing equal volumes of each sample. Finally, the copy number was normalized for each sample using the ratio of the copy number of the test miRNA divided by the copy number of the reference miRNA.
MicroRNA target prediction and enrichment analysis
Target prediction and miRNA target enrichment analysis was performed using the DIANA miR-TarBase v8 and the miRTarBase data bases in conjunction with the mirPath v3.0 and TargetScan prediction tools as previously described.19–24 MicroRNA network analysis was based on TargetScan prediction algorithms (threshold for cumulative weighted context++ score at 0.9) using the MIENTURNET tool.25 Network visualization was realized using Cytoscape 3.9.0 software. Functional enrichment and gene ontology analysis was performed using the Kyoto Encyclopedia of Genes and Genomes (KEGG) and the Gene Ontology tool.
Statistical analysis
Categorical variables are expressed as absolute numbers and percentages and were analysed using χ2 test and Fisher’s exact test. Continuous data are expressed as mean ± standard deviation (SD), or as median and interquartile range (p25 p75) and were analysed using Student’s t-test or Mann–Whitney U test where appropriate.
MicroRNAs absent from >90% of samples were filtered out for subsequent analyses. Average log counts of samples and controls were normalized using the NanoString normalization method implemented in the NanoStringNorm R package.26,27 Differential expression analysis was performed using the empirical Bayes method from the limma R package.28,29 Multiple-testing correction was performed using the Benjamini–Hochberg method. Receiver operating characteristic (ROC) curves were used to evaluate the performance of the miRNA to delineate symptomatic and asymptomatic Brugada patients. Models with and without conventional clinical data (age, sex, spontaneous Type 1 ECG pattern, and SCN5A mutation status) were compared using likelihood ratio test. Statistical significance was considered for P values <0.05 and all P values are two-sided. All statistical analyses were conducted using R software or STATA 14.1 software (StataCorp LP, College Station, TX, USA). R packages used for data analyses include NanoStringNorm (version 1.2.1) for normalizing miRNA nCounter data, limma (version 3.54.1) for differential expression analysis, gplots (version 3.1.3) for generating the heat map, and pROC (version 1.18.0) for ROC curves.
Results
A total of 21 definite Brugada patients (76% males) and 30 unrelated age- and sex-matched control individuals were included in the study. All study participants were French-Canadians of Caucasian European descent. Baseline characteristics of the Brugada cohort are displayed in Table 1. All patients with Brugada syndrome were unrelated with a mean Shanghai score of 3.3 and 8/21 (38%) were symptomatic. There were 12/21 Brugada patients with a persistent spontaneous Type 1 ECG pattern on serial ECG recordings. None of the Brugada patients displayed signs of an early repolarization and none of them showed a spontaneous or inducible Type 1 pattern in peripheral ECG leads. Of note, none of the patients underwent electrophysiology testing/programmed ventricular stimulation.
Baseline characteristics of Brugada patients
| Brugada cohort | N = 21 |
|---|---|
| Males, n (%) | 16 (76) |
| Shanghai score | 3.3 ± 0.7 |
| Age at enrolment, years | 49 ± 16 |
| SCN5A mutation, n (%) | 3 (14) |
| Type 1 Brugada pattern, n (%) | |
| Spontaneous | 12 (57) |
| Fever-induced | 6 (29) |
| Procainamide-induced | 3 (14) |
| Asymptomatic, n (%) | 13 (62) |
| Symptomatic, n (%) | 8 (38) |
| VF arrest | 5 (24) |
| Unexplained cardiac syncope | 3 (14) |
| Additional ECG features | |
| Type 1 pattern in peripheral leads, n (%) | 0 |
| Early repolarization pattern, n (%) | 0 |
| ICD, n (%) | 10 (48) |
| Family history of Brugada syndrome, n (%) | 5 (24) |
| Family history of unexplained sudden cardiac death, n (%) | 4 (19) |
ECG, electrocardiogram; ICD, implantable cardioverter defibrillator; VF, ventricular fibrillation.
MicroRNA expression profiles in Brugada patients and controls
MicroRNA profiling was performed in all Brugada patients and control individuals. All samples passed the quality control metrics and were entered into the final analysis. The relative log expression plot of unnormalized nCounter data for all cases and controls is displayed in Supplementary material online, Figure S2. In the absence of strong evidence for a specific candidate miRNA, a total of 798 different miRNAs were analysed (a complete list of all analysed miRNAs can be found in Supplementary material online, Table S1). Figure 1 shows the flow chart of miRNA analysis. As expected, a significant proportion of potential miRNAs remained undetectable in peripheral blood samples. After data normalization (see Supplementary material online, Figure S3), 656 (82.2%) miRNAs were undetectable in Brugada patients and controls. Overall, 142 (17.8%) miRNAs passed our filters of detectable expression (see Supplementary material online, Table S3).
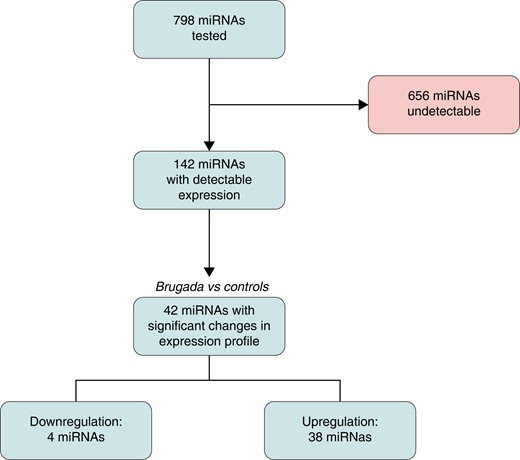
Study flow chart. miRNA, microRNA.
The spectrum of detectable miRNAs showed a distinct expression profile in Brugada patients with 42 differentially expressed miRNAs (38 up-regulated, 4 down-regulated; Figure 2).
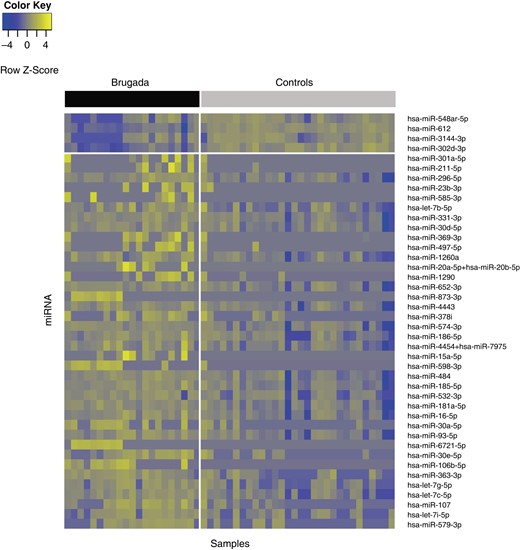
Heat map presenting expression levels of the 42 miRNAs differentially expressed between Brugada cases and controls. The samples (n = 51) and miRNA (n = 42) are illustrated in columns and rows, respectively. Yellow indicates a high level of expression; blue indicates a low level of expression. The upper bar delineates cases (black) and controls (grey). The horizontal white line separates miRNA that are down-regulated (n = 4) and up-regulated (n = 38) in Brugada patients. miRNA, microRNA.
Table 2 shows the differentially expressed miRNAs between Brugada patients and controls. Figure 3 shows the boxplots for the top eight up-regulated and the four down-regulated miRNAs.
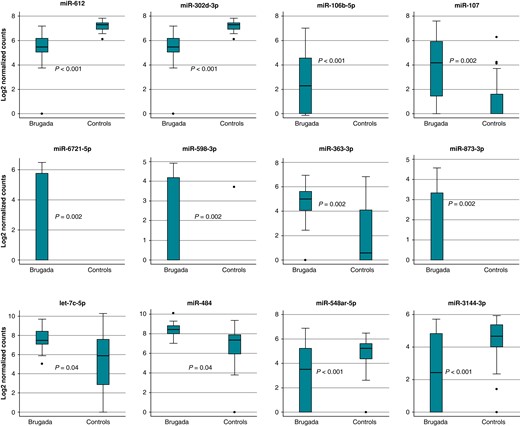
Differential miRNA expression in Brugada patients and healthy controls. Shown are the normalized relative expression levels of the eight up-regulated and four down-regulated miRNAs. miRNA, microRNA.
MicroRNA RNAs with differential expression between Brugada patients and controls
| MiRNA | LogFC | AveExpr | T | P-value | Adj. P-value |
|---|---|---|---|---|---|
| hsa-miR-612 | −1.9 | 6.4 | −5.8 | <0.0001 | <0.0001 |
| hsa-miR-302d-3p | −1.2 | 7.2 | −5.0 | <0.0001 | 0.0002 |
| hsa-miR-106b-5p | 2.4 | 1.0 | 5.1 | <0.0001 | 0.0002 |
| hsa-miR-107 | 2.8 | 2.2 | 4.3 | 0.0001 | 0.0017 |
| hsa-miR-6721-5p | 2.3 | 0.9 | 4.3 | 0.0001 | 0.0017 |
| hsa-miR-598-3p | 1.7 | 0.8 | 4.2 | 0.0001 | 0.0021 |
| hsa-miR-363-3p | 2.6 | 3.2 | 4.1 | 0.0001 | 0.0022 |
| hsa-miR-873-3p | 1.4 | 0.6 | 4.1 | 0.0001 | 0.0022 |
| hsa-let-7c-5p | 2.7 | 6.1 | 3.9 | 0.0003 | 0.0040 |
| hsa-miR-30e-5p | 2.4 | 2.0 | 3.9 | 0.0003 | 0.0040 |
| hsa-miR-484 | 1.7 | 7.4 | 3.6 | 0.0006 | 0.0067 |
| hsa-miR-548ar-5p | −2.1 | 4.0 | −3.6 | 0.0006 | 0.0067 |
| hsa-miR-15a-5p | 1.7 | 0.7 | 3.6 | 0.0006 | 0.0067 |
| hsa-miR-1260a | 1.2 | 7.9 | 3.5 | 0.0008 | 0.0073 |
| hsa-let-7g-5p | 2.6 | 4.2 | 3.5 | 0.0008 | 0.0073 |
| hsa-miR-93-5p | 2.1 | 6.7 | 3.5 | 0.0008 | 0.0074 |
| hsa-miR-185-5p | 1.8 | 8.0 | 3.5 | 0.0010 | 0.0082 |
| hsa-miR-369-3p | 1.1 | 0.6 | 3.4 | 0.0011 | 0.0088 |
| hsa-miR-30a-5p | 2.1 | 1.5 | 3.4 | 0.0013 | 0.0096 |
| hsa-miR-579-3p | 4.3 | 4.9 | 3.4 | 0.0014 | 0.0097 |
| hsa-miR-16-5p | 2.0 | 7.8 | 3.3 | 0.0015 | 0.0100 |
| hsa-miR-4454 + hsa-miR-7975 | 1.7 | 13.2 | 3.3 | 0.0018 | 0.0109 |
| hsa-miR-20a-5p + hsa-miR-20b-5p | 1.3 | 0.6 | 3.3 | 0.0018 | 0.0109 |
| hsa-miR-585-3p | 1.0 | 0.4 | 3.2 | 0.0020 | 0.0118 |
| hsa-miR-181a-5p | 1.9 | 7.4 | 3.2 | 0.0023 | 0.0129 |
| hsa-let-7b-5p | 1.0 | 11.5 | 3.2 | 0.0025 | 0.0136 |
| hsa-miR-296-5p | 0.9 | 9.2 | 3.1 | 0.0031 | 0.0156 |
| hsa-miR-574-3p | 1.6 | 6.5 | 3.1 | 0.0032 | 0.0156 |
| hsa-let-7i-5p | 2.9 | 5.4 | 3.0 | 0.0036 | 0.0156 |
| hsa-miR-532-3p | 1.8 | 4.9 | 3.0 | 0.0035 | 0.0156 |
| hsa-miR-3144-3p | −1.8 | 3.6 | −3.0 | 0.0035 | 0.0156 |
| hsa-miR-1290 | 1.4 | 0.8 | 3.0 | 0.0036 | 0.0156 |
| hsa-miR-497-5p | 1.2 | 0.7 | 3.0 | 0.0035 | 0.0156 |
| hsa-miR-378i | 1.5 | 1.3 | 3.0 | 0.0040 | 0.0166 |
| hsa-miR-652-3p | 1.4 | 7.9 | 2.9 | 0.0053 | 0.0207 |
| hsa-miR-186-5p | 1.7 | 5.1 | 2.9 | 0.0051 | 0.0207 |
| hsa-miR-4443 | 1.5 | 6.5 | 2.9 | 0.0058 | 0.0224 |
| hsa-miR-331-3p | 1.0 | 8.0 | 2.7 | 0.0097 | 0.0358 |
| hsa-miR-211-5p | 0.8 | 0.4 | 2.7 | 0.0098 | 0.0358 |
| hsa-miR-30d-5p | 1.1 | 8.2 | 2.5 | 0.0138 | 0.0481 |
| hsa-miR-301a-5p | 0.7 | 0.4 | 2.5 | 0.0139 | 0.0481 |
| hsa-miR-23b-3p | 1.0 | 0.6 | 2.5 | 0.0144 | 0.0487 |
miRNA, microRNA.
To demonstrate the robustness of the observed miRNA profile in Brugada patients, we performed orthogonal validation using qPCR for a subset of differentially expressed miRNAs. Supplementary material online, Figure S4 shows a representative example of cross-validation by qPCR. Overall, qPCR showed the same differences in miRNA expression profiles between Brugada patients and asymptomatic control individuals.
Given the fact that Brugada syndrome is characterized by loss-of-function properties of the voltage-gated cardiac sodium channel, we searched for interactions of the 42 differentially expressed miRNAs with the SCN5A gene using TargetScan 8.0. The miRNAs 302d-3p and let-7b-5p are part of conserved miRNA families among vertebrates and are predicted to result in strong repression based on their corresponding cumulative weighted context++ and aggregate PTC scores (see Supplementary material online, Table S4).
Enrichment and pathway analysis
Enrichment analysis of the 42 differently expressed miRNAs was performed using KEGG and the Gene Ontology tool (Figure 4, Tables 3 and 4). Pathway enrichment analysis and ontology terms were selected based on statistical relevance after multiple testing and biological relevance. Tables 3 and 4 show the top 10 enriched pathways and gene ontology categories, respectively, in patients with Brugada syndrome. An example of the network analysis and selected miRNA interaction with genes in the enriched pathways is shown in Supplementary material online, Figure S5. Interestingly, there was a strong interaction of the identified miRNAs with the transforming growth factor beta (TGF-β) signalling and the Hippo-signalling pathways (Figure 4). Target genes of the canonical TGF-β signalling include TGFB1, TGFB2, TGFBR2, SMAD2, SMAD3, and SMAD4. Target genes of the Hippo-signalling pathway include VGLL4 and IGF1R (Figure 4).
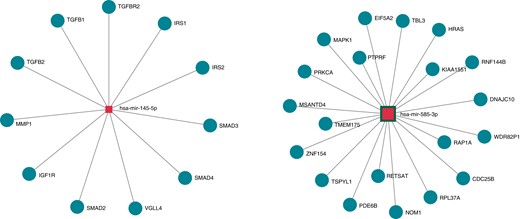
Target genes of miRNAs 145-5p and 585-3p. MiRNA-target pairs are illustrated by solid lines and derived from the DIANA-TarBase v8 database, which is a reference database of experimentally supported miRNA targets. MiRNAs and target genes are depicted in blue squares and pink circles, respectively. miRNA, microRNA.
Enriched pathways in differentially expressed microRNAs
| KEGG pathway | P-value | #genes | #miRNAs |
|---|---|---|---|
| Proteoglycans in cancer | 4.39E−11 | 139 | 35 |
| Pathways in cancer | 5.72E−08 | 257 | 37 |
| Hippo signalling pathway | 8.16E−08 | 106 | 38 |
| TGF-β signalling pathway | 1.63E−07 | 59 | 34 |
| Signalling pathways regulating pluripotency of stem cells | 1.64E−07 | 99 | 38 |
| Fatty acid biosynthesis | 9.66E−07 | 8 | 18 |
| Morphine addiction | 7.58E−06 | 62 | 35 |
| Renal cell carcinoma | 8.22E−06 | 51 | 33 |
| Pancreatic cancer | 1.24E−05 | 52 | 32 |
| GABAergic synapse | 1.59E−05 | 58 | 35 |
MiRNA, microRNA; TGF-β, transforming growth factor beta.
Enriched gene ontology categories for differentially expressed miRNAs
| GO category | P-value | #genes | #miRNAs |
|---|---|---|---|
| Molecular function | 1.94E−13 | 1355 | 4 |
| Ion binding | 9.49E−40 | 578 | 4 |
| Nucleic acid–binding transcription factor activity | 1.10E−18 | 130 | 4 |
| Enzyme binding | 5.87E−09 | 129 | 4 |
| Cellular component | |||
| Organelle | 1.39E−51 | 869 | 4 |
| Biological process | |||
| Cellular nitrogen compound metabolic process | 4.52E−31 | 445 | 4 |
| Biosynthetic process | 1.05E−22 | 377 | 4 |
| Cellular protein modification process | 1.41E−19 | 240 | 4 |
| Small molecule metabolic process | 0.002 | 171 | 4 |
| Catabolic process | 9.12E−07 | 166 | 4 |
miRNA, microRNA.
Symptomatic vs. asymptomatic Brugada patients
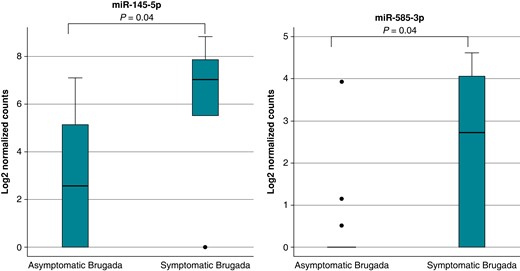
To test the hypothesis of a potential prognostic value of miRNAs, logistic regression of the 142 detectable miRNAs in all Brugada patients was performed to identify markers that may distinguish symptomatic from asymptomatic patients. Results of the top 10 expressed miRNAs are shown in Table 5, but only two were statistically significant including miR-145-5p (P = 0.04) and miR-585-3p (P = 0.04; Figure 5). Odds ratio for being symptomatic per 1 SD increase in expression levels of miR-145-5p and miR-585-3p was 4.3 [95% confidence interval (CI): 1.1–16.8] and 3.2 (95% CI: 1.1–9.4), respectively.
Distinct miRNA signature in symptomatic Brugada patients. Shown are the normalized relative expression levels of miR-145-5p and miR-585-3p that are up-regulated in symptomatic Brugada patients. miRNA, microRNA.
Differentially expressed miRNAs between symptomatic and asymptomatic Brugada patients
| miRNA | P-value |
|---|---|
| miR-145-5p | 0.038308 |
| miR-585-3p | 0.038965 |
| miR-644a | 0.104924 |
| miR-183-5p | 0.106847 |
| miR-23b-3p | 0.110181 |
| miR-30e-5p | 0.113527 |
| miR-485-3p | 0.118948 |
| miR-4454 + miR-7975 | 0.123078 |
| miR-1180-3p | 0.12364 |
| miR-6511a-3p | 0.160813 |
| miRNA | P-value |
|---|---|
| miR-145-5p | 0.038308 |
| miR-585-3p | 0.038965 |
| miR-644a | 0.104924 |
| miR-183-5p | 0.106847 |
| miR-23b-3p | 0.110181 |
| miR-30e-5p | 0.113527 |
| miR-485-3p | 0.118948 |
| miR-4454 + miR-7975 | 0.123078 |
| miR-1180-3p | 0.12364 |
| miR-6511a-3p | 0.160813 |
The differentially expressed miRNAs between symptomatic and asymptomatic Brugada patients are displayed in bold letters. miRNA, microRNA.
Association of microRNAs with symptom status in Brugada syndrome
To assess the predictive value of these two markers for cardiac events, ROC curve analysis for miR-145-5p and miR-585-3p was performed. Figure 6A shows the unadjusted ROC analysis for the isolated and combined analyses of both miRNAs. The unadjusted area under the curve (AUC) showed reasonable predictive values for the isolated analysis of miR-145-5p (AUC = 82.1, 95% CI: 58.9–100%) and miR-585-3p (AUC = 71.9%, 95% CI: 47.9–95.9%) and a good predictive value for the combined analysis (AUC = 91.8, 95% CI: 80.2–100%). The results of miR-145-5p and miR-585-3p were subsequently incorporated into a multivariable prediction model adjusted for age, sex, spontaneous Type 1 ECG pattern, and SCN5A mutation status. The novel prediction model including miR-145-5p and miR-585-3p had an excellent predictive value for Brugada-related cardiac events (AUC = 95.9, 95% CI: 88.4–100%) and was significantly improved compared with conventional risk prediction models (Figure 6B; P = 0.001).

Predictive value of miRNAs to discriminate between symptomatic and asymptomatic Brugada patients. Receiver operating characteristic curves with corresponding AUCs showing the value of miRNA in predicting Brugada patients with and without symptoms. (A) MiRNA miR-145-5p and miR-585-3p alone and in combination. (B) The combination of miR-145-5p and miR-585-3p compared with conventional clinical indicators. AUC, area under the curve; miRNA, microRNA.
Discussion
The present study demonstrates the existence of a specific miRNA signature in patients with Brugada syndrome and its diagnostic and prognostic utility to distinguish symptomatic from asymptomatic individuals. Key findings of this study include the following: (i) systematic profiling of circulating miRNAs reveals a distinct miRNA signature in Brugada patients compared with healthy control individuals and also permits to discriminate between symptomatic and asymptomatic Brugada patients; (ii) the miRNA expression profile in Brugada patients is unrelated to the presence of an underlying SCN5A mutation; and (iii) the presence of a molecular miRNA signature is associated with adverse cardiac events.
Over the past decade, there has been an increasing interest in miRNAs as potential non-invasive biomarkers for various cardiovascular diseases.30 Various studies have shown the implication of miRNAs in myocardial hypertrophy, fibrosis, heart failure, and sudden cardiac death.11,30,31 There are now over 2000 known different human miRNAs but not all of them can be assessed in peripheral blood samples.32 In the absence of existing data, preselection of candidate miRNA molecules for a given biomarker study represents a major challenge and may substantially influence the observations. To avoid any potential selection bias, we analysed a broad panel of 798 miRNAs using the NanoString nCounter gene expression platform. This panel represented all commercially available miRNA sequences at the time of the study. Using this large screening approach, we identified a distinct miRNA expression signature in Brugada patients including 38 up-regulated and 4 down-regulated miRNAs compared with unaffected matched control individuals. To ensure a high degree of diagnostic accuracy, a very careful and rigorous process of data quality assessment, expression normalization, and multiple testing was realized as previously recommended.27
Our study represents one of the largest screening approaches for circulating miRNAs in Brugada syndrome to be reported. Instead of focusing on biological candidate miRNAs, we have used a hypothesis-free approach, where nearly 800 highly curated human miRNAs were tested which represents an unbiased and inclusive approach. Our methods used to normalize miRNA expression were very conservative to avoid overdiagnosing of false-positive discovery rates. Moreover, our study is the first to perform orthogonal validation of the observed miRNA signals by a second technology obtaining the same results. The cross-validation by qPCR represents a particular strength of our study and increases the confidence in our results. Our study is also the first to identify a molecular signature distinguishing symptomatic from asymptomatic Brugada patients. At present, only two studies reported miRNA analysis in Brugada syndrome. Scumaci et al.33 studied 179 miRNAs in 13 Brugada patients and 10 control individuals but did not find a molecular signature that was associated with adverse cardiac events. The sample size and number of screened miRNA molecules in their study may account for these differences. A second study by Ikeuchi et al.34 performed miRNA analysis in plasma samples and screened 2555 miRNAs using microarrays in a cohort of Japanese Brugada patients and unaffected controls. They also found a distinct miRNA signature in Brugada patients but reported different target miRNAs. No comparison between symptomatic and asymptomatic individuals was performed.34 Thus, so far, our study is the only one suggesting a distinct miRNA expression profile in Brugada patients with ventricular arrhythmia. The distinct miRNA signature compared with our study could be explained by differences in the source of the miRNAs, the study population and the biostatistical methods used. Ethnic differences with regard to phenotype expression and mutational SCN5A status in Brugada patients are well known.35 Although the cohort of Ikeuchi et al. was significantly larger compared with our study, less details were reported about the phenotype of their study cohort and the event rate. There were also significant differences with regard to data normalization of miRNA expression.27
Our observation that miR-145-5p and miR-585-3p are associated with adverse cardiac events is of potential clinical importance given the ongoing challenge of risk stratification in asymptomatic individuals with Brugada syndrome. Conventional risk prediction models are typically based on clinical parameters, ECG features, and SCN5A status ± results of programmed ventricular stimulation but have only modest positive predictive values.6,8 Our results support the hypothesis that future multivariate risk prediction models may benefit from the integration of distinctive biomarkers. The small sample size of our study with a limited number of symptomatic Brugada patients in conjunction with the absence of early repolarization pattern and the absence of systematic programmed ventricular stimulation in asymptomatic individuals did not allow us to compare our prediction model to other contemporary models like the Sierra score or the BRUGADA-RISK score.8,36
Although the molecular mechanisms and precise role of the distinct miRNA expression profile in the arrhythmogenesis of Brugada syndrome remain elusive at this point, our identification of target genes and enriched pathways shows several interesting associations that are at least hypothesis generating. Our observation that miRNAs of the miR-302-3p and let-7-5p family are overexpressed in patients with Brugada syndrome is consistent with recent studies highlighting the role of miRNAs on the electrophysiological properties of the cardiac voltage gated sodium channel Nav1.5 (SCN5A).37,38 The loss of function of Nav1.5 is the electrophysiological hallmark of Brugada syndrome and results in the typical ECG phenotype.1SCN5A itself is regulated by a number of different miRNAs which typically target the 3′-untranslated region.37,38 Based on their cumulative weighted context++ score and PTC score, miRNAs of the miR-302-3p and let-7-5p family are expected to induce strong repression.
Enrichment analysis showed that myocardial targets of miR-145-5p and miR-585-3p include the hippo and TGF-β signalling pathways. Although the role of both pathways in the pathophysiology and arrhythmogenesis of Brugada syndrome remains to be elucidated, there is collateral evidence suggesting that both pathways may play an important role in the development of cardiac symptoms. Pathological activation of the hippo pathway has been previously demonstrated for arrhythmogenic cardiomyopathy (which shows some overlap features with Brugada syndrome) resulting in enhanced myocardial adipogenesis and potentially also contributing to myocardial fibrosis.39 The TGF-β pathway, on the other hand, is clearly implicated in myocardial fibrosis, inflammation, and arrhythmogenesis.40,41 A central role for the TGF-β pathway seems appealing and would also support the concept of Brugada syndrome as a microstructural cardiomyopathy. This concept has been proposed following the discovery of subepicardial microfibrosis along the right ventricular outflow tract.42 It is now undisputed that these focal areas of subepicardial microfibrosis represent the electroanatomical substrate for the characteristic Type 1 ECG pattern and the proarrhythmic substrate for VF.42 Recent studies have shown that mapping and ablation of the epicardial Brugada substrate result in the long-lasting elimination of the Brugada ECG phenotype and a significant reduction of recurrent ventricular arrhythmia.42–46
Obviously, further studies will be required to elucidate the molecular interaction between the identified miRNA signature, target pathways, and arrhythmogenesis in patients with Brugada syndrome. Our observations are encouraging, and we believe that circulating miRNAs may have the potential for clinical use as diagnostic and prognostic biomarkers.
Limitations
Our study has limitations. The present study was a single-centre study with a small sample size and a limited number of arrhythmic events, limiting the robustness of the association between miRNA expression profiles and cardiac events. The results of this study will require confirmation by large-scale multicentre studies with longer follow-ups. The finding of a distinct miRNA signature in leucocytes from peripheral blood samples does not allow us to draw conclusions about the local myocardial miRNA expression profile, which may or may not be different in Brugada patients. In addition, our approach did not allow us to assess circulating exosomal or protein-bound miRNAs in the plasma. Future projects might include a complementary miRNA analysis of myocardial biopsy samples and correlate tissue-specific miRNA expression with ion-channel transcriptome analysis.47
The choice to study leucocyte-derived miRNAs profiles was largely by recent evidence, suggesting an inflammatory—potentially autoimmune—component underlying the pathophysiology of Brugada syndrome.48,49 Longitudinal follow-up with periodic reassessment of miRNA profiling may help us to understand the evolution of expression patterns over time and to correlate these markers with clinical outcomes. Also, the NanoString technology used in this study does not allow us to identify novel yet unknown miRNAs compared with a conventional miRNA-seq technology. Therefore, we cannot completely exclude the fact that other yet unknown miRNAs may play a role in the pathophysiology of Brugada syndrome.
Molecular details of the interaction of identified miRNAs with target genes and signalling pathways are unknown at this point and will require a series of functional experiments to clarify their role in Brugada syndrome. Finally, there are other classes of regulatory but yet unexplored RNA molecules like circular RNAs or long non-coding RNAs that may be implicated in the pathophysiology of Brugada. The performance of miR-145-5p and miR-585-3p to delineate symptomatic and asymptomatic Brugada patients will need to be validated in an independent larger cohort.
Conclusions
Brugada patients display a distinct miRNA expression profile compared with unaffected control individuals. There is also evidence that certain miRNAs (miR-145-5p and miR-585-3p) are associated with the symptom status of Brugada patients. Our results suggest the possibility of leucocyte-derived miRNAs as candidate biomarkers for Brugada syndrome, but further, large-scale validation studies will be required to determine the robustness of our findings and their clinical utility.
Supplementary material
Supplementary material is available at Europace online.
Acknowledgements
The authors are deeply grateful to the patients for their participation in this study.
Funding
This study was funded by a grant from the Foundation of the IUCPQ-UL that was awarded to C.S. Y.B. holds a Canada Research Chair in Genomics of Heart and Lung Diseases. C.S. is supported by the Fonds de Recherche du Québec-Santé.
Data availability
Data will be available upon reasonable request and IRB approval.
References
Author notes
Conflict of interest: None declared.
