


Abstract
While sudden cardiac death (SCD) in hypertrophic cardiomyopathy (HCM) is due to arrhythmias, the guidelines for prediction of SCD are based solely on non-electrophysiological methods. This study aims to stimulate thinking about whether the interests of patients with HCM are better served by using current, ‘risk factor’, methods of prediction or by further development of electrophysiological methods to determine arrhythmic risk. Five published predictive studies of SCD in HCM, which contain sufficient data to permit analysis, were analysed to compute receiver operating characteristics together with their confidence bounds to compare their formal prediction either by bootstrapping or Monte Carlo analysis. Four are based on clinical risk factors, one with additional MRI analysis, and were regarded as exemplars of the risk factor approach. The other used an electrophysiological method and directly compared this method to risk factors in the same patients. Prediction methods that use conventional clinical risk factors and MRI have low predictive capacities that will only detect 50–60% of patients at risk with a 15–30% false positive rate [area under the curve (AUC) = ∼0.7], while the electrophysiological method detects 90% of events with a 20% false positive rate (AUC = ∼0.89). Given improved understanding of complex arrhythmogenesis, arrhythmic SCD is likely to be more accurately predictable using electrophysiologically based approaches as opposed to current guidelines and should drive further development of electrophysiologically based methods.
Introduction
The majority of sudden cardiac deaths (SCD) in hypertrophic cardiomyopathy (HCM) are due to malignant arrhythmias1 and so are an electrophysiological problem, but the European Society of Cardiology guidelines recommends prediction of an arrhythmia, and implantable cardioverter defibrillator (ICD) implantation, through non-electrophysiological means, a combination of clinical ‘risk factors’2 (RFs) based on a regression model.3
If RFs are used to predict SCD in HCM, there presumably must be a close relationship between the mechanism of arrhythmogenesis and the RFs in question. The components of the electrophysiological substrate for ventricular arrhythmias, including ventricular fibrillation (VF), have been known for many years. They are temporary conduction block with slowed conduction that gives tissue ahead of the re-entrant wavefront sufficient time to repolarize. It is also known that the substrate arises dynamically.4 In contrast, the relationship between clinical RFs and the causal chain of events underlying SCD is unclear, but were there a strong causal chain, RFs should have similar predictive capacity to electrophysiological approaches in assessing patients’ risk of SCD.
The purpose of this paper is to scrutinize models for the prediction of SCD, their clinical consequences, and to explain intelligibly the statistical reasoning and how they translate to informing clinical decisions. We conclude that these methods, which are based on regression between clinical RFs and risk, have predictive capacities that are at the lower limit of acceptability and that new approaches through electrophysiology may be more promising and warrant further development. The RF studies analysed have enough primary data to allow statistical analysis and are regarded as exemplars of the RF approach. One is the first multiple RF study for prediction of SCD,5 another in which a multiple regression model3 was further tested and validated6 and a model combining late gadolinium enhancement (LGE) on MRI combined with RFs.7 A further study using multiple RFs in paediatric patients with a similar methodology to O’Mahony et al. and O’Mahony et al.3,6 is analysed.8
These RF studies are compared to an electrophysiological method, ‘paced electrogram fractionation analysis (PEFA)’, described in multiple prior studies9,10,11,12 and was designed to expose explicitly the electrophysiological (EP) effects of disarray that could form one component of the re-entrant EP substrate: delayed intramyocardial conduction as a result of slowed or tortuous conduction and/or temporary block, which allows repolarization of refractory tissue before being re-excited by the advancing re-entrant wavefront. Although disarray had been speculatively associated with a re-entrant substrate,13–16 the challenge was to demonstrate its effects. The method involves detection of small, fractionated potentials at the end of the paced electrogram that appear and are delayed as the coupling interval of the extrastimuli is reduced (see Saumarez et al.9 and Figure 3). This fractionation is not seen during sinus rhythm and shows the capacity for dynamic delayed conduction as the myocardium is perturbed. The PEFA technique quantifies these effects by using two parameters, the increase in electrogram duration and the S1S2 coupling interval at which delay increases, and so is a physiological, rather than a regression, model. This was developed using 143 patients and resulted in a discriminant criterion with 18 VF patients (8 prospective) and 13 non-VF patients being test positive and 2 VF patients and 110 non-VF patients being test negative. (Subsequent data showed that prospective and retrospective PEFA values in VF patients were from the same distribution.) This criterion was tested prospectively in a study of 179 patients designed to determine if PEFA had superior predictive capacity to RFs by measuring both in the same patients,17 and 2 further patients who had events following publication are included in the analysis below. These studies were designed to use the minimum number of patients (since they are invasive) to achieve statistically significant results. However, they form a large electrophysiological series, and they suggest that electrophysiological methods with further development may give substantially better risk prediction. The purpose of this paper is to stimulate research into, and to provoke discussion over, the merits of risk factor and EP-based risk prediction.
Prediction
‘Prediction is very difficult, especially if it’s about the future’ (Niels Bohr). Prediction of SCD risk and ICD implantation revolve around the statistical models that have been used to determine the relationship between the risk and the variables measured to infer that risk. Thus, ICD prescription is related to the performance of the statistical models, and so the methods used in this paper are explained so as to be intelligible to the general reader.
A useful tool for analysing this problem is the ‘receiver operating characteristic’ (ROC) curve, which is a method of quantifying the overlap of two sets of data. A predictor, which varies from, say, zero to 100, is calculated for a population. For each value of the predictor, the number of events and non-events below that value is determined, which allows the sensitivity (true positive rate) to be calculated as well as the false positive rate (1-specificity). This yields a curve that shows what fraction of patients will be truly and falsely identified for any value of the predictor. Examples of these curves are shown in Figure 1. The critical measurement from the point of SCD is the number of false positives for a given true positive rate. If one is trying to detect 90% of events, then the false positive rate can be determined from the intersection of the ROC (Figure 1) with 90% sensitivity projected on the abscissa. There is a difficulty with ROCs when the data are categorical rather than continuous. While on a continuous curve, one can determine the false positive rate for any sensitivity, when using an ROC based on categories, one can only determine the sensitivity and false positive for each category, and it is meaningless to ask, if one is using the number of clinical RFs as categories, ‘what is the sensitivity of one and a half RFs’? Thus, the ROCS for categorical data are plotted as discrete points rather than a continuous curve.
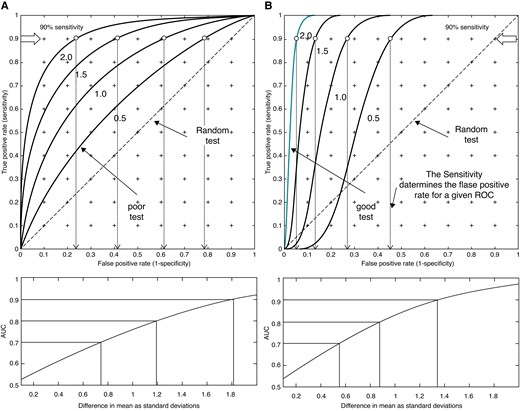
ROCS from two normal distributions whose means are separated by 0.5, 1.0, 1.5, and 2.0 SDs of the lowest valued distribution. (A) The SDs are the same and (B) the SD of the higher valued distribution is reduced to 0.3, thus decreasing the overlap of the distributions and improving the predictive value. The “poor test” curve marked in (A) is an example of poor predictive capacity (AUC = 0.63), while the “good test” in (B) is an example of high predictive capacity (AUC = 0.97). The points of 90% sensitivity are marked on the curves, and their corresponding false positive rates are shown by the arrows projected on the abscissa. The lower curves show how the AUC varies with the difference in means.
The performance of prediction is measured by the AUC. ‘In general, an AUC of 0.5 suggests no discrimination (i.e. ability to diagnose patients with and without the disease or condition based on the test), 0.7 to 0.8 is considered acceptable, 0.8 to 0.9 is considered excellent, and more than 0.9 is considered outstanding’.18 While it is accepted that an AUC of 0.9 represents an ‘outstanding’ test, this lacks intuitive meaning. As an example, UK adult height data19 were used to calculate the ROC for distinguishing men from women on the basis of height. The AUC is 0.90 and so (astonishingly) the majority of medical tests are substantially less accurate than distinguishing men from women on the basis of their height! However, this is age dependent and comparing the heights of 16-year-old girls with those of 14-year-old boys, the AUC is 0.5, 0.7 for 15-year-old boys, and 0.83 for 16-year-old boys, and these comparisons should be borne in mind when considering the studies described below. For normal distributions with equal variances, an AUC = 0.7 implies a difference in the means of ∼0.75 σ, and an AUC = 0.9 corresponds to a difference in means of 1.8 σ. If the variance of the SCD group is less than the non-SCD group, the AUC will be increased for a given difference between the means of groups as shown in Figure 1, and this effect is important in enhancing predictive accuracy.
Given that an ROC has been calculated from a single set of data, how can its errors be estimated? There are two approaches, which are widely used in statistics, diagnostics, and artificial intelligence: the first is the ‘bootstrap’,20 which is a method of making a generalization about the population from which a single group is drawn and involves generating a new data set by random sampling of the data. The second is to generate a sample of the population based on random sampling of its underlying statistics and then apply the risk model to the sample (‘Monte Carlo’ method). By repeating these methods many times, the limits of the ROC can be established.
A problem with using data taken from publications is that it is rarely complete. One major issue is that each patient has been followed for different lengths of time, ‘censored’, and this requires correction. The EP and RF data in Saumarez et al.17 are not censored, each patient was followed for 5 years, and the ROC can be constructed directly. In censored data (where the length of follow-up of each patient is not specified), an indirect approach is used. The mortality of each group in a study at 5 years is quoted,5,6,7,9 having been calculated through Kaplan–Meier (KM) statistics, which is specifically designed to calculate mortality rates while compensating for censoring. Given the number of patients in each group and their mortality, the ROC can be calculated and its limits determined by Monte Carlo simulation (Figure 2). Receiver operating characteristics generated from raw, censored data and those calculated from KM result in difference in an AUC of ∼0.03. The AUC for censored data can be calculated and is the concordance or ‘C-index’21 and is quoted in the studies discussed below.
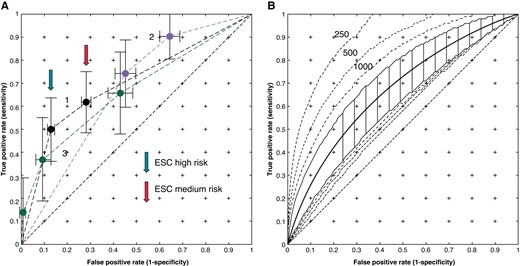
Mean convex hull ROCs for non-electrophysiological risk prediction together with the 2.5% and 97.5% confidence limit. (A) Curve 1 —O'Mahony ‘Model A', Curve 2 Monte Carlo analysis using estimated 5-year survival for Elliott et al.,5 and Curve 3 from Norrish.8 (B) O'Mahony (2017) ‘Model B’ with ±2.5% limits for 2147 patients. The dashed lines show the limits when calculated for 250, 500, and 1000 patients.
Methods
Each ROC was calculated with convex hull correction and the confidence limits determined via a bootstrap or from Monte Carlo simulation with 10 000 simulations. For categorical ROCs, the results of simulation were checked analytically. The t-bootstrap was used to determine significance levels of the bootstrapped AUC. The ROC for Elliott et al.5 was taken from RF frequencies and SCDs in each group in the text, and the Monte Carlo analysis was performed using the estimated 5-year mortalities of each group. The survival curves in O’Mahony et al.6 were used to calculate the survival rates of each group (high, medium, and low) and their proportions of the population (Table 46). The ROC was calculated at 5 years (i.e. non-censored) by simulation of 2147 patients with these proportions (‘Model A’). The regression equation in O’Mahony et al. and O’Mahony et al.3,6 was used to compute the ROC in Figure 2B, and the data given in Table 2 of O’Mahony et al.6 were used for Monte Carlo analysis (‘Model B’) . The maximum wall thickness, left atrial diameter, and age were assumed to be normally distributed and the incidence of non-sustained ventricular tachycardia (NSVT), a family history of SCD, and the presence of syncope binomially distributed and changed for each simulated ROC to create a wide range of risk profiles for the population. The LV outflow tract gradient was assumed to be from a gamma distribution (α = 1.75, β = 7.0 fitted to conform to the mean and extrema quoted). A sensitivity analysis was performed by varying the incidence of the family history of sudden death (FHSD), NSVT, and syncope from 5 to 35% of the population since these three predictors dominate the regression function. The confidence limits were also calculated for populations of 250 500 and 1000 patients as well as the 2147-patient study population. The data from Norrish8 were analysed in a similar way to Model A in O’Mahony et al.6 using the initial proportions of the 0–4%, 4–6%, and >6% mortality patient groups.
The LGE data were taken from Chan et al.7 and divided in the four groups specified, 0 LGE, 1–9, 10–19, and ≥20, and these classes, together with data in Table 2, were used to form the censored ROC, together with a ROC for the effect of risk factors. The convex hull AUC distribution was determined for RFs with random association with 37 events. A Monte Carlo model, with 1293 subjects, was constructed from the distribution of LGE, which was assumed among the 42% of patients with LGE to be from an exponential distribution (λ = −8.6, median 6, and quartiles 3 and 12). A sensitivity analysis was performed by perturbations of this distribution. The survival from SCD was obtained by interpolation of the 5-year event rate of patients without RFs (Table 3 in Chan et al.7) using a cubic polynomial. The RFs of each subject were computed from their frequencies in Table 17 and assumed to be randomly distributed throughout the population. The increases in hazard due to risk factors were taken from Table 5,7 and their potentiation by LGE was applied as a continuous function of 1.5/10% increase in LGE (Table 57) was applied as Cox proportional hazards to the interpolated survival curve, thus enabling the probability of survival of each simulated ‘patient’ to be computed.
The electrophysiological and risk factor data from Saumarez et al.17 have been recalculated using similar methods except that the electromagnetic interference in the signals, which varies between different laboratories and at different times in the same laboratory, has been reduced to a standard level using the discrete wavelet transform22 and Bayesian discrimination. During the 5-year follow-up period, two further events occurred in patients with no clinical risk factors and a high degree of fractionation, and these are included in the analysis. The RF ROC was generated using the method of Elliott et al.,5 and its limits were obtained by direct two-dimensional integration of its smoothed distributions, and comparison of the EP and risk factor methods in the same patient was performed via the ROC bootstrap.
Results
Figure 2A shows the ROCs for RFs in the case of number of RFs for Elliott et al.5 and survival according to low-, medium-, and high-risk groups for the O’Mahony ‘Model A’6 and for Norrish.8 The sensitivities for the O’Mahony Model A are 50% and 63%, respectively, with false positive rates of 14% and 30% (marked in Figure 2 with “high” and “medium” risk arrows, respectively), which correspond to the ESC guidelines2 for implantation and the paediatric study by Norrish,8 having sensitivities of 0.75 and 0.9 for false positives of 0.45 and 0.65, respectively. Since these are not continuous variables, no further improvement is possible, and to improve on these sensitivities, the entire population would require an ICD. Figure 2B shows the ROC for O’Mahony ‘Model B,’ and the dashed lines show the confidence bands obtained when applied to a population of 250, 500, and 1000 patients. The AUC for the model with 2147 patients is 0.67, and the upper limits of the AUCs for 250, 500, and 1000 patients are 0.9, 0.84, and 0.79, respectively. This wide variation of confidence limits explains the results from studies using the method of O’Mahony et al. and O’Mahony et al.3,6 with a relatively small number of patients. The AUC of the O’Mahony Model A is 0.71, which is compatible with the C-index of 0.7 quoted in O’Mahony et al.,6 the AUC of the Norrish model was 0.67, which is compatible with quoted C-index of 0.69,9 and that of the Elliott Monte Carlo model is 0.68. The ROCs are similar, which is due to the methods of O’Mahony et al.3 and O’Mahony et al.6 being derived from that developed in Elliott et al.,5 and the regression equation in O’Mahony et al. and O’Mahony et al.3,6 is dominated by predictors: NSVT, FHSD, LV wall thickness, and syncope, which were used in Elliott et al.5 The sensitivity analysis showed a change in an AUC of less than 0.03 for a 5–30% change in prevalence of NSVT, syncope, and FHSD.
Figure 3A shows the ROCs and bootstrapped limits comparing EP and RFs in the same patients. The EP method, which has a continuous variable predictor, has better predictive capacity than risk factors, suggesting that 20% (11–30%) of the population would need implantation to protect 90% of the patients who would suffer events. The difference in convex hull AUCs (0.89 vs. 0.71) is significant at P < 0.02 (Delong) and 0.01 (t-bootstrap) for a Type I error of 0.05. The RF curve is indistinguishable from that of Elliott et al. and O’Mahony et al.5,6
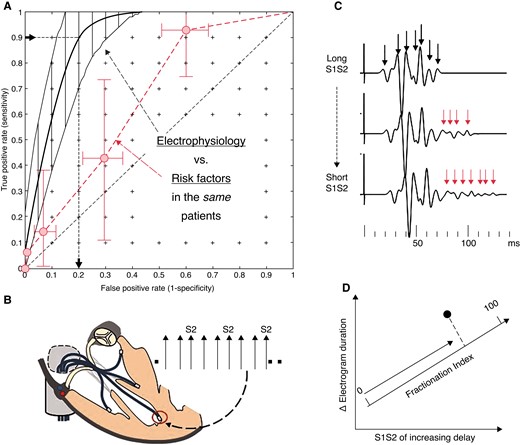
(A) The mean ROC and bootstrapped limits for electrophysiological method (black), which is a continuous variable and so can be plotted as a curve. The non-electrophysiological (RF) method (red) is measured in the same patients and plotted as number of RFs and the limits obtained by integration of the 2D bootstrap. Data from Saumarez et al.17 The false positive rate for 90% of event detection for EP is shown. (B) Electrodes are placed at four sites in the right ventricle (apex, mid-septum, RVOT, and free wall). Each site is paced in turn with a decremental sequence with an S2 inserted every third beat. The pacing sequence is repeated at each site with recordings made from the remaining electrodes. (C) The electrograms are processed to identify each potential, and in high-risk patients, the electrograms become prolonged with multiple delayed potentials as the S1S2 interval is decreased (arrowed). These are quantified by determining the S1S2 at which electrogram delay increases and the overall increase in electrogram duration. (D) These are averaged for all the runs to yield a single observation, which is projected on a ‘fractionation axis’ (formed prospectively by the principal component of the data from the initial studies).
Results from Chan et al.7 are shown in Figure 4. The raw, censored, ROC curve for LGE (2) is plotted in Figure 4A and has an AUC of 0.67, while the risk factors (1) have no predictive capacity (AUC = 0.521, convex hull AUC of 0.55; Monte Carlo range for random events: 0.5 to 0.58). The ROC using 5-year mortality and LGE with risk factors but no LGE enhancement of risk is shown in Curve 3 (AUC = 0.66), and the result of correction of LGE computed risk by additional interaction between risk factors and LGE is shown in Curve 4, with AUC = 0.7 (the AUC is quoted as 0.74, page 489 in Chan et al.7). The AUC of the latter varies from 0.68 to 7.6 when computed with the upper and lower limits of the risk factor correction. Curve 5 is calculated from the data in Figure2B of Chan et al.7
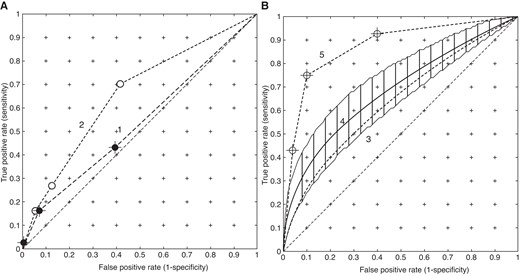
ROC curves for LGE calculated from Chan et al.7 Panel (A) is the primary data. Curve 1 is computed from the number of risk factors, while Curve 2 is the raw (censored) LGE data. Panel (B) shows the model outputs. Curve 3 (dotted line) is the simulation of survival using LGE only, and Curve 4 is the result of applying the non-linear interaction between risk factors and LGE. Curve 5 is plotted from the data shown in Figure 2B of Chan et al.7 Note that Curves 1, 2, and 5 are based on categories and Curves 3 and 4 are based on a continuous variable: risk.
Finally, Figure 5 shows the limits of the AUC estimates. The distribution calculated from the EP study17 is distinct. The mean AUCs for the RF methods are 0.67–0.72, while the mean AUC for the EP method is 0.89 and at least 0.8.
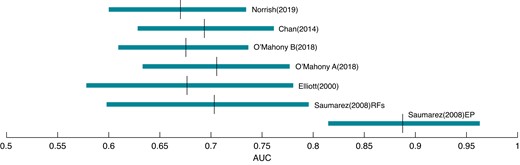
Distributions (0.025–0.975) and means of AUCs computed via bootstraps and Monte Carlo analysis for convex hull ROCs. The mean AUC for non-EP methods is ∼0.67–0.72 and for EP ∼0.89.
Discussion
The results of this statistical treatment covering the five studies suggest that prediction methods that use conventional clinical risk factors and MRI have low predictive capacities that will only detect 50–60% of patients at risk with a 15–30% false positive rate (AUC = ∼0.7), while the electrophysiological method, evaluated in small but statistically rigorous studies, detects 90% of events with a 20% false positive rate (AUC = ∼0.89), justifying the re-examination and development of the electrophysiological methods.
Does identification of a high-risk group necessarily imply prediction?
A common misconception is that if a subgroup of patients can be identified with a high incidence of SCD, this necessarily implies good prediction. Consider 2600 patients in which there is a subgroup of 200 ‘high-risk’ patients with an SCD incidence of 10% at 5 years, a subgroup of 600 with a 4% SCD incidence, while the remainder have an SCD incidence of 1.5%. This entire group is followed for 5 years, i.e. non-censored. Formal comparison of the survival curves using the Mantel–Haenszel test leads to a highly significant result (P < 0.001).
At 5 years, a mean of 27 patients in the low-risk subgroup will have died, 24 in the medium-risk subgroup, as opposed to 20 in the high-risk group, so only 20 out of 71 deaths will have occurred in the high-risk subgroup giving a sensitivity of ∼28%. The ROC has an AUC of 0.66, such that if the high- and medium-risk patients received an ICD, 44 patients would be protected and 27 would die at the expense of 736 non-discharging ICDs. If, however, the SCD rate in the low-risk subgroup is lowered to 0.2%, the predictive capacity of the high- and medium-risk groups is substantially increased with an AUC of 0.84. Thus, apparent high predictive ability, on the basis of a high-risk subgroup, is dependent on the size and mortality of the low-risk subgroup and may be substantially reduced by a large low-risk, but not no-risk, group. Had there been a formal hypothesis in which predictive measures are explicitly stated, for example, the lower limit of the AUC will be greater than a specified value, this study would fail.
Adequacy of statistical power
Construction of regression models require, as a rule of thumb, 10 events for every predictor in the model, and therefore database studies3,5,6,7,8 which are used to construct regression models must have a large number of patients to achieve a numerically reliable regression model irrespective of the predictive capacity of the model in question. Therefore, one should not automatically assume that a study containing a larger number of patients is a ‘better’ study than one with a smaller number without qualifying the predictive capacity. While the paced fractionation method17 was designed using substantially less patients (179), Figures 3 and 5 show that it had adequate statistical power because it was measuring large effects.
Differences in recruitment and risk factors
Patients in the PEFA studies17 were recruited in order of presentation, and this led to a lower proportion of patients with zero risk factors than database studies, and this may have been influenced by the report that patients with zero or 1 RFs were low risk5 although more than half the SCD occurred in these groups.5 However, this does not invalidate the physiological relationship between slowed conduction and SCD. The regression equation used in O’Mahony et al., O’Mahony et al., Maron et al., Zegkos et al., Dong et al., Vriesendorp et al., Fernández et al., and Leong et al.3,6,23–29 is dominated by four factors, NSVT, syncope, LV wall thickness, and FHSD, and these RFs were measured in the PEFA study17 although LV thickness was recorded as a categorical variable. The similarity between the bootstrapped ROCs and AUCs for Elliott et al., O’Mahony et al., and Saumarez et al.5,6,17 shown in Figure 5 suggests that the results not substantially affected by RF selection.
‘All models are wrong—some are useful’: what is a useful level of prediction?
The level of prediction by RFs with AUCs ∼0.67–0.74 from five studies is at the lower limit of the definition of acceptability18 and implies that only half of the at-risk patients are identified for a 20% implantation rate. This was reported in a database study,23 which appears to be within the limits of O’Mahony et al.,6 the ACC/AHA and ESC guidelines have poor specificity24 for a reasonable sensitivity, the ESC guidelines had an AUC of 0.68 in a study of 511 Chinese patients,25 and a study comparing the ESC guidelines to the ACC guidelines had a C-index of 0.69.26 However, with an AUC of 0.89, the EP method appears to have useful predictive capacity. Since both the original study on which the ESC guidelines are based3 and the validation study6 have quoted C-index (Uno’s) of 0.7 and the paediatric study 0.698 (and 0.71 in a validation study27), it is not surprising that there should be a wide variation in results when the guidelines are used predictively. Nevertheless, a study of 502 patients28 reported using the ESC guidelines that the AUC for deaths was 0.92. This high AUC is due to zero mortality in the low-risk group (348 patients), while applying the estimates from O’Mahony et al. and O’Mahony et al.3,6 between 3 and 9 deaths or 3 to 315 would be expected, which would have lowered the AUC. Events occurred in low-risk patients in most studies3,5,6,7,8,22,23,24 and are in the 2–4% event range, and so the high predictive accuracy in this study28 stems from an unlikely event. The C-index of 0.86 for ESC method in 288 patients29 is within the 2.5% limits of 0’Mahony ‘Model B’ (288 patients, AUC = 0.57–0.87) (as shown in Figure 2B) and has a 50% sensitivity.
To devise a strategy for ICD implantation, the maximum acceptable rate of failed predictions must be defined and viewed against the number of implants that will deliver therapy. If 90% of potentially lethal arrhythmias, aborted by ICD implantation, is a reasonable goal, risk factors cannot achieve this without implanting the entire population. A judgement about what is effective prediction depends on the severity of the effect in question and the potential complications of therapy guided by the predictor as well as the actual SCD rate. For example, given a 3% 5-year SCD rate, the ESC implant guidelines would expect 15 deaths/1000 and 1 discharge for every 10 implantations (12/1000 deaths and 1 discharge/17 ICDs for ‘consider implantation’), while the EP method would suggest 3/1000 deaths and 1 discharge/8 ICDs. One might argue that EP is too elaborate and expensive to use in the population, or alternatively one might argue that it identifies more patients with events and prevents life-changing and expensive ICD implantation in young patients who do not need one.
Therefore, the use of EP becomes a policy decision, which may vary between countries (e.g. there is a four-fold difference in total implantations between Germany and the UK), on the costs of preventing an SCD and the costs and the risks of EP testing, as well as those of non-discharging ICDs and their complications, which are roughly the same level as the appropriate discharge rate.30,31 In the case of SCD, and in view of potential ICD complications, a strategy based on marginal levels of prediction seems questionable, although ATP therapy for prodromal VT and increased safety of the Subcutaneous ICD may mitigate complications and improve matching of the device to the patient.32,33
Causality in prediction
Prediction can be developed by regression or causality. Regression3,5,6,8 attempts to link a set of variables through a function to an observation (SCD) without any inference about the mechanisms involved, and any assertion about the relationship between risk factors and the mechanisms of SCD is speculative. Causality uses a mechanistic model of the process to infer a result and may be more powerful as it directs attention towards what variables should be measured to perform prediction. The basis of the EP method17 is that lethal arrhythmias are re-entrant, and re-entrant arrhythmias require slowed conduction as the substrate for their initiation, and this could be caused by disarray. Thus, the hypothesis was raised that patients who are at risk of an arrhythmia should have slowed conduction velocities demonstrable in their ventricular myocardium without inducing an arrhythmia. This was tested by measuring conduction delay following paced stimuli at various sites in the ventricles,9,10 which raised the hypothesis for formal prospective testing17 as described in the introduction. However, the delays seen in multiple diseases,11 including dilated cardiomyopathy (DCM), idiopathic VF, the long QT syndrome (LQTS),34 and paroxysmal atrial fibrillation,35 indicated that the mechanism of VF in HCM, assumed to be due to disarray, is a subset of a more general mechanism of arrhythmogenesis and the precise mechanisms in HCM are not fully understood.36 The consistent association between fractionated paced electrograms and arrhythmias from multiple studies suggests that electrophysiology, rather than risk factors, measures something close to the causal chain of events in SCD, implying that substantially better prediction is possible.
A further concept raised by the EP studies is that recordings made in sinus rhythm do not show the effects associated with SCD. This is consistent with the arrhythmia substrate arising dynamically, with the perturbation of the myocardium that leads to an arrhythmia being mimicked by pacing, and it is therefore unlikely that meaningful measurements relating to risk can be made in resting sinus rhythm. This concept is supported by a recent study on the EP mechanisms in the initiation of induced VF, which directs further attention to the key determinants of SCD,37 while the role of PES remains controversial,10,38,39 may be non-specific with aggressive stimulation, and does not reveal an arrhythmia mechanism per se. A recent study in a small number of patients has shown that ECG-I during and immediately after exercise (but not at rest) discriminates VF and non-VF patients on the basis of abnormal ventricular activation,40 which is consistent with PEFA measurements. The relative merits of myocardial perturbation through exercise or pacing and ECG or intracardiac recordings remain an open question in studies designed not to induce an arrhythmia.
Testing prediction
Crucially, predictive models need testing. Clinical predictive models constructed from databases are rapidly evolving,41,42 but database use and selection has drawbacks, particularly of inhomogeneity and that key predictive variables may not be included in the database.43,44 Ideally patients should be recruited prospectively and the formal predictive hypothesis tested by predicting the patients’ risk in advance as was the case in Saumarez et al.17 The use of databases to test a predictive hypothesis is possible and is easier to perform. However, if the advantage of having a large number of subjects from multiple databases is not reflected in a substantial improvement in prediction statistics, the data may be only distantly related to the effect in question and validation fails. A further important issue in validation and comparison of models is that different models, constructed from the same data, may yield substantially different results, as has recently been described in the computation of the reproduction number (‘R’) in the recent Covid pandemic.45
A number of studies using MRI have suggested that there may be SCD markers, but it is unclear how these markers are related to the fundamental processes involved in arrhythmogenesis. While fibrosis is revealed, this gives no information about the potential for re-entrant pathways or change in tissue refractoriness. The study analysed here reported that LGE was associated with increased mortality in HCM,7 when combined with RFs (AUC = 0.74, page 489 in Chan et al.7). Despite the RFs in this study having no predictive capacity, per se, they apparently enhance the risk associated with LGE, although the predictive capacity remains low. The model that computes the data shown as Curve E in Figure 4 (Figure2B in Chan et al.7) is not sufficiently well described to be analysed, and it is not clear how such enhancement of prediction can be related to the primary data. If MRI has potential for non-invasive risk prediction, it is essential that experiments are designed with prediction in mind, rather than identifying high- and low-risk groups, which can be misleading.
Given modern electrophysiological knowledge, the prediction of an arrhythmia by proxies is an extraordinary claim, and extraordinary claims require extraordinary evidence. This analysis challenges the current approach of using risk factors and imaging and implies they are the wrong predictors to achieve a high and clinically useful risk assessment and that their use to create guidelines for patient management is questionable.2 The argument about non-EP proxies also applies to heart failure where the use of left ventricular ejection fraction is used as a predictor. Using data from Curtis’ study of the relationship between prognosis and LVEF in 7788 patients,46 the calculated AUC for SCD against LVEF is ∼0.61, which, despite forming part of national guidelines, implies that it has little value for prediction and appropriate ICD implantation.47
Finally, this study implies that the prediction of SCD and ICD implantation needs to be reassessed and refined, using statistical techniques which genuinely reflect prediction,48 and that we need to refocus our efforts on the insights gained by cardiac electrophysiology17,37 into the mechanisms of arrhythmogenesis to develop rational, physiologically based, models for SCD prediction. The aim of this paper is to open this debate.
Data availability
The data is taken from previous publications (Circulation, European Heart Journal).
References
Author notes
Conflict of interest: R.C.S. is a director of a company developing novel electrophysiological equipment for risk prediction in post-MI patients, and N.S.P. is a shareholder in the same company. All remaining authors have declared no conflicts of interest. P.D.B. and E.R.B. are editors of EP Europace and were not involved in the peer review process or publication decision.
