


Abstract
Unipolar voltage (UV) mapping is increasingly used for guiding ablative therapy of atrial fibrillation (AF) as unipolar electrograms (U-EGMs) are independent of electrode orientation and atrial wavefront direction. This study was aimed at constructing individual, high-resolution sinus rhythm (SR) UV fingerprints to identify low-voltage areas and study the effect of AF episodes in patients with mitral valve disease (MVD).
Intra-operative epicardial mapping (interelectrode distance 2 mm) of the right and left atrium, Bachmann’s bundle (BB), and pulmonary vein area was performed in 67 patients (27 male, 67 ± 11 years) with or without a history of paroxysmal AF (PAF). In all patients, there were considerable regional variations in voltages. UVs at BB were lower in patients with PAF compared with those without [no AF: 4.94 (3.56–5.98) mV, PAF: 3.30 (2.25–4.57) mV, P = 0.006]. A larger number of low-voltage potentials were recorded at BB in the PAF group [no AF: 2.13 (0.52–7.68) %, PAF: 12.86 (3.18–23.59) %, P = 0.001]. In addition, areas with low-voltage potentials were present in all patients, yet we did not find any predilection sites for low-voltage potentials to occur.
Even in SR, advanced atrial remodelling in MVD patients shows marked inter-individual and regional variation. Low UVs are even present during SR in patients without a history of AF indicating that low UVs should carefully be used as target sites for ablative therapy.
Even in sinus rhythm, advanced atrial remodelling in mitral valve disease patients shows marked inter-individual and regional variation.
Paroxysmal atrial fibrillation is associated with decreased unipolar voltages at Bachmann’s bundle and a higher number of low-voltage potentials.
Areas with low-voltage potentials are present in all patients.
Low-voltage potentials are even present during sinus rhythm in patients without a history of atrial fibrillation indicating that low voltage should carefully be used as target sites for ablative therapy.
Introduction
Unipolar voltage (UV) mapping is increasingly used to define the substrate of cardiac arrhythmias like atrial fibrillation (AF).1 In recent studies, low bipolar voltage areas are regarded sites of structurally remodelled tissue and have therefore become targets for AF ablation.2–4 However, there are many discrepancies between studies in, e.g. mapping and ablation strategies, rhythm during mapping, and patient selection, resulting in mixed outcomes.5 In daily clinical practice, electro-anatomical mapping is performed via endovascular catheters at the endocardial side, using bipolar electrograms (EGMs). However, non-substrate-related factors such as activation direction also influence voltages of bipolar EGMs.5 Unipolar electrograms (U-EGMs), on the other hand, are independent of the electrode orientation and atrial wavefront direction and have the benefit over bipolar EGMs that their morphology contains additional information on the progression of the wavefront and remote activations. It is for these reasons that U-EGMs are increasingly used in recent electrophysiological studies and newly developed mapping systems guiding (ventricular) ablation procedures.1,5,6 However, the use of UV mapping remains less established in mapping of the atrial substrate.
Nevertheless, multiple methods and thresholds have been defined to identify low-voltage areas and abnormal tissue in both bipolar- and U-EGMs. In addition, several studies have shown local variation in endocardial bipolar EGM voltages during sinus rhythm (SR) between atrial regions and that specific regional differences exist between patients with and without AF, especially within the left atrium (LA).7,8
As no significant differences were found between endocardial and epicardial U-EGM voltages by van der Does et al.,9 high-resolution epicardial mapping data of the entire atria can be used to create a representative UV profile, reflecting characteristics of unipolar potentials. These voltage fingerprints can be used to identify low-voltage areas and to examine the effect of AF episodes on SR potential voltages. Therefore, this study was aimed at constructing individual, high-resolution unipolar SR voltage profiles to identify low UV areas and study the effect of AF episodes on UV potentials in patients with mitral valve disease (MVD).
Methods
Study population
The study population consisted of 67 successive adult patients undergoing mitral valve surgery or a combination of mitral valve and coronary bypass surgery in the Erasmus Medical Center Rotterdam. This study was approved by the institutional medical ethical committee (MEC2010-054/MEC2014-393).10,11 Written informed consent was obtained from all patients and patient characteristics (e.g. age, medical history, cardiovascular risk factors, time in AF) were obtained from the patient’s medical record. The study population was classified into two groups: those without a history of AF (no AF group) and those with a history of paroxysmal AF (PAF group).
Mapping procedure
Epicardial high-resolution mapping was performed prior to commencement of extra-corporal circulation, as previously described in detail.10,11 A temporal bipolar epicardial pacemaker wire attached to the right atrial (RA) free wall served as a reference electrode and a steel wire fixed to subcutaneous tissue of the thoracic cavity was used as an indifferent electrode. Epicardial mapping was performed with a 128-electrode array or 192-electrode array (electrode diameter, respectively, 0.65 or 0.45 mm, interelectrode distances 2.0 mm). Mapping was conducted by shifting the electrode array along imaginary lines with a fixed anatomic orientation, covering the entire epicardial surface of the RA, Bachmann’s bundle (BB), pulmonary vein area (PVA), and LA, following a predefined mapping scheme as illustrated in the upper left panel of Figure 1. Omission of areas was avoided at the expense of possible small overlap between adjacent mapping sites. The RA was mapped from the cavo-tricuspid isthmus, shifting perpendicular to the caval veins towards the RA appendage. The PVA was mapped from the sinus transversus fold along the borders of the right and left pulmonary veins down towards the atrio-ventricular groove. The left atrio-ventricular groove (LAVG) was mapped from the lower border of the left inferior pulmonary vein towards the LA appendage. BB was mapped from the tip of the LA appendage across the roof of the LA, behind the aorta towards the superior cavo-atrial junction.
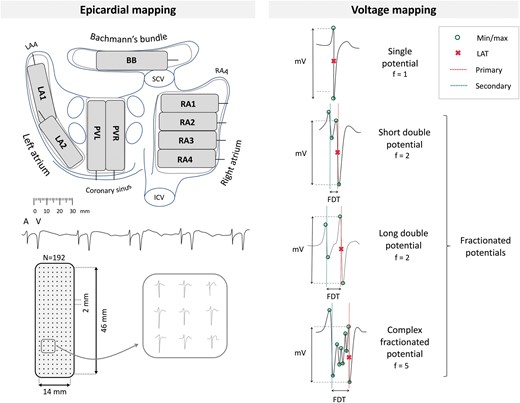
Upper left panel: projection of the 192-unipolar electrode array on a schematic posterior view of the atria. Lower left panel: epicardial, unipolar potentials recorded during 5 s of SR containing atrial deflections (A) and far-field ventricular signals (V). Typical examples of nine unipolar potentials obtained from the RA are shown outside the mapping. Right panel: classification of potential type according to the number of deflections (f). Electrogram voltage is determined as the peak-to-peak amplitude of the steepest (primary) deflection. BB, Bachmann’s Bundle; FDT, fractionation delay time; ICV, inferior caval vein; LAA, left atrial appendage; LA, left atrium; PV, pulmonary veins; RAA, right atrial appendage; RA, right atrium; SCV, superior caval vein.
Five seconds of SR were recorded from every mapping site, including a surface ECG lead, a calibration signal of 2 mV and 1000 ms, a bipolar reference EGM and all unipolar epicardial EGMs. In patients who presented in AF, SR mapping was performed after electrical cardioversion. Patients who could not be converted to SR were excluded from analysis. Data were stored on a hard disk after amplification (gain 1000), filtering (bandwidth 0.5–400 Hz), sampling (1 kHz), and analogue to digital conversion (16 bits).
Data analysis
U-EGM morphology was semi-automatically analysed using custom-made software. EGMs with injury potentials, recording sites with ≥25% excluded or missing EGMs, and atrial extrasystoles were excluded from analysis. The steepest negative slope of an atrial deflection was marked as the local activation time, provided that the amplitude of the deflection was at least two times the signal-to-noise ratio of the EGM. The minimal time between two successive deflections (‘latency’) was set to 2 ms. All signal markings were manually checked and corrected in case of markings on electrical artefacts evaluated by a consensus of two investigators.
The potential amplitude is defined as the peak-to-peak voltage of the steepest deflection. Low-voltage is defined as the fraction of potentials with an amplitude below the 5th percentile of all potentials obtained from all MVD patients without AF. Fractionated potentials are defined as potentials with ≥2 deflections. Conduction velocity (CV) is computed using discrete velocity vectors as previously described. Slowing of conduction was defined as a local CV of <28 cm/s and conduction block as a local conduction delay of <18 cm/s. Simultaneous activated areas without CV were excluded to avoid inclusion of far field potentials.
Statistical analysis
All data were tested for normality. Normally distributed data are expressed as mean±SD and analysed with a paired t-test or one-way ANOVA. Skewed data are expressed as median (25th–75th percentile) and analysed with a Kruskal–Wallis test, Mann–Whitney U test, or Wilcoxon signed-rank test, whichever appropriate. Categorical data are expressed as numbers and percentages and analysed with a χ2 or Fisher’s exact test. Correlation was determined by an ordinary least squares regression model. Distribution data were analysed with a two-sample Kolmogorov–Smirnov test. A P-value <0.05 was considered statistically significant. Bonferroni correction was applied for comparison of the four atrial regions; a P-value of <0.0083 (0.05/6) was considered statistically significant.
Results
Study population
Clinical characteristics of the study population, including 44 patients without (‘no AF group’) and 23 patients with PAF, are described in detail in Table 1. These groups differed in age (no AF: 65 ± 12 vs. PAF: 73 ± 6 years, P = 0.003) and the use of Class III antiarrhythmic drugs [no AF: 0 vs. PAF: 7 (30%), P < 0.001]. Patients had either ischaemic and MVD [no AF: 20 (45%) and PAF: 6 (26%)] or only solely MVD. The gradient of both mitral insufficiency and stenosis did not differ between both groups; the majority of the patients had severe mitral insufficiency [no AF: 31 (70%), PAF: 13 (70%), P = 0.940]. LA dilation was present in 28 patients without AF (64%) and in 16 patients with PAF (70%). Most patients in both groups had normal left ventricular function [no AF: 29 (66%) and PAF: 17 (74%)].
Patient characteristics (N = 67)
| No AF | PAF | P-Value | |
|---|---|---|---|
| Patients | 44 (66) | 23 (34) | — |
| Male | 17 (39) | 10 (43) | 0.903 |
| Age (years) | 65 ± 12 | 73 ± 6 | 0.003 |
| Cardiovascular risk factors | |||
| BMI (kg/m2) | 24.5 (22.1–26.8) | 25.3 (22.2–31.9) | 0.281 |
| Underweight (<18.5) | 2 (5) | 0 (0) | 0.778 |
| Normal weight (18.5–25) | 22 (50) | 11 (48) | 0.866 |
| Overweight (25–30) | 15 (34) | 5 (22) | 0.443 |
| Obese (≥30) | 5 (11) | 7 (30) | 0.110 |
| Hypertension | 15 (34) | 12 (52) | 0.242 |
| Dyslipidaemia | 14 (32) | 2 (9) | 0.071 |
| Diabetes mellitus | 7 (16) | 3 (13) | 0.755 |
| Left atrial dilatation >45 mm | 28 (64) | 16 (70) | 0.830 |
| Left ventricular dysfunction | 15 (34) | 6 (26) | 0.694 |
| Mitral stenosis | |||
| No | 41 (93) | 22 (96) | 0.685 |
| Severe | 3 (7) | 1 (4) | 0.685 |
| Mitral insufficiency severity | |||
| Mild | 1 (2) | 0 (0) | 0.466 |
| Moderate | 8 (18) | 3 (13) | 0.848 |
| Moderate-to-severe | 4 (9) | 4 (17) | 0.550 |
| Severe | 31 (70) | 16 (70) | 0.940 |
| Coronary artery disease | 20 (45) | 6 (26) | 0.200 |
| Antiarrhythmic agents | |||
| Class I | 1 (2) | 0 (0) | 0.466 |
| Class II | 23 (52) | 11 (48) | 0.930 |
| Class III | 0 (0) | 7 (30) | <0.001 |
| Class IV | 1 (2) | 2 (9) | 0.559 |
Values are presented as mean ± SD, median (inter-quartile ranges) or as N (%).
BMI, body mass index; (P)AF, (paroxysmal) atrial fibrillation.
Data characteristics
As demonstrated in Table 2, a total of 600 722 potentials were analysed out of 829 SR recordings of 5 s duration. There was no difference between the median number of potentials between the no AF and PAF group and the median amplitude of all potentials recorded from the entire epicardial surface did also not differ between these two groups [no AF: 4.70 (4.05–5.43) vs. PAF: 4.52 (3.73–5.25) mV, P = 0.138].
Analysis of electrophysiological parameters per patient (N = 67)
| MVD without AF (N = 44) | MVD with AF (N = 23) | P-Value | |
|---|---|---|---|
| Right atrium | |||
| Number of potentials | 4067 (3346–5797) | 4229 (2881–4936) | 0.086 |
| Amplitude (mV) | 4.86 (3.97–5.71) | 4.75 (3.84–6.15) | 0.492 |
| Fractionated potentials (%) | 14.79 (9.76–19.60) | 16.55 (8.70–23.83) | 0.197 |
| Low voltage (%) | 6.49 (2.34–9.15) | 8.37 (2.94–14.06) | 0.150 |
| Fractionated low voltage (%) | 50.0 (37.5–64.4) | 54.4 (37.2–65.0) | 0.433 |
| Bachmann’s bundle | |||
| Number of potentials | 984 (783–1206) | 940 (779–1126) | 0.295 |
| Amplitude (mV) | 4.92 (3.45–6.09) | 2.95 (2.24–4.57) | 0.007 |
| Fractionated potentials (%) | 19.58 (12.40–31.72) | 28.68 (17.70–39.55) | 0.064 |
| Low voltage (%) | 1.79 (0.37–8.02) | 11.98 (2.95–21.50) | 0.001 |
| Fractionated low voltage (%) | 85.0 (77.5–98.3) | 74.6 (50.2–96.2) | 0.080 |
| Pulmonary vein area | |||
| Number of potentials | 1979 (1441–2608) | 2136 (1592–2596) | 0.497 |
| Amplitude (mV) | 3.84 (2.45–7.15) | 3.95 (2.62–5.02) | 0.268 |
| Fractionated potentials (%) | 11.89 (9.08–17.01) | 21.70 (13.48–28.63) | <0.001 |
| Low voltage (%) | 6.49 (0.20–13.31) | 10.19 (3.89–14.28) | 0.061 |
| Fractionated low voltage (%) | 36.7 (18.5–61.7) | 51.3 (23.6–65.4) | 0.342 |
| Left atrium | |||
| Number of potentials | 1626 (1132–2302) | 1777 (1062–2077) | 0.439 |
| Amplitude (mV) | 4.42 (2.99–5.87) | 4.64 (3.65–5.72) | 0.363 |
| Fractionated potentials (%) | 10.92 (6.43–17.74) | 17.47 (11.30–20.54) | 0.062 |
| Low voltage (%) | 3.63 (1.57–11.35) | 4.04 (0.72–8.98) | 0.358 |
| Fractionated low voltage (%) | 25.9 (10.7–48.8) | 29.6 (17.5–73.4) | 0.144 |
Values are presented as median (inter-quartile ranges) or as N (%).
MVD, mitral valve disease; (P)AF, (paroxysmal) atrial fibrillation.
Correlation between unipolar voltage and interatrial conduction
There was no clear correlation between UV and CV, though smaller voltages were recorded in areas of conduction slowing [1.74 (0.88–3.53) vs. 4.72 (2.46–7.61) mV, P < 0.001] and conduction block [1.22 (0.69–2.26) vs. 4.79 (2.55–7.65) mV, P < 0.001]. There was a clear difference in UV between fractionated potentials and single potentials in which the former type results in smaller voltages compared with the latter [2.05 (1.04–3.75) vs. 5.16 (2.85–8.01) mV, P < 0.001]. In addition, as demonstrated in Figure 2, there was a clear inversely proportional relationship between UV and the number of deflections [1: 5.16 (2.85—8.01) mV; 2: 2.20 (1.14—3.95) mV; 3: 1.21 (0.68–2.26) mV; ≥4: 0.94 (0.52–1.71) mV, P < 0.001 for all]. Furthermore, UV was inversely correlated with age and BMI [R2=0.21; age: −0.04 mV/year, P = 0.005; BMI: −0.07 mV/kg/m2, P = 0.043). There was no difference in UV between patients with different gradients of mitral insufficiency or stenosis.
![Relation between potential amplitude and number of deflections [median (25th–75th percentile)].](https://oup.silverchair-cdn.com/oup/backfile/Content_public/Journal/europace/23/3/10.1093_europace_euaa336/2/m_euaa336f2.jpeg?Expires=1750278969&Signature=HMpMmHty8bp4sWUqkGJ6mXJU3HqRfa36jmJzNdRs43GFzbvQKnS4pkEZeCgp4KZGWSVamjRUAgCy2KlWxvhoqQDmjhVozID73Wezw7JsQ19Kaqwu9mDCHbZj6OeKiwkWmr7D39ZLbsTrZVYp70FltzyU0Gh9RFAi5nDJz9UobuQv-1map82bv5UHZq2xKR9at9mVc238OCJUifOftuGgWJ1WCcav10ubJPHBByozb3bbH4bz9frq1d4XxsaGIX3PhUjhTMAtTwcoal1gJlDnRH~g6HS8BjJ5ybQtcn1XKolkiLaWnvJ3vXbGWmn1xnFQx-zmWRvbd0ryqdukb0241Q__&Key-Pair-Id=APKAIE5G5CRDK6RD3PGA)
Relation between potential amplitude and number of deflections [median (25th–75th percentile)].
Unipolar voltage mapping
In Figure 3, 12 representative examples of color-coded spatial distributions of potential voltages during SR in 6 patients without and 6 with PAF are shown. In all patients, there is a wide variation in potential voltages throughout the entire atrial surface without a clear predilection site for low voltages.
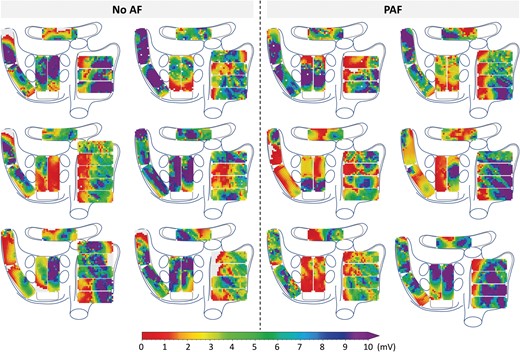
Representative examples of unipolar epicardial voltage maps during one sinus beat in six patients without history of AF (left) and six patients with PAF (right). (P)AF, (paroxysmal) atrial fibrillation.
Regional differences in unipolar voltages
In the following step, U-EGMs were subdivided according to the corresponding atrial recording regions (RA, BB, PVA, and LA); their characteristics are listed in Table 2. In the no AF group, there were no significant differences in median potential voltages between the various atrial regions (P = 0.750). However, in the PAF group, UVs of potentials recorded at BB [2.95 (2.24–4.57) mV] were significantly lower compared with RA potentials [4.75 (3.84–6.15) mV, P = 0.004] and LA potentials [4.64 (3.65–5.72) mV, P = 0.003]. Comparing the no AF and PAF group, UVs at BB were significantly lower in the latter group [no AF: 4.92 (3.45–6.09) mV, PAF: 2.95 (2.24–4.57) mV, P = 0.007].
In the no AF group, there was a significantly higher number of fractionated potentials at BB [19.58 (12.40–31.72) %] compared with the RA [14.79 (9.76–19.60) %, P < 0.001], PVA [11.89 (9.08–17.01) %, P < 0.001], and LA [10.92 (6.43–17.74) %, P < 0.001]. In the PAF group, a significantly higher number of fractionated potentials was observed in BB [28.68 (17.70–39.55) %] compared with the RA [16.55 (8.70–23.83) %, P < 0.001] and LA [17.47 (11.30–20.54) %, P = 0.001], but not at the PVA [21.70 (13.48–28.63) %, P = 0.114]. Compared with the no AF group, more fractionated potentials at the PVA were found in the PAF group [no AF: 11.89 (9.08–17.01) %, PAF: 21.70 (13.48–28.63) %, P < 0.001].
Determination of low-voltage areas
The p5 of all potentials obtained from all MVD patients without AF was 1.0 mV, which was therefore used as cutoff value in identification of low-voltage areas. As demonstrated in Table 2, a larger number of low-voltage potentials were recorded at BB in the PAF group compared with the no AF group [no AF: 1.79 (0.37–8.02) %, PAF: 11.98 (2.95–21.50) %, P = 0.001].
Regional differences in low-voltage areas
Within the areas of low-voltage, 46.2 (31.0–59.8) % of the potentials were fractionated in the no AF group and 47.1 (38.9–56.4) % in the PAF group (P = 0.450). Specifically, in the no AF group, most fractionated low-voltage potentials were found at BB [BB: 85.0 (77.5–98.3) % vs. RA: 50.0 (37.5–64.4) %, P < 0.001; PVA: 36.7 (18.5–61.7) %, P < 0.001; LA: 25.9 (10.7–48.8) %, P < 0.001]. In addition, the amount of fractionated low-voltage potentials was higher at the RA compared with the LA (P < 0.001). In the PAF group, however, BB was only higher compared with the PVA and LA [BB: 74.6 (50.2–96.2) % vs. PVA: 51.3 (23.6–65.4) % and LA: 29.6 (17.5–73.4) %, P = 0.003 and P = 0.006, respectively].
Individual voltage fingerprints
The voltage distribution is depicted for each individual patient in a so-called voltage fingerprint, as demonstrated in Figures 4 and 5. In all patients, there was a considerable variation in voltage distribution between all atrial regions and clear inter-individual differences were found. In the no AF group, considerable inter-individual variations in the dispersion of median voltages were found between the atrial regions ranging from 0.78 to 9.90 mV (median: 4.11 mV), while in the PAF group the variations ranged from 0.51 to 7.23 mV (median: 3.45 mV) (P = 0.070). The p5 of the voltages differed between the individual patients, and between the patients without AF and with PAF [no AF: 0.84 (0.71–1.12) mV, PAF: 0.65 (0.57–1.01) mV, P = 0.041]. In all patients, fractionation was found in one or more atrial regions, ranging in the no AF group from 0.54% to 31.89% (median: 15.60%) and from 8.86% to 29.77% (median: 18.61%) in the PAF group (P = 0.037).
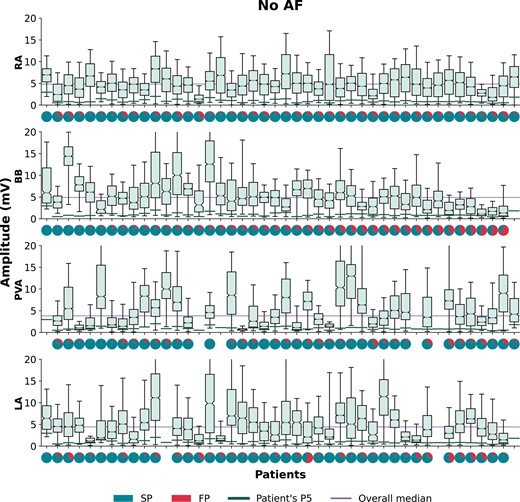
Boxplots of the voltage distributions during SR depicted for each patient separately without AF recorded at the RA, BB, PVA, and LA. For each patient, a pie plot of the potential type distribution is given, indicating the number of SPs (turquoise) and FPs (red). For each patient, a green line indicates a patient’s voltage p5 and the lilac line represents the overall voltage median per atrial region. Patients are ranked in descending order according to the amount of SPs at BB. AF, atrial fibrillation; BB, Bachmann’s bundle; FP, fractionated potentials; LA, left atrium; PVA, pulmonary vein area; RA, right atrium; SP, single potentials; SR, sinus rhythm.
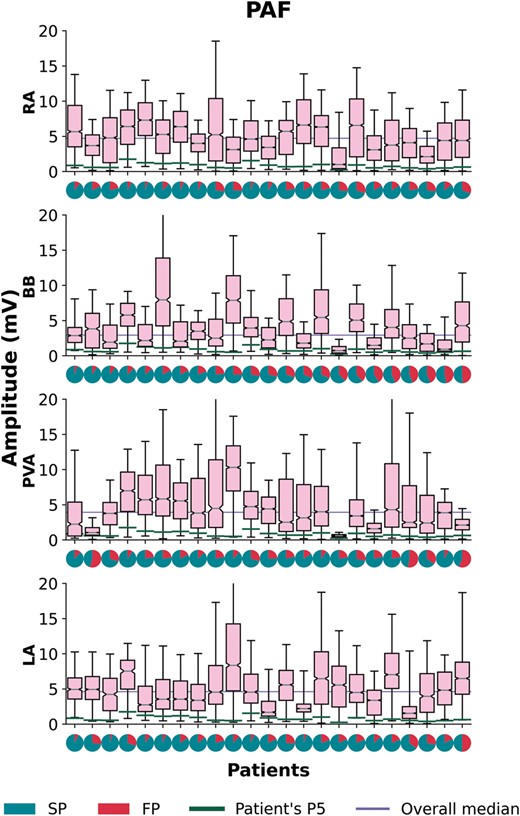
Boxplots of the voltage distributions during SR depicted for each patient separately with PAF recorded at the RA, BB, PVA, and LA. For each patient a pie plot of the potential type distribution is given, indicating the number of SPs (turquoise) and FPs (red). For each patient, a green line indicates a patient’s voltage p5 and the lilac line represents the overall voltage median per atrial region. Patients are ranked in descending order according to the amount of single potentials at BB. BB, Bachmann’s bundle; FP, fractionated potentials; LA, left atrium; PAF, paroxysmal atrial fibrillation; PVA, pulmonary vein area; RA, right atrium; SP, single potentials; SR, sinus rhythm.
Predilection sites for low-voltage areas
For each individual patient, the location with the highest amount of low-voltage was determined, as demonstrated in Figure 6. In the no AF group, there was no clear predilection site for low-voltage areas. However, the amount of low-voltage areas at the RA [7.8 (3.1–11.4) %] was lower compared with BB and PVA [22.3 (11.6–26.2) % and 19.8 (12.5–32.5) %; P = 0.007 and P < 0.001, respectively]. In the PAF group, low-voltage areas occurred more frequently at BB (48%), yet, comparable with the no AF group, there were no significant regional differences in the amount of low-voltage areas. Comparing the no AF and PAF group, low-voltage areas occurred more frequently at BB (21% vs. 48%; P = 0.020) in the PAF group. However, the amount of low-voltage sites did not differ at any region between both groups.
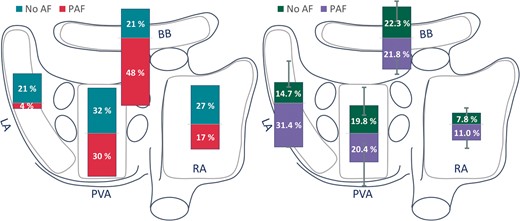
Bars plotted on a schematic posterior view of the atria demonstrating the most prominent site of low-voltage areas (left panel) and amount of low voltage (right panel) depicted for patients without AF (turquoise/green) and with PAF (red/lilac) in the RA, BB, PVA, and LA. BB, Bachmann’s bundle; LA, left atrium; (P)AF, (paroxysmal) atrial fibrillation; PVA, pulmonary vein area; RA, right atrium.
Discussion
In this study, we measured UVs at a high resolution scale in MVD patients and demonstrated extensive inter-individual and regional differences in voltage distribution in both patients without and with a history of AF. Even in SR, patients with PAF have lower UVs at BB and a higher number of low-voltage potentials. In addition, areas with low-voltage potentials were present in all patients, yet we did not find any predilection sites for low-voltage potentials to occur.
Unipolar voltage mapping
Structural properties of atrial tissue can be estimated from the spatial distribution of EGM amplitudes, commonly known as voltage mapping. These EGMs are recorded in either the unipolar or bipolar configuration. In daily clinical practice, the bipolar EGM is more commonly used as it contains more local information from the area of myocardium between two electrodes. However, in bipolar recordings, several non-substrate-related factors can theoretically influence the EGM voltage, like activation orientation, electrode spacing, electrode size, tissue contact, and filtering, and may therefore provide less accurate information on the arrhythmogenicity of the underlying myocardial tissue.5,12,13 U-EGMs, on the other hand, can be regarded as the sum of instantaneous current dipoles of a wavefront, reflecting cardiac electrical activity of the tissue surrounding the recording electrode. As the amplitude depends on the volume of simultaneously activated cardiac tissue, synchronous activation of myocardium results in relative large amplitude U-EGMs, whereas areas of asynchronously activated myocardium cause a decrease in U-EGM amplitudes.14 It is for these reasons that U-EGMs are more and more used in newly developed mapping systems.6,15
Determination of low-voltage areas
Low-UV EGMs are commonly associated with areas of fibrosis, which produce reduced electric fields and consequently lower potential differences.16 The relationship between clinical outcomes, AF substrate factors, AF triggers, and low-voltage areas depends critically on the voltage threshold chosen to define low voltage. A value of 0.5 mV is commonly used to define low voltage in atrial bipolar EGMs which is not based on the presence of defined underlying abnormalities in atrial structure or function.17 In our study, we used a value of 1.0 mV, which was based on the 5th percentile of all measured potential amplitudes in the MVD patients without AF. Other studies define abnormal voltage as the voltage at the 5th percentile of all mapping points within one patient, resulting in a wide range of threshold values and various thresholds for different atrial segments depending on the locations of the mapping points. In both groups, there was a large inter-individual variability in the 5th percentile. We only used data of the patients without AF to determine a ‘threshold’ for identification of low-voltage areas, though structural remodelling is most likely also present in this population. The extent of remodelling is more pronounced in patients with AF, which is reflected by the lower 5th percentiles observed in the PAF group. However, the absolute voltage threshold for structural remodelling remains arbitrary, as we have no true healthy population undergoing cardiac surgery available.
Determinants of atrial voltage
UV is primarily determined by cardiac electrical activity of the tissue surrounding the recording electrode which decreases with distance. Areas of synchronous activation in the longitudinal axis of myocardial fibres result in fast wavefront propagation and large UV potentials.14 In addition, thicker cardiac muscle bundles will result in larger UV potentials when compared with small bundles. In case of areas with non-uniform anisotropy, activation becomes asynchronous. This will result in smaller UV potentials as smaller volumes of cardiac tissue are simultaneously activated. In particular, low-voltage fractionated potentials with multiple additional deflections are regarded as part of the arrhythmogenic substrate underlying AF.16 We demonstrated that UV decreases when the number of additional deflections increases. It is generally assumed that low amplitude, fractionated potentials reflect critical regions of slow conduction or conduction block.18 Moreover, we demonstrated that UV is lower in areas of slowed conduction or conduction block, which might indicate areas of fibrotic tissue. However, even in the areas of conduction block, not all recorded potentials were fractionated, low-amplitude potentials and there was therefore no generally clear relation between UV and CV. In a previous study, we demonstrated that UV of single potentials are mainly determined by their relative R- and S-wave morphology, which could provide additional information on CV and wavefront propagation.19 Consequently, low-voltage potentials could also be explained by asymmetry of the relative R- and S-wave amplitudes. It is for these reasons that (low) UV alone does not automatically indicate ‘diseased’ atrial tissue and therefore an absolute voltage threshold for structural remodelling remains arbitrary.
Regional differences in epicardial voltage
Several studies have described differences in voltages between various atrial regions and regional differences between PAF and persistent AF patients.7,8,20 We did not find regional differences in median voltages in patients without AF. However, as demonstrated by our voltage fingerprints, there were considerable differences in voltage distributions throughout the atria in all patients.
Given that voltage is affected by atrial wall thickness and that wall thickness varies throughout the atria, it is likely that some of these differences are explained by variations in wall thickness. Nevertheless, other factors such as external pressing with the electrode array and atrial walls stress may also influence the recorded voltages.
Structural remodelling
MVD patients undergoing cardiac surgery—even without a history of AF—usually have advanced structurally remodelled atria due to altered haemodynamics and therefore MVD is a well-known risk factor for developing AF.21–23 Extensive areas of low-voltage potentials are therefore also present in MVD patients without history of AF. In addition, AF itself also causes electrical remodelling, thereby increasing the arrhythmogenic substrate. While these changes may be a consequence of AF, it could also be a result of primary structural abnormalities caused by MVD. In addition, in patients with MVD it has been demonstrated that there are electrophysiological differences between and within both the LA and RA. Based on these observations, it was suggested that the structural changes responsible for initiating and maintaining AF could be diffusely located and different to patients with lone AF.23
A prior study in MVD patients with AF suggested that the posterior wall may be especially rich in fibrotic tissue compared with the LA appendage.24 In addition, patients with MVD with enlarged LA dimensions—resulting in elevated atrial wall stress—have an increased risk of developing AF.25 Interestingly, in our population, there were no differences in voltages obtained from the LA and PVA between the no AF and PAF group. However, more fractionated potentials were found in these areas in patients with PAF. As fractionation represents asynchronous activation caused by, e.g. fibrotic tissue, this could also be indicative of an increased deposition of fibrotic tissue in these areas.16 This is supported by a study of Boldt et al.26 who found an increased expression of fibrosis in the left atrial tissue of patients with MVD.
Multiple earlier mapping studies found clear correlations between the presence of low-voltage areas and the development of AF.2–4 In our study, low-voltage areas were found in all patients, though lower UVs and more low-voltage areas were found in the PAF group at BB. In addition, we could not find any predilection site for low-voltage areas in both of our groups, though significant inter-individual differences were found in UV and low-voltage areas. Besides, earlier studies found more conduction disorders at BB in patients with valvular heart disease, possibly relating to the increased amount of low-voltage areas and lower epicardial voltage at this region.27,28 These observations further support the concept that structural remodelling associated with AF development is diffusely located in the atria in this patient population.
Clinical implications
MVD patients frequently undergo cardiac surgery and concomitant arrhythmia surgery is performed when AF is present. In these patients, next to PV isolation, epicardial mapping during surgery could provide additional information on the arrhythmogenic substrate as potential target sites for ablation. However, though the extend of remodelling is more pronounced in patients with AF, the absolute voltage threshold applied in this study for structurally remodelled atria does not permit to clearly separate patients for whom those areas may be suitable target sites for ablation. Therefore, low-voltage areas during SR should carefully be used as target sites for (surgical) ablative therapy in this patient population.
In addition, large intra- and inter-individual variation in potential voltages found in our study population highlights the requirement of an individualized, patient-tailored diagnosis and therapy of the arrhythmogenic substrate in patients with MVD and AF. It is likely that due to increased non-uniform anisotropic properties of atrial myocardium in MVD patients, UVs alter when the direction of the activation wavefront, during, e.g. atrial extrasystolic beats and tachyarrhythmias, changes. Therefore, the next step is to examine voltage maps during tachyarrhythmias such as AF and to compare them with SR voltage maps to decode electrical conduction properties and possible additional frequency- and direction-dependent conduction disorders.
Study limitations
Most patients with AF in our study had PAF instead of (longstanding) persistent AF. Electrical and structural remodelling in these patients is considered to be less extensive, therefore more differences in UV are expected with increasing AF persistence. In addition, as MVD patients undergoing cardiac surgery—even without a history of AF—usually have advanced structurally remodelled atria, this population is not representative of all patients undergoing AF ablation.
The recorded UV might also be influenced by variable contact of the electrode array with the cardiac tissue, which could have introduced a bias in the data. However, this bias is considered to be minimal as confirmation of good contact of the electrode array with cardiac tissue was an important step in the mapping procedure. Besides, loss of contact could be easily recognized during post processing of the data. In addition, the presence of epicardial fat could have influenced our results as earlier studies showed that the presence of thick fat is associated with attenuated EGM voltages.29 Though these observations are based on bipolar EGMs and we did not experience any large effects of visually present epicardial fat, we cannot ascertain that the presence of epicardial fat has influenced our results.
Whether general anaesthesia and intraoperative drugs influence conduction is yet to be investigated; however, a standard anaesthetic protocol was used for all patients and SR was confirmed during all mapping procedures. Possible effects of anaesthesia would therefore be equally dispersed among the patient population. In addition, high‐resolution mapping of the interatrial septum could not be performed with our closed beating heart approach.
Conclusion
UV mapping at high-resolution scale in patients with MVD, demonstrated marked inter-individual and regional variation with advanced atrial remodelling. Despite highly individualized patterns, even in SR, potential voltages at BB were lower in MVD patients with PAF compared with those without AF. Though there were no predilection sites for low voltages to occur, low-voltage areas were even present in MVD patients without a history of AF. In addition, an increased number of low-voltage potentials were found at BB in MVD patients with PAF. Both considerable intra- and inter-individual variation in potential voltages were found in our study population, which underlines the importance of an individualized electrical signal profile which can be used to characterize complex conduction disorders and to develop patient-tailored diagnoses and therapy.
Acknowledgements
The authors would like to kindly thank J.A. Bekkers, MD, PhD, C. Kik, MD, W.J. van Leeuwen, MD, F.B.S. Oei, MD, PhD, P.C. van de Woestijne, MD, Y.J.H.J. Taverne, MD, PhD, A. Yaksh, MD, PhD, C.A. Houck, MD, C.P. Teuwen, MD, E.A.H. Lanters, MD, E.M.J.P. Mouws, MD, PhD, J.M.E. van der Does, MD, C.S. Serban, DVM, R.K. Kharbanda, MD, L.N. van Staveren, MD, A. Heida, MD, W.F.B. van der Does, MD, M.C. Roos-Serote, PhD, for their contribution to this work.
Funding
N.M.S.G. was supported by funding grants from CVON-AFFIP [grant number 914728], NWO-Vidi [grant number 91717339], Biosense Webster USA [ICD 783454], and Medical Delta.
Conflict of interest: none declared.
Data availability
The data underlying this article will be shared on reasonable request to the corresponding author.
