


Abstract
A pre-operative non-invasive identification of the site of origin (SOO) of outflow tract ventricular arrhythmias (OTVAs) is important to properly plan radiofrequency ablation procedures. Although some algorithms based on electrocardiograms (ECGs) have been developed to predict left vs. right ventricular origins, their accuracy is still limited, especially in complex anatomies. The aim of this work is to use patient-specific electrophysiological simulations of the heart to predict the SOO in OTVA patients.
An in silico pace-mapping procedure was designed and used on 11 heart geometries, generating for each case simulated ECGs from 12 clinically plausible SOO. Subsequently, the simulated ECGs were compared with patient ECG data obtained during the clinical tachycardia using the 12-lead correlation coefficient (12-lead ρ). Left ventricle (LV) vs. right ventricle (RV) SOO was estimated by computing the LV/RV ratio for each patient, obtained by dividing the average 12-lead ρ value of the LV- and RV-SOO simulated ECGs, respectively. Simulated ECGs that had virtual sites close to the ablation points that stopped the arrhythmia presented higher correlation coefficients. The LV/RV ratio correctly predicted LV vs. RV SOO in 10/11 cases; 1.07 vs. 0.93 P < 0.05 for 12-lead ρ.
The obtained results demonstrate the potential of the developed in silico pace-mapping technique to complement standard ECG for the pre-operative planning of complex ventricular arrhythmias.
Introduction
The estimation of the site of origin (SOO) location in outflow tract ventricular arrhythmias (OTVAs) is an important step before radiofrequency ablation (RFA) procedures since it affects the planning and timing of the ablation, the risk evaluation, and the catheter approach. The prediction of the SOO is usually made pre-operatively from the visual inspection of the 12-lead electrocardiogram, whose different patterns have information about the arrhythmic exit site and the plausible SOO.1–3 During RFA intervention, the SOO is normally identified analysing the local activation maps obtained from electroanatomical mapping (EAM) data or by a pace-mapping technique. Right ventricular outflow tract (RVOT) origin has been reported to be the most common site (∼75%),1 although recent studies suggest that left ventricular outflow tract (LVOT) has an incidence of nearly 50% of the OTVA cases.4 In addition, epicardial SOO are 15% of the LVOT arrhythmias and generally come from the left ventricular summit.2 Other anatomical structures where LVOT arrhythmias can emerge are the distal coronary sinus, the aortic root or the aorto-mitral continuity (AMC).3 Note that the earliest activated point detected in an electroanatomical map would correspond to the arrhythmic exit site, and not the so-called SOO. However, in this work, we adopted the broadly used term SOO, which in our study exactly matches the arrhythmic exit site.
Patient-specific electrophysiological models realistically simulate important electrocardiogram (ECG) features in outflow tract ventricular arrhythmias such as the QRS transition, lead I polarity, or notching.
Classification between LV and RV site of origin (SOO) can be performed by comparing the simulated and real patient 12-lead ECG.
The in silico pace-mapping technique presented here can be used to support electrophysiologists in finding the SOO pre-operatively.
We hypothesized that personalized multiscale electrophysiological simulations of the heart could provide added value to the electrophysiologists for the pre-operative non-invasive localization of the SOO in OTVA patients. Personalized electrophysiological simulations have already shown promising results to support clinical decision-making in cardiology.11 In order to reach clinical use, simulation of the ECG arises as a fundamental step since it is the most common non-invasive signal used in clinical practice. Although several works have been focused on performing electrophysiological simulations, only a small portion of them have tried to simulate and compare patient-specific ECGs.12,13 Moreover, simulations of cardiomyopathies where right ventricle (RV) or OT structures have a crucial role are scarce due to the difficulties to get good anatomical and functional data in these regions, including cardiomyocyte orientation and EAM characterization.
Therefore, we propose a modelling pipeline based on 3D anatomical models of the heart personalized from patient’s computed tomography (CT) images where regional tissue characterization (cardiomyocyte orientation and tissue conductivity) is based on population data. Multiscale biophysical models of cardiac electrophysiology can be used to simulate the electrical activity from cell to body scale obtaining the in silico patient ECG. Using that approach we have performed a retrospective computational study on 11 patients where we have virtually performed a pace-mapping procedure, by simulating surface ECGs from most frequent ectopic focus location and have compared the QRS of these ECGs with the patient clinical ECG to identify the most likely SOO.
Methods
General overview
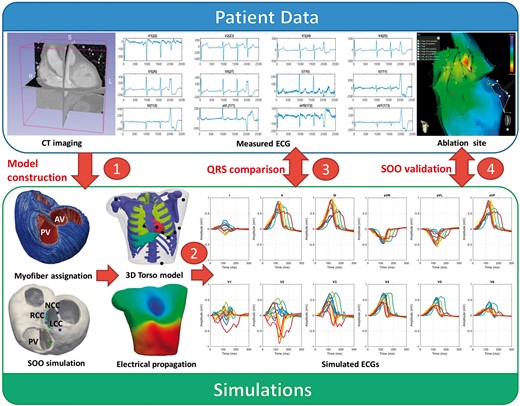
The methodology to simulate the in silico pace-mapping process is illustrated in Figure 1. Medical data from 11 OTVA patients obtained pre- and post-ablation were used to construct the models in which electrophysiology simulations were performed. Firstly, patient-specific biventricular geometrical models were built from segmentations of CT stacks. Next, the 3D models were meshed, and cardiomyocyte orientation was assigned using the outflow tract rule-based method (OT-RBM),14 a mathematical model that reproduces cardiomyocyte orientation in the ventricles and OTs observed in histological data. A total of 12 electrophysiological simulations were carried out in each geometry based on the most frequent ectopic SOO according to clinical reports.15 Simulated electrical activity was propagated from the biventricular model to the torso surface, where the simulated ECG was computed. Finally, several indices were calculated to quantify the accuracy of the prediction when comparing with ablation sites.
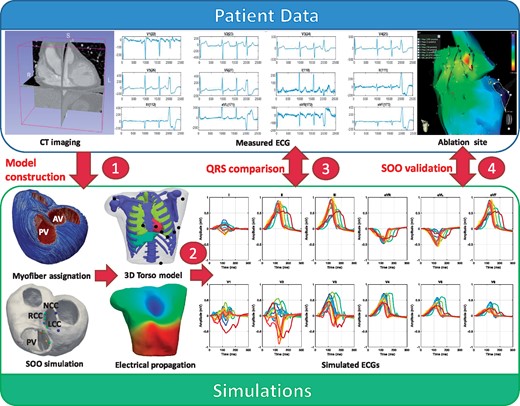
Scheme of the proposed methodology: (1) patient-specific geometries were created from medical CT scans. Cardiomyocyte orientation was assigned using the OT-RBM algorithm14; (2) electrophysiological simulations were run from different SOO and ECGs were calculated after the propagation to the torso surface; (3) simulated ECGs were compared with the patient ECG in order to find the most similar pattern and therefore the best candidate for the SOO; (4) suggested SOO were then validated against the ablation site. AV, aortic valve; CT, computed tomography; ECG, electrocardiogram; LCC, left coronary cusp; NCC, non-coronary cusp; PV, pulmonary valve; RCC, right coronary cusp; SOO, sites of origin.
Clinical data
Patient-specific biventricular geometries were reconstructed from the processing of CT images that corresponded to 11 patients with idiopathic OTVAs submitted for ablation procedure at Hospital Clínic de Barcelona. A multidetector CT ECG-gated study was performed on a 128 × 2-slice CT scanner (Somatom Definition Flash, Siemens Healthcare, Erlangen, Germany). Images were acquired during an inspiration breath-hold using a retrospective ECG-gating technique with tube current modulation set between 50% and 100% of the cardiac cycle. The isotropic spatial resolution was 0.4 × 0.4 × 0.4 mm.
All patients underwent an RFA procedure. The study was approved by the local ethics committee and written informed consent was obtained from all participants. Electroanatomical mapping was acquired by CARTO 3 navigation system (Biosense Webster, Diamond Bar, CA, USA) with a 3.5 mm irrigated tip catheter (NaviStar, Biosense Webster). Anti-arrhythmic drugs and beta-blockers were discontinued for five half-lives prior to the procedure. No patient received isoproterenol during mapping. During the procedure, 12-lead surface ECG and intracardiac recordings were obtained and displayed by an electrophysiology data acquisition system (Bard LabSystem, CR Bard Inc., Lowell, MA, USA; or EP-Tracer, CardioTek, Maastricht, The Netherlands). Ablation was considered successful if the targeted OTVA was eliminated and it was non-inducible after isoproterenol infusion. The site where RFA application eliminated the OTVA was considered the SOO and was labelled and saved in the EAM data.
3D model construction
Biventricular geometries were generated from CT images as described in Supplementary material online, Appendix S1. Cardiomyocyte orientation, which determines the preferential electrical wave propagation, was included in the model using the OT-RBM methodology.14 This method creates detailed cardiomyocyte orientation in regions that play a key role in the OTVAs such as the outflow tracts, RV and the interventricular septum according to histological information. Conduction velocity along cardiomyocyte direction was 0.68 m/s and 0.26 m/s in transverse direction. More information can be found in Supplementary material online, Appendix S1.
A 3D torso model was used to simulate body surface potential maps (BSPMs) that represent the electrical activity at body scale after the propagation of the electrical wave originated in the heart. The torso mesh included the principal organs and anatomical structures, as can be seen in Figure 1. For each patient, the original heart in the torso model was replaced by the particular patient-specific heart.
Electrophysiological modelling and simulation experiments
A total of 12 simulations were performed in each of the 11 patient-specific geometries. Detailed information of the electrophysiological modelling and the simulation procedure can be found in Supplementary material online, Appendix S1. In each simulation, the origin of the ectopic focus was changed according to the most common SOO found in clinical studies.3,15 Outflow tract ventricular arrhythmias were first simulated at the organ level (biventricular model) from which resulting transmembrane potentials were used to calculate the BSPM and ECGs. A mesh node placed in the ectopic focus was stimulated, obtaining a 300 ms OTVA simulation of the ventricular depolarization. For each patient, seven and five ectopic foci had left and right ventricle SOO, respectively, as can be observed in Figure 2. The number and location of these points were chosen according to clinical observations.3,15 The seven LV-SOO (blue and green colours in Figure 2) were distributed as follows: two in the left coronary cusp (LCC), two in the right coronary cusp (RCC), one in the LCC–RCC commissure, one in the AMC, and one in the left ventricular summit, at the epicardium. The five RV-SOO (red, orange, and yellow colours in Figure 2) were distributed as follows: four in the septal side of the RV, including two in the posteroseptal RVOT, and two in the anteroseptal RVOT, as well as one in the free-wall. Points in the same region were placed in two different apicobasal levels; one just below the pulmonary or aortic valve, and the other at approximately 1 cm below the valves. In the end, a total of 132 simulations were carried out.
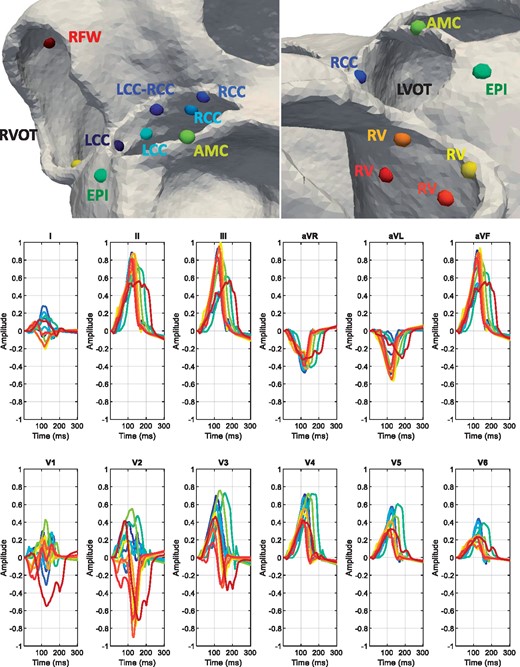
Top row: spheres show the 12 different locations used as SOO in the simulations on a patient geometry. Seven were LV-SOO (bluish and greenish colours): two in the LCC and two in the RCC (LCC and RCC, respectively), one in the LCC-RCC commissure, one in the AMC and one in the LV summit (at the epicardium, EPI). The five RV-SOO were distributed as follows: four in the septal side of the RV, including two close (orange and yellow colours) and two distant (red colours) from the pulmonary valve, as well as one in the free-wall (RFW). Second and third rows: simulated 12-lead electrocardiogram. Each signal colour matches with the colour of the point that represents the SOO. AMC, aorto-mitral continuity; EPI, epicardium; LCC, left coronary cusp; LVOT, left ventricular outflow tract; RCC, right coronary cusp; RFW, right-sided free wall; RV, right ventricle; RVOT, right ventricular outflow tract; SOO, site of origin.
Electrocardiograms were obtained by selecting the electrical potential of the closest torso mesh nodes to standard 12-lead ECG electrode location, as depicted in Figure 1. In addition, in order to include variability to the results and replicate possible lead misplacement and different heart-torso orientations, 13 different precordial lead configurations were used for each simulation scenario, slightly moving each electrode position between the different configurations within a range of 2 cm (see Supplementary material online, Figure S1.2). For visualization purposes, only the simulated ECGs obtained with the original lead configuration are represented in the figures. A 12-lead ECG with a duration of 300 ms was then obtained for each SOO (12 sites) and lead configuration (13) for each geometry (11 patients), resulting in a total of 1716 simulated 12-lead ECGs.
Metrics and experiments for the comparison of simulated electrocardiograms
Signal processing was carried out using the MATLAB software (MathWorks, Natick, MA, USA). For visualization purposes, all (simulated and patient-specific) 12-lead ECGs were normalized in amplitude between −1 and 1, which corresponded to the minimum or maximum values of the 12-lead ECGs, respectively. Prior to calculating the 12-lead ρ metric, QRS complexes were manually extracted for each lead of the real patient ECGs. Then, signals were aligned by maximizing the value of the cross-correlation between the real patient signal and the simulated ones. Next, the 12-lead ρ metric was calculated for each simulation case. Since our simulations were carried out using 13 different lead configurations, only the maximum 12-lead ρ score was chosen among the (13) possible ones in each case. We also derived a LV/RV ratio in order to determine the LVOT vs. RVOT origin in each patient: it was calculated by dividing the mean of the ρ values of all the LV-SOO simulations by the one corresponding to the RV-SOO simulations. An LV/RV ratio larger and smaller than 1 will indicate an LVOT and RVOT origins, respectively.
For validation purposes, the QRS complexes of the simulated 12-lead ECGs were initially qualitatively compared with patterns found in the literature for different SOO. We then used the correlation coefficient ρ to quantitatively compare the simulated and real ECG data. The LV/RV ratio was derived from the 156 calculated 12-lead ρ in each patient. Classification into LV or RV SOO (in silico-based SOO assignment to each patient) was performed using the LV/RV ratio, while the maximum 12-lead ECG ρ value was used for a more detailed location of the SOO. Alternative metrics such as the ratio of the maximum LV and RV 12-lead ρ or rankings according the maximum 12-lead ρ of each SOO were also studied for classification between LV and RV. The assigned simulation-based SOO label was finally evaluated against the clinically found SOO, which was determined during the RFA intervention. The EAMs acquired during the ablation treatment for each patient were used to analyse the local activation time (LAT) isochrones at different cardiac cycle time points and were visualized together with the simulated isochrones. Statistical comparisons were made using a Student’s t-test; a P-value ≤0.05 was considered statistically significant.
Results
Qualitative analysis of electrocardiogram features in simulated signals
Figure 3 shows the simulated ECG signals with the 12 different SOO of one of the studied patients (Patient 11), which will be used to visually analyse and identify the typical ECG features characteristic for each SOO according to literature.1–3 A complete set of simulated ECG signals for the 11 biventricular geometries studied in this work can be found in Supplementary material online, Appendix S2. The following observations were found for the different SOO:
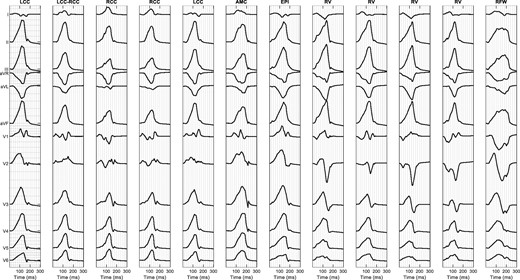
Twelve-lead simulated signals for the 12 different sites of origin of Patient 11. AMC, aorto-mitral continuity; EPI, epicardium; LCC, left coronary cusp; RCC, right coronary cusp; RFW, right-sided free wall; RV, right ventricle.
Left coronary cusp
The simulated ECG signals with LCC-SOO (Figure 3, Columns 1 and 5) present a multi-phasic (or notched M- or W-shaped) V1 lead, which is the main morphological ECG feature for this SOO; moreover, they have narrower QRS complexes than RCC-SOO (Columns 3 and 4 of the figure); other features properly simulated include a large R-wave amplitude, negative lead I, aVR and aVL leads as well as an early precordial transition in V1–V2.
Left coronary cusp–right coronary cusp
This type of SOO is usually characterized by a QS notch in the downward deflection in V1, which is not clearly observable in the simulated signals of Patient 11 (Figure 3, column 2); clearer examples of this ECG feature can be found in other studied cases (see Patient 2, Patient 4, Patient 5, Patient 9 in Supplementary material online, Appendix S2); on the other hand, it correctly shows a transition in V2–V3 and an Rs wave in lead I.
Right coronary cusp
As expected, the simulated ECG signals with RCC-SOO (Figure 3, Columns 3 and 4) have a precordial transition in V2–V3, slightly later than LCC-SOO in the same case; they also present a positive lead I, with large R waves in II and III, an rS pattern in V1 and a broad R-wave in V2, as it is common in this type of SOO.
Aorto-mitral continuity
An AMC-SOO is usually identified by a positive precordial concordance and no S wave in V6 as well as with a qR pattern V1. Those features appear in the simulated signal with this SOO (Figure 3, Column 6); however, we need to be cautious on any ECG feature from the V1–V2 leads in this particular case, since they present a non-negligible level of noise that make them difficult to interpret; finally, an R or Rs pattern is seen in lead I, as expected.
Epicardium/left ventricular summit
This type of SOO should present a V2 lead pattern break that cannot be appreciated in our simulations (column 7 in Figure 3); moreover, the expected rS/QS pattern is not found in V1; on the other hand, lead I is rightly negative, aVL is more negative than aVR and we can observe a larger R-wave in lead III compared to II.
Right ventricle, anteroseptal right ventricular outflow tract
As expected, the precordial transition in this RV-based SOO occurs in V3, later than in LV-based SOO; in addition, lead I for this particular SOO (Figure 3, columns 8 and 10) shows a negative S pattern and we can appreciate a larger Q-wave aVL/aVR ratio. A negative QS pattern in the aVR and positive R wave in the inferior leads are also obtained.
Right ventricle, posteroseptal right ventricular outflow tract
The main morphological ECG feature to identify a posteroseptal RVOT origin against an anteroseptal RVOT origin, is a positive R wave in lead I, which is correctly captured in our simulations (Figure 3, columns 9 and 11). In addition, posteroseptal RVOT ECG signals show a later precordial transition (≥V3).
Right ventricular free wall, anterior
Finally, the simulated ECG signals corresponding to this SOO, shown in the last column of Figure 3, present a late precordial transition in V4 and a wide QRS with inferior notching, as expected; inferior leads also have a smaller amplitude than in other RVOT septal origins. However, it is not obvious to confirm if our simulations can replicate some secondary ECG patterns, sometimes associated to this SOO, such as a negative lead I or an rS pattern in V1.
Qualitative comparison of simulated and measured electrophysiological data
We analysed the 156 simulated ECGs obtained for each patient, comparing them with the corresponding recorded ECG and EAM studies. Figure 4 shows a visual comparison of the simulated and recorded ECGs for a couple of patients with clinically confirmed LV-SOO (Patient 2) and RV-SOO (Patient 7) cases. Simulated ECG signals corresponding to RV-SOO and LV-SOO are uniformly coloured in red and blue, respectively, while the recorded ECG is represented as a green line. The visual inspection of recorded ECG data of Patient 2 in Figure 4 confirms the multi-phasic waveform in the V1 lead that is characteristic of a LCC-SOO. Simulations from LV-SOO (blue curves) also present negative and positive polarity curves in this lead when compared with RV-SOO signals that are predominantly negative. The recorded ECG data clearly shows a V3 transition. The obtained simulations also provided a precordial transition on LV SOO of V3 (blue colour), whereas RV-based ones (red colour) definitively changed polarity in V4. The equivalent analysis for Patient 7 (RV origin), also shown in Figure 4, confirms that the simulated ECG signals from the actual ventricular origin are more similar to the clinical ECGs than those from the other ventricle. For instance, a better matching of RV-SOO curves (in red) with real ECG (black curve) can clearly be seen in lead 1 (negative polarity) than with LV-SOO ones. Moreover, the clinical ECG data suggest a precordial transition in V4, while simulated LV-SOO curves (in blue) are already predominantly positive in V3; on the contrary, several simulated RV-SOO curves show a significant negative polarity in V3, suggesting a transition in V4. It can easily be appreciated a better matching of real data with RV-SOO curves (red colour), compared to LV-SOO ones (blue colour) in other leads such as V2.
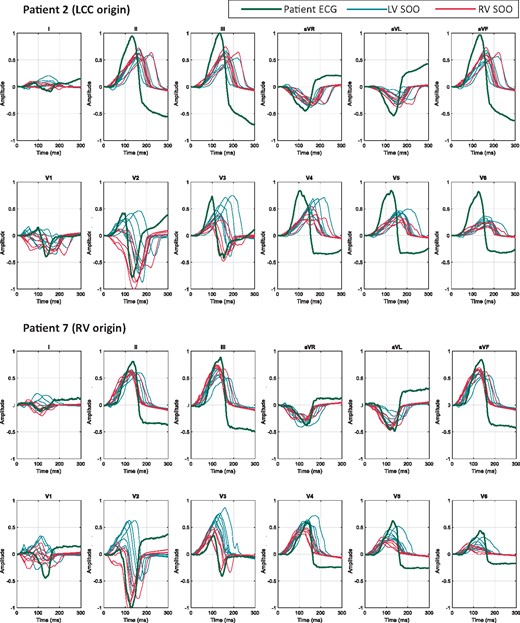
Comparison between the clinical patient 12-lead ECG (green) and the simulated ECGs: curves simulated with the origin in the LV are plotted in blue colour, whereas RV-SOO curves are in red. Two patients (Patient 2 and Patient 7) with different ablation sites are shown. Represented curves are not aligned temporally. ECG, electrocardiogram; LCC, left coronary cusp; LV, left ventricle; RV, right ventricle; SOO, site of origin.
The same conclusions can be drawn from the visual comparison of measured and simulated LAT isochronal maps. Figure 5 depicts the 60 ms and 120 ms isochronal maps (left and right column, respectively) that represent the electrical wave propagation in the biventricular geometry of Patient 2. The EAM acquired during the ablation treatment is located in the top panel A, whereas the equivalent simulations with a LV and RV-SOO are in the middle B and bottom C panels in Figure 5, respectively. Red and pink colours indicate the earliest and the latest activated points, respectively. It can be seen that LCC-SOO simulated isochrones (B) have closer morphological characteristics than RV-SOO ones (C). Notably, the latter shows a more anisotropic behaviour due to longitudinal cardiomyocyte orientation in the RV pointing to the outflow tract.
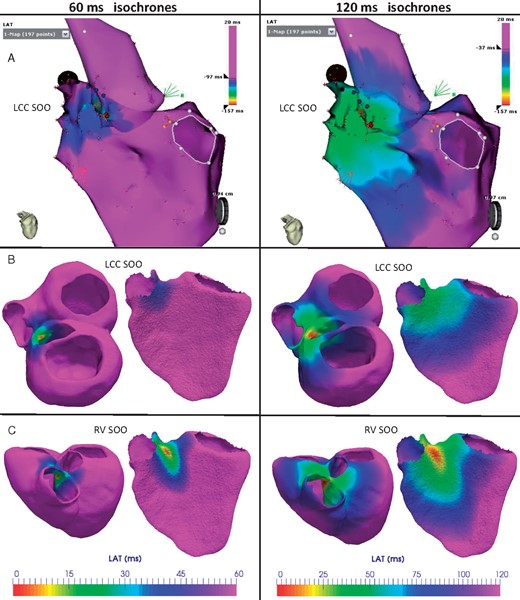
Comparison of measured and simulated LAT isochrones in Patient 2, who had a clinical LV-SOO with a successful ablation on the LCC. Red and pink colours indicate the earliest and the latest activated regions, respectively. First and second columns show the isochrones 60 ms and 120 ms after the trigger, respectively. (A) LATs measured with the electroanatomical map system during the ablation intervention. (B and C) Isochronal maps from electrophysiological simulations with a LCC and a RV-SOO, respectively. The simulated electrical patterns with a LV SOO (B) are more similar to the ones seen in the acquired data (A) than with a simulated RV SOO (C). LAT, local activation time; LCC, left coronary cusp; LV-SOO, left ventricle site or origin; RV-SOO, right ventricle site or origin; SOO, site of origin.
Prediction of the site of origin estimating the similarity between simulated and real electrocardiograms
The validation metrics presented in the Methods section help to quantify the accuracy of the developed modelling pipeline for the prediction of the ventricular origin of the ectopic foci in OTVAs. Table 1 shows the average and standard deviation of the 12-lead ρ between the clinical and the simulated QRS complexes of the ECGs for LV-SOO and RV-SOO (Sim LV SOO and Sim RV SOO in the table) for each patient. In addition, the LV/RV ratio that indicates the predicted ventricular origin (>1 for LV-SOO; RV-SOO otherwise) is also included. It can be seen in Table 1 that the modelling pipeline correctly predicted the ventricular origin in 10/11 cases (91%). Only Patient 6 was incorrectly labelled from the simulations as RV-SOO, which clinically a RCC-LV SOO was found. All patients presented significant statistical differences between the average 12-lead correlation coefficient for RV-SOO vs. LV-SOO (P < 0.05). In general, the LV/RV ratio of clinically-determined LV-SOO was higher than those originated from the RV: 1.07 vs. 0.93, respectively; P < 0.05.
Average of the 12-lead ρ between the clinical and the simulated QRS complexes
| Clinical RCC-LV SOO | ||||||
| P1 | P5 | P6 | P8 | P9 | ||
| Sim LV SOO | 0.83 ± 0.02 | 0.81 ± 0.04 | 0.78 ± 0.02 | 0.87 ± 0.07 | 0.91 ± 0.02 | |
| Sim RV SOO | 0.75 ± 0.02 | 0.71 ± 0.02 | 0.82 ± 0.04 | 0.84 ± 0.05 | 0.89 ± 0.02 | |
| LV/RV ratio | 1.11 | 1.15 | 0.95 | 1.03 | 1.03 | |
| Clinical LCC-LV SOO | Clinical RV SOO | |||||
| P2 | P3 | P4 | P7 | P10 | P11 | |
| Sim LV SOO | 0.88 ± 0.02 | 0.88 ± 0.03 | 0.86 ± 0.03 | 0.82 ± 0.04 | 0.80 ± 0.04 | 0.77 ± 0.05 |
| Sim RV SOO | 0.84 ± 0.04 | 0.85 ± 0.03 | 0.72 ± 0.03 | 0.88 ± 0.03 | 0.84 ± 0.04 | 0.85 ± 0.05 |
| LV/RV ratio | 1.05 | 1.04 | 1.19 | 0.93 | 0.96 | 0.91 |
Average and standard deviation of correlation coefficient (ρ) and left ventricle/right ventricle (LV/RV) ratios from the simulated ECGs for each patient (P). Sim LV-SOO and RV-SOO indicate LV and RV site of origin in the simulations, respectively. RCC-LV and LCC-LV indicate left and right coronary cusp ectopic foci, i.e. LV-SOO. Highest values for simulated SOO of each patient are marked in bold. Bold values for the simulated LV/RV ratio indicate agreement between the predicted SOO from simulations and the clinical SOO.
In order to achieve a more precise localization of the SOO within each ventricular outflow tract, not only the LV vs. RV origin, results of the maximum 12-lead ρ in each simulation were computed (see Table 2). The highest score per patient represent the most similar signal compared to the patient clinical ECG, which is marked in bold. Using a straightforward approach for classification based on the correlation coefficient values, i.e. labelling each case only based on the highest ρ value per SOO, the modelling pipeline correctly predicts the exact localization of the clinical SOO in 7/11 cases (64%). More specifically, the three RV-SOO cases were rightly predicted (100%), while labels for the LCC and RCC SOO were the most difficult to classify: the correct prediction of LCC-SOO occurred in only 1/3 cases (33%) and in 3/5 for RCC-SOO (60%). The results presented in Table 2 were also used to find new indexes for the classification between LV and RV SOO. A new ratio using the values of the Table 2 (maximum 12-lead ρ for each simulated SOO) is also able to classify the same 10 out of 11 patients between LV and RV SOO. Furthermore, a ranking of these 12-lead ρ is represented in Supplementary material online, Table S1.1 of Appendix S1, together with the geodesic distance between points. The evaluation of the results presented in Supplementary material online, Table S1.1 shows that at least two of the three highest 12-lead ρ are placed in the correct ventricle in each patient. A detailed analysis of the geodesic distance also reveals that some of the incorrect predictions corresponded to simulations with the SOO located very close to the SOO clinically determined from the EAM (Patients 1, 2, and 4). In addition, the ρ values of the clinical and wrongly predicted SOO were very similar, with differences lower than 0.02 in all incorrect cases.
Maximum 12-lead ρ for each simulated SOO
| P1 | P2 | P3 | P4 | P5 | P6 | P7 | P8 | P9 | P10 | P11 | |
|---|---|---|---|---|---|---|---|---|---|---|---|
| Clinical SOO | RCC | LCC | LCC | LCC | RCC | RCC | RV | RCC | RCC | RV | RV |
| Sim LCC | 0.91 | 0.92 | 0.94 | 0.93 | 0.85 | 0.81 | 0.83 | 0.85 | 0.90 | 0.87 | 0.82 |
| Sim LCC-RCC | 0.87 | 0.89 | 0.93 | 0.92 | 0.86 | 0.82 | 0.87 | 0.94 | 0.90 | 0.88 | 0.85 |
| Sim RCC | 0.86 | 0.87 | 0.88 | 0.91 | 0.79 | 0.82 | 0.88 | 0.94 | 0.91 | 0.91 | 0.88 |
| Sim RCC | 0.89 | 0.92 | 0.91 | 0.91 | 0.83 | 0.84 | 0.91 | 0.95 | 0.93 | 0.89 | 0.88 |
| Sim LCC | 0.90 | 0.92 | 0.93 | 0.93 | 0.85 | 0.84 | 0.88 | 0.88 | 0.92 | 0.87 | 0.82 |
| Sim AMC | 0.83 | 0.88 | 0.94 | 0.94 | 0.82 | 0.76 | 0.84 | 0.84 | 0.88 | 0.88 | 0.83 |
| Sim EPI | 0.85 | 0.91 | 0.92 | 0.90 | 0.83 | 0.79 | 0.81 | 0.85 | 0.84 | 0.84 | 0.81 |
| Sim RVA | 0.88 | 0.91 | 0.90 | 0.81 | 0.76 | 0.76 | 0.88 | 0.80 | 0.88 | 0.88 | 0.87 |
| Sim RVP | 0.82 | 0.81 | 0.90 | 0.85 | 0.73 | 0.81 | 0.88 | 0.86 | 0.89 | 0.89 | 0.88 |
| Sim RVA | 0.87 | 0.87 | 0.88 | 0.82 | 0.72 | 0.80 | 0.89 | 0.84 | 0.88 | 0.92 | 0.91 |
| Sim RVP | 0.84 | 0.83 | 0.88 | 0.85 | 0.73 | 0.85 | 0.92 | 0.89 | 0.88 | 0.90 | 0.93 |
| Sim RFW | 0.81 | 0.83 | 0.82 | 0.81 | 0.69 | 0.79 | 0.89 | 0.69 | 0.86 | 0.86 | 0.75 |
| Max ratio | 1.03 | 1.02 | 1.04 | 1.10 | 1.13 | 0.99 | 0.99 | 1.07 | 1.04 | 0.99 | 0.95 |
A 12-lead correlation coefficient (ρ) values calculated for each patient (P) and each one of the 12 simulated (Sim) sites of origin (SOO) when compared with the recorded ECG. There are seven LV-SOO located in the left and right coronary cusps (LCC and RCC, respectively) as well as one in their commissure (LCC-RCC), the aorto-mitral continuity (AMC), and in the LVOT epicardium. In addition, there are five RV-SOO: two in the antero- and posteroseptal RVOT (RVA and RVP, respectively) as well as one in the anterior right free wall (RWF). Highest coefficient ρ of each patient is marked in bold. Sim refers to simulation. Max ratio is the ratio between the maximum 12-lead ρ among all LV pacing sites of one patient to the respective maximum value among RV sites.
Discussion
We have presented a modelling pipeline for in silico determination of the SOO in OTVAs, with a good LV vs. RV SOO classification performance (91% in 11 cases). The methodology has potential to be used in the future, in combination with other computational techniques and indices, to support clinical decisions on this type of patients, in particular for pre-operative planning of RFA treatment.
The obtained simulation results, thoroughly described for some illustrative cases in the Results section and listed for all the studied patients in Supplementary material online, Appendix S2, are in close agreement with clinical descriptions reported in the literature1–3 for most scenarios. Performing multi-scale (cell to body scale) electrophysiological simulations on eleven different patient-specific biventricular geometries and with 12 different SOOs, covering the most frequent OTVA anatomical locations, has never been done before. It is difficult to obtain the necessary clinical data for model building and validation, as well as developing the appropriate tools and knowledge necessary to create realistic simulations. To get to this point, we needed to develop a modelling pipeline to process patient-specific data and generate the required finite-element meshes. More importantly, OTVA simulations were only possible due to the use of the OT-RBM method to include realistic cardiomyocyte orientation in the OTs and guiding the electrical wave propagation and thus, the ECG simulations. It has been shown that the specific OT cardiomyocyte orientation generated by the OT-RBM is needed in order to have simulated electrical patterns in the OTs closer to the ones measured with EAM data.14 In addition, some authors12,13,16 have confirmed good quality patient-specific geometry and cardiomyocyte orientation as key aspects for realistic electrophysiological and electrocardiogram simulations.
As seen in Supplementary material online, Appendix S2, the different QRS complexes of the simulated ECGs presented great variability due to the use of different patient geometries and SOOs. Most key morphological ECG features for each SOO were well captured in the simulations, especially the correct SOO-dependent precordial transition. Still, some complicated and less well-defined SOO such as the AMC and the left ventricular summit could be better simulated with our pipeline. Furthermore, in some cases certain leads presented artefacts preventing a reliable identification of ECG features (e.g. lead V1 in Patient 11, as it can be seen in Figure 3). However, even with the limitations of the modelling pipeline, the proposed evaluation metrics such as the correlation coefficient ρ showed a very good agreement between simulated and recorded ECG signals. As a consequence, all the different indexes evaluated in this work such as the LV/RV ratio proved its usefulness to determine the ventricular origin, with predictive values similar to state-of-the-art ECG-based algorithms available in the literature,1 most of them around 80–90% of sensitivity. However, in order to be properly compared with these algorithms, we need to apply the developed modelling pipeline to a larger database, since we have tested it in only 11 cases. If comparable, the proposed modelling pipeline should theoretically be more reproducible and robust to different interobserver criteria than the current ECG-based morphological features. The measurement of these features described by the ECG-based algorithms highly depends on the clinician ECG analysis skills. Although some characteristics of the QRS-complex are easy to calculate, other features calculation becomes subjective and requires long time expertise. In addition, some algorithms require numerous steps and can be severely affected by measuring errors during the index calculation. Drug treatment, preferential conduction of the depolarization wave or changes in heart morphology, among other factors, can also affect the recorded ECGs.1 Furthermore, the application of these algorithms is challenging in patients with paced rhythms or intra-ventricular conduction disorders,4 for which ECG morphology has been less analysed due to the limited amount of data available.
Accuracy results are also similar to the ones obtained using other alternative techniques such as non-invasive electrocardiographic imaging (ECGI)17,18 or by classifying computationally simulated ECGs of premature ventricular contractions.19 However, all these alternative techniques evaluate ectopic foci that are distributed along the whole biventricular geometry. In contrast, our methodology is focused only in the OTs, which are the areas of the heart, together with the septal wall, where most of these methods present a worse performance.17,18 In addition, recent studies reported poor precision in the localization of the SOO using some of these non-invasive techniques such as ECGI,20 which can hamper their application in OTVAs.
The use of a simple approach to classify the simulated ECG signals for specific SOO localization, beyond the ventricular origin, resulted in poor prediction results (64%) due to misclassifications in LV-based SOO. Nevertheless, when carefully analysed, one can observe that wrong SOO labels corresponded to neighbouring, anatomically close, structures, as it is shown by the geodesic distances of the Supplementary material online, Table S1.1. Also, using only a slightly more sophisticated classification algorithm, considering beyond the largest percentage value, would already correctly re-classify most of the found errors. Possible errors in the location of the recording leads or in clinically-defined labels due to uncertainty and current spatio-temporal resolution in electrophysiological measurements should also be considered. These errors could also be the cause of the misclassification of Patient 6, which presented the lowest set of 12-lead ρ values.
Limitations
One of the main limitations of the study is the lack of personalized tissue conductivities, which could mainly affect the QRS-width. Nonetheless, we do not expect additional substantial changes in the overall pattern of the ECG. A personalization of conductivity parameters will require a set of simulations that will increase substantially the computational cost, making the tool more difficult to translate to the clinics. One potential complementary alternative could be to use Eikonal-based models for performing fast simulations of cardiac electrophysiology that allow the fast estimation of the desired parameters but will not be able to reproduce complex physiological states.
Furthermore, more realistic simulated ECG signals could be obtained by including a personalized torso surface mesh or a more precise heart-torso registration, since it has been shown that torso shape can affect the simulated ECG.16 The simulation of the repolarization phase could also help in the classification of the simulated ECGs.
Conclusions
We have proposed a simulation pipeline mimicking the pace-mapping process. The pipeline was used retrospectively to predict the SOO of OTVA by simulating ECGs from different origins and comparing the QRS section with real ECG data. Simulated ECG reproduced most of the relevant ECG features in OTVA, according to literature. Best results were obtained for the classification of the RVOT vs. LVOT SOO, which reveals its potential to be used as a non-invasive tool to support clinical decisions prior to RFA interventions. As a future work, we expect to exploit the pipeline extending the current set of patients to a much larger population to be able to use more sophisticated classification algorithms including machine learning techniques for SOO prediction based on the combination of simulated and real ECG data. We also want to perform more simulations triggered from new SOO, especially from the epicardium, since in this work, we only considered one epicardial SOO for the tachycardias. These new datasets can help us to further validate the pipeline, and to improve the accuracy of the classifiers built based on the simulation data. The present study serves as an example of how computational simulations can be combined with clinical expertise to face and solve different electrophysiological challenges related to therapy planning and optimization.
Funding
This work was supported by the Spanish Ministry of Economy and Competitiveness under the Maria de Maeztu Units of Excellence Programme [MDM-2015-0502].
Conflict of interest: none declared.
Data availability
The datasets generated during the current study are available from the corresponding author on reasonable request.
References
1
2
3
4
5
6
7
8
9
10
11
12
13
14
15
16
17
18
19
20
