


Abstract
Study sex-differences in efficacy and safety of atrial fibrillation (AF) ablation.
We assessed first AF ablation outcomes on continuous anticoagulation in 633 patients [209 (33%) women and 424 (67%) men] in a pre-specified subgroup analysis of the AXAFA-AFNET 5 trial. We compared the primary outcome (death, stroke or transient ischaemic attack, or major bleeding) and secondary outcomes [change in quality of life (QoL) and cognitive function] 3 months after ablation. Women were older (66 vs. 63 years, P < 0.001), more often symptomatic, had lower QoL and a longer history of AF. No sex differences in ablation procedure were found. Women stayed in hospital longer than men (2.1 ± 2.3 vs. 1.6 ± 1.3 days, P = 0.004). The primary outcome occurred in 19 (9.1%) women and 26 (6.1%) men, P = 0.19. Women experienced more bleeding events requiring medical attention (5.7% vs. 2.1%, P = 0.03), while rates of tamponade (1.0% vs. 1.2%) or intracranial haemorrhage (0.5% vs. 0%) did not differ. Improvement in QoL after ablation was similar between the sexes [12-item Short Form Health Survey (SF-12) physical 5.1% and 5.9%, P = 0.26; and SF-12 mental 3.7% and 1.6%, P = 0.17]. At baseline, mild cognitive impairment according to the Montreal Cognitive Assessment (MoCA) was present in 65 (32%) women and 123 (30%) men and declined to 23% for both sexes at end of follow-up.
Women and men experience similar improvement in QoL and MoCA score after AF ablation on continuous anticoagulation. Longer hospital stay, a trend towards more nuisance bleeds, and a lower overall QoL in women were the main differences observed.
In this pre-specified subanalysis of the contemporary AXAFA-AFNET 5 trial, no sex differences were observed in the outcome of first-time atrial fibrillation (AF) ablation under continuous anticoagulation, with the exception of a trend towards more nuisance [Bleeding Academic Research Consortium (BARC) 2] bleedings and a longer time spent in hospital for the procedure.
Importantly, rates of tamponade (1.0% in women vs. 1.2% in men), intracranial haemorrhage (0.5% in women vs. 0% in men), or AF recurrence 3 months after ablation (34% in women vs. 28% in men) did not differ.
Quality of life (QoL) and Montreal Cognitive Assessment test results improved in a similar fashion in both sexes, although overall QoL remained lower in women than in men.
The fact that women can achieve similar results as men is an important reason not to withhold this therapy from women. The barriers, as well as facilitators, of catheter ablation in women deserve more attention as offering catheter ablation to more women holds an opportunity to positively affect outcomes.
Introduction
Catheter ablation has become a routine procedure in patients with atrial fibrillation (AF) to improve symptoms and quality of life (QoL) by reducing the arrhythmia burden. Since women experience more AF-related symptoms than men and report a lower quality in AF, they have potentially the most to gain from a successful ablation.1 However, women are less likely to receive catheter ablation and in the last 10 years the proportion of women undergoing AF ablation has not increased in the similar manner as in men.2–4 Compared with men, women who undergo AF ablation are generally 4–6 years older, seem to experience more AF recurrences, and appear to be at greater risk of having ablation-related complications.2,3,5 In several clinical scoring systems including procedural failure6 or procedure-related complications,7 female sex is one of the predictors, and in particular, vascular injury or cardiac tamponade after catheter ablation seem to occur more often in women.8 However, several other long-term observational studies found no sex difference in outcome or complications after ablation, suggesting selection bias in earlier cohorts.9,10 Furthermore, female sex was not found to be a predictor of AF recurrence in any of the 23 studies included in a systematic review of AF recurrence predictors after ablation.11 Little is known about the safety of AF ablation on continuous anticoagulation with regard to sex.
There is a lack of sex-specific analyses of large, prospective, contemporary AF ablation data sets with well-structured patient-, procedure-, and outcome variables. We set out to study sex-related differences in catheter ablation procedure, outcome, QoL, and cognitive function in a predefined substudy of all patients included in The Anticoagulation using the direct factor Xa inhibitor apixaban during Atrial Fibrillation catheter Ablation: Comparison to vitamin K antagonist therapy (AXAFA-AFNET 5) trial.12
Methods
The AXAFA-AFNET 5 study was a prospective, multicentre, 1:1 randomized, blinded outcome assessment study that compared continuous therapy of the non-vitamin K antagonist apixaban therapy to vitamin K antagonist (VKA) therapy in patients undergoing first AF ablation. All patients had symptomatic non-valvular AF, a clinical indication for catheter ablation on continuous anticoagulant therapy, and at least one established stroke risk factor [age ≥ 75 years, symptomatic heart failure, hypertension, diabetes mellitus, or prior stroke or transient ischaemic attack (TIA)]. Full inclusion and exclusion criteria of the AXAFA-AFNET 5 trial have been previously published.12
Patients randomized to apixaban received 5 mg twice daily, which was continued during the ablation procedure without interruption. Dose adjustment occurred if two or more of the following patient characteristics were present: age ≥80 years, weight ≤60 kg, or serum creatinine level ≥1.5 mg/dL (133 µmol/L). Patients randomized to VKA were treated according to site-specific anticoagulation therapy routine (warfarin, phenprocoumon, or acenocoumarol). Patients could undergo ablation after at least 30 days of continuous anticoagulation which was defined as having taken all but one dose, based on pill count, in the apixaban group and at least three INR measurements prior to ablation, with the last INR before ablation being ≥1.8, in patients receiving VKA therapy. Ablation could be performed earlier if atrial thrombi were excluded by transoesopagheal echocardiography and patients had at least two adjacent apixaban doses, or an INR ≥1.8, before ablation. The ablation procedure followed current guidelines, could be either radiofrequency ablation or cryoballoon ablation, and was conducted according to local practice. Throughout the ablation procedure an activated clotting time (ACT) >300 s was targeted. Directly after ablation a mandatory echocardiogram was performed to detect pericardial effusion.
The trial was conducted in 48 sites in Europe and North America and sponsored by AFNET (www.kompetenznetz-vorhofflimmern.de). All adverse events were adjudicated by an independent endpoint review committee blinded to study group and INR values. The study was conducted in accordance with the declaration of Helsinki and the International Conference on Harmonization Good Clinical Practice Guidelines (ICH-GCP). The ethical review board of all study centres approved the study protocol. All patients provided written informed consent before inclusion.
Study population
The analysis population included all patients from the AXAFA-AFNET 5 trial population who were randomized and underwent catheter ablation [i.e. modified intention-to-treat (mITT) population, Figure 1].
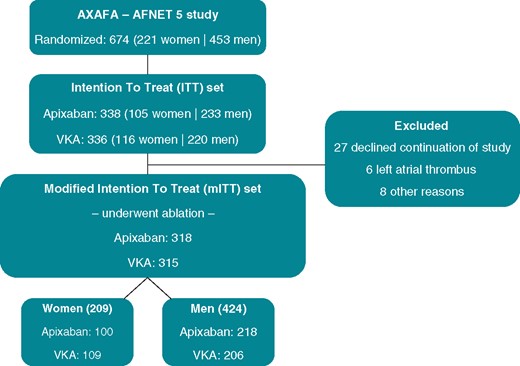
Flowchart of the AXAFA-AFNET 5 study. The current analysis focused on the patients who underwent ablation, the mITT set. mITT, modified intention to treat; VKA, vitamin K antagonist.
Study outcomes and measures
Primary outcome was the composite of all-cause death, stroke or TIA, or major bleeding [defined as Bleeding Academic Research Consortium score,13 developed to capture peri-interventional bleeding complications (BARC) ≥ 2] measured from randomization until the 3-month follow-up visit. Pre-specified secondary outcomes of the AXAFA-AFNET 5 trial included changes in QoL, cognitive function, prevalence and number of magnetic resonance imaging (MRI)-detected acute brain lesions, and nights spent in hospital after the index ablation.
At baseline patient characteristics, symptoms [assessed using the modified European Heart Rhythm Association (mEHRA) score], QoL [assessed using the 12-item Short Form Health Survey (SF-12), the Karnofsky Performance Status Scale, and Euro-QoL 5-Dimensional questionnaire (EQ-5D)], and cognitive function [assessed by the Montreal Cognitive Assessment (MoCA) test] were collected. The SF-12 survey consists of multiple choice questions that range in a stepwise fashion from limited a lot/all the time to not limited at all/none of the time. The individual items are transformed to a physical and mental health score ranging from 0 to 100, with lower scores representing a lower QoL. The Karnofsky scale (ranging from 0 to 100) describes global function status with scores from 0 to 40 implying inability to care for self; 50–70 inability to work, varying amount of assistance needed; and 80–100 ability to carry on normal activity and to work. The EQ-5D score rates mobility, self-care, usual activities, pain/discomfort, and anxiety/depression on a three-level scale ranging from no problems to severe problems. The final index score, using the UK value set ranges from 0 to 1, with lower scores representing a lower QoL. The MoCA test contains items on orientation, attention, verbal memory, language, visuospatial function, and executive function. Scores range from 0 to 30, with a score of ≥26 being considered normal.12
Follow-up visits took place at the time of ablation and after 3 months. At the 3-month visit QoL and MoCA scores were reassessed. In addition, a 12-lead ECG and 24-h Holter were performed to detect AF recurrence after the blanking period as per consensus definition. Data on hospitalizations and nights spend in hospital after index ablation were collected. A subset of patients received a brain MRI 3–48 hours after the ablation to detect acute brain lesions. Magnetic resonance imaging sequences used were previously described.12
Statistical analyses
Descriptive statistics for continuous and categorical variables were summarized as means (standard deviations) and medians [25th (q1)–75th (q3) percentiles], and counts (percentages), respectively. Comparisons between continuous variables were performed using the Wilcoxon rank-sum test or two-sample t-test depending on normality; comparisons between nominal variables were performed using the Pearson’s χ2 test or Fisher’s exact test, depending on expected cell sizes. Changes in QoL (SF-12, Karnofsky scale, and EQ-5D) and MoCA scores from baseline to 3 months post-index ablation were assessed. Paired measurements in women and men were compared with the Wilcoxon matched pairs signed rank. The amount of QoL change between the sexes was compared with the Wilcoxon rank-sum test. A multivariable Cox proportional hazards model, controlling for the baseline risk factors of age, weight, type of AF, CHADS2VAS2c score, and randomization arm was conducted to assess differences in primary endpoint occurrence between the sexes. The Cox proportional hazards assumption was assessed by visually inspecting plots of Schoenfeld residuals against time, which showed no proportionality violation. Some variables had missing data; in case of incomplete data, the number of patients with available data is added to the tables. All analyses were two-sided and tested at the nominal 0.05 significance level. No adjustments were made for multiple comparisons. All statistical analyses were performed with IBM SPSS Statistics version 24 (IBM Corp., Armonk, NY, USA).
Results
Patient characteristics and atrial fibrillation complaints
From the 674 patients who were randomized in the AXAFA-AFNET 5 study, 633 patients underwent catheter ablation forming the mITT population (Figure 1). Women [n = 209 (33%)] were older (66 vs. 63 years, P < 0.001) and consequently had a higher CHA2DS2-VASc score (3.2 ± 1.1 vs. 2.1 ± 1.1, P < 0.001) compared with men [n = 424 (67%)] (Table 1). Other comorbidities were well-balanced between the sexes, with the exception of coronary artery disease that was more often present in men (5.3% vs. 15.6%, P < 0.001). The average number of risk factors was 2.9 ± 1.1 in women and men. Women more often had paroxysmal AF (64% vs. 55%), with a higher frequency of AF episodes, and more often experienced their first occurrence of AF symptoms >12 months before ablation (75% vs. 63%). The mEHRA score (IIb–IV) was higher in women than in men (Table 1). No relevant differences in concomitant medication use were observed.
Baseline characteristics ablation population
| All patients (N = 633) | Women (N = 209) | Men (N = 424) | P-value | |
|---|---|---|---|---|
| Clinical characteristicsa | ||||
| Age (years) | 64 (58–70) | 66 (60–72) | 63 (57–69) | <0.001 |
| Height (cm) | 175 (168–182) | 165 (161–170) | 180 (174–185) | <0.001 |
| Weight (kg) | 87 (77–99) | 77 (68–90) | 90 (82–103) | <0.001 |
| Body mass index (mg/kg2) | 28.3 (25.3–31.6) | 28.0 (24.9–32.7) | 28.4 (25.4–31.2) | 0.81 |
| Systolic blood pressure (mmHg) | 138 (125–150) | 140 (127–152) | 137 (124–150) | 0.15 |
| Diastolic blood pressure (mmHg) | 82 (76–90) | 83 (74–90) | 82 (76–90) | 0.884 |
| CHA2DS2-VASc score | 2 (2–3) | 3 (2–4) | 2 (1–3) | <0.001 |
| CHA2DS2-VASc score, mean (SD) | 2.4 (1.2) | 3.2 (1.1) | 2.1 (1.1) | <0.001 |
| Randomization, n (%) | 0.45 | |||
| Apixabanb | 318 (50.2) | 100 (47.8) | 218 (51.4) | |
| VKA | 315 (49.8) | 109 (52.2) | 206 (48.6) | |
| Medical history, n (%) | ||||
| Hypertension | 571 (90.2) | 186 (89.0) | 385 (90.8) | 0.48 |
| Diabetes mellitus | 76 (12.0) | 22 (10.5) | 54 (12.7) | 0.52 |
| Chronic obstructive lung disease | 39 (6.2) | 12 (5.7) | 27 (6.4) | 0.86 |
| Prior stroke or TIA | 47 (7.4) | 16 (7.7) | 31 (7.3) | 0.87 |
| Clinical history of major bleeding | 13 (2.1) | 4 (1.9) | 9 (2.1) | 0.99 |
| Coronary artery disease (history of myocardial infarction, percutaneous coronary intervention, or coronary artery bypass graft) | 77 (12.2) | 11 (5.3) | 66 (15.6) | <0.001 |
| Vascular disease (coronary artery disease, peripheral artery disease, or carotid disease) | 83 (13.1) | 13 (6.2) | 70 (16.5) | <0.001 |
| Heart failure | 212 (33.5) | 74 (35.4) | 138 (32.5) | 0.48 |
| NYHA I | 62 (9.8) | 15 (7.2) | 47 (11.1) | |
| NYHA II | 126 (19.9) | 50 (23.9) | 76 (17.9) | |
| NYHA III | 24 (3.8) | 9 (4.3) | 15 (3.5) | |
| NYHA IV | 0 | 0 | 0 | |
| Symptomatic (NYHA II–III) | 150 (23.7) | 59 (28.2) | 91 (21.5) | 0.07 |
| Valvular heart disease | 73 (11.5) | 22 (10.5) | 51 (12.0) | 0.69 |
| Mitral valve diseasec | 20 (3.2) | 6 (2.9) | 14 (3.3) | |
| Aortic valve diseasec | 6 (0.9) | 1 (0.5) | 5 (1.2) | |
| Number of risk factorsd | ||||
| Median (q1–q3) | 3 (2–4) | 3 (2–4) | 3 (2–4) | 0.76 |
| Mean (SD) | 2.9 (1.1) | 2.9 (1.1) | 2.9 (1.1) | 0.52 |
| Rhythm and complaints, n (%) | ||||
| AF pattern | 0.03 | |||
| Paroxysmal | 367 (58.0) | 134 (64.1) | 233 (55.0) | |
| Persistent or long-standing persist | 266 (42.0) | 75 (35.9) | 191 (45.0) | |
| Frequency of AFe | 0.01 | |||
| Occasional | 128/593 (21.6) | 34/203 (16.7) | 94/390 (24.1) | |
| Intermediate | 307/593 (51.8) | 109/203 (53.7) | 198/390 (50.8) | |
| Frequent | 158/593 (26.6) | 60/203 (29.6) | 98/390 (25.1) | |
| First occurrence of AF symptoms | 0.003 | |||
| No symptoms in the past | 40 (6.3) | 6 (2.9) | 34 (8.0) | |
| <12 months ago | 169 (26.7) | 46 (22.0) | 123 (29.0) | |
| >12 months ago | 424 (67.0) | 157 (75.1) | 267 (63.0) | |
| Modified EHRA scale | <0.001 | |||
| mEHRA I | 40 (6.3) | 6 (2.9) | 34 (8.0) | |
| mEHRA IIa | 164 (25.9) | 33 (15.8) | 131 (30.9) | |
| mEHRA IIb | 205 (32.4) | 76 (36.4) | 129 (30.4) | |
| mEHRA III | 208 (32.9) | 84 (40.2) | 124 (29.2) | |
| mEHRA IV | 16 (2.5) | 10 (4.8) | 6 (1.4) | |
| Concomitant medications, n (%) | ||||
| Class Ia/Ic antiarrhythmics: flecainide, propafenone, or quinidine | 143 (22.6) | 48 (23.0) | 95 (22.4) | 0.92 |
| Class III antiarrhythmics: amiodarone, dronedarone, or sotalol | 132 (20.9) | 41 (19.6) | 91 (21.5) | 0.68 |
| Beta-blockers | 451 (71.2) | 144 (68.9) | 307 (72.4) | 0.40 |
| ACE inhibitor or angiotensin receptor blocker | 388 (61.3) | 119 (56.9) | 269 (63.4) | 0.12 |
| Calcium channel antagonists | 147 (23.2) | 43 (20.6) | 104 (24.5) | 0.32 |
| Diuretics | 221 (34.9) | 79 (37.8) | 142 (33.5) | 0.29 |
| Antianginal medication | 2 (0.3) | 0 | 2 (0.5) | 0.99 |
| Antidiabetic medications | 63 (10.0) | 16 (7.7) | 47 (11.1) | 0.21 |
| Statins | 231 (36.5) | 65 (31.1) | 166 (39.2) | 0.053 |
ACE, angiotensin-converting enzyme; AF, atrial fibrillation; EHRA, European Heart Rhythm Association; NYHA, New York Heart Association; SD, standard deviation; TIA, transient ischaemic attack; VKA, vitamin K antagonist.
Values depicted as median (q1–q3) unless stated otherwise.
One woman received 2.5 mg twice daily, all other patients received 5 mg twice daily.
Defined as at least moderate (Grade II through IV).
Includes advanced age (≥65 years), overweight or obesity (BMI >25), vascular disease, previous stroke or TIA, hypertension, diabetes mellitus, chronic obstructive lung disease, heart failure, and at least moderate mitral insufficiency.
Number of patients with available information is given since some patients had missing values.
Index catheter ablation
Median time from randomization to ablation was similar in women and men (36 and 35 days, respectively). Heart rhythm at the start of ablation, type of ablation, ablation energy source, and procedure time did also not differ between the sexes (Table 2). Women and men received comparable continuous anticoagulation. Women stayed longer in hospital after ablation than men (2.1 ± 2.3 vs. 1.6 ± 1.3 days, P = 0.004).
Index ablation procedure information
| All patients (N = 633) | Women (N = 209) | Men (N = 424) | P-value | |
|---|---|---|---|---|
| Days from randomization to ablation | ||||
| Mean (SD) | 38.0 (27.3) | 37.6 (29.2) | 38.2 (26.4) | 0.78 |
| Median (q1–q3) | 35 (20–50) | 36 (14–53) | 35 (22–50) | 0.57 |
| INR prior to ablation in patients receiving VKA, mean (SD) | 2.2 (0.5) | 2.1 (0.3) | 2.2 (0.6) | 0.28 |
| All, or all but one, dose of apixaban before ablation in patients receiving apixaban, n (%) | 307/318 (97) | 98/100 (98) | 209/218 (96) | 0.52 |
| TOE prior to ablation, n (%) | 549 (86.7) | 181 (86.6) | 368 (86.8) | 0.99 |
| Abnormal blood parameters, n (%)a | ||||
| Red blood cell count | 65/618 (10.5) | 26/206 (12.6) | 39/412 (9.5) | 0.27 |
| White blood cell count | 50/622 (8.0) | 15/206 (7.3) | 35/416 (8.4) | 0.82 |
| Platelet count | 35/625 (5.6) | 8/207 (3.9) | 27/418 (6.5) | 0.37 |
| ALT | 75/612 (12.3) | 29/202 (14.4) | 46/410 (11.2) | 0.54 |
| AST | 59/582 (10.1) | 26/195 (13.3) | 33/387 (8.5) | 0.13 |
| Bilirubin | 38/595 (6.4) | 6/193 (3.1) | 32/402 (8.0) | 0.04 |
| Hb | 65/618 (10.5) | 26/206 (12.6) | 39/412 (9.5) | 0.23 |
| Rhythm at start of ablation, n (%) | 0.10 | |||
| Sinus rhythm | 434 (68.6) | 147 (70.3) | 287 (67.7) | |
| AF | 180 (28.4) | 59 (28.2) | 121 (28.5) | |
| AFL | 12 (1.9) | 0 | 12 (2.8) | |
| Pacing | 7 (1.1) | 3 (1.4) | 4 (0.9) | |
| Type of ablation, n (%) | 0.36 | |||
| PVI | 571 (90.2) | 192 (91.9) | 379 (89.4) | |
| PVI plus other ablation | 59 (9.3) | 17 (8.1) | 42 (9.9) | |
| Other ablation without PVI | 3 (0.5) | 0 | 3 (0.7) | |
| Ablation energy source, n (%) | 0.46 | |||
| Radiofrequency | 402 (63.5) | 126 (60.3) | 276 (65.1) | |
| Cryoablation | 186 (29.4) | 68 (32.5) | 118 (27.8) | |
| Other | 45 (7.1) | 15 (7.2) | 30 (7.1) | |
| Procedure duration (min), median (q1–q3) | 135 (110–175) | 134 (104–165) | 138 (110–180) | 0.06 |
| Vascular access complicationb | 3 (0.5) | 2 (1.0) | 1 (0.2) | 0.21 |
| Nights spent in hospital after ablation | ||||
| Median (q1–q3) | 1 (1–2) | 1 (1–2) | 1 (1–2) | 0.003 |
| Mean (SD) | 1.7 (1.7) | 2.1 (2.3) | 1.6 (1.3) | 0.004 |
AF, atrial fibrillation; AFL, atrial flutter; Hb, haemoglobin; PVI, pulmonary vein isolation; SD, standard deviation; TOE, transoesophageal echocardiography; VKA, vitamin K antagonist.
Number of patients with available information is given since some patients had missing values.
Defined as leading to prolongation of in-hospital stay or specific therapy such as surgery or supplementation of coagulant factors.
Primary outcome
The primary outcome (all-cause death, stroke or TIA, or BARC 2–5 bleeding) was observed in 19 (9.1%) women and 26 (6.1%) men, P = 0.19 (Table 3), with an adjusted hazard ratio of 1.5 (95% confidence interval 0.75–3.0; P = 0.25) for the primary endpoint in women compared with men (Figure 2). Vascular access complications requiring therapy did not differ between sexes, but BARC 2 bleeding events occurred more often in women than in men (5.7% vs. 2.1%). Other bleeding events, including thrombolysis in myocardial infarction (1.0% vs. 0.5%) and International Society on Thrombosis and Haemostasis (ISTH) (5.3% vs. 3.1%) major bleeding, cardiac tamponade (1.0% vs. 1.2%), death (0.5% vs. 0.2%), or stroke or TIA (0% vs. 0.5%) occurrence did not differ between the sexes (Table 3).
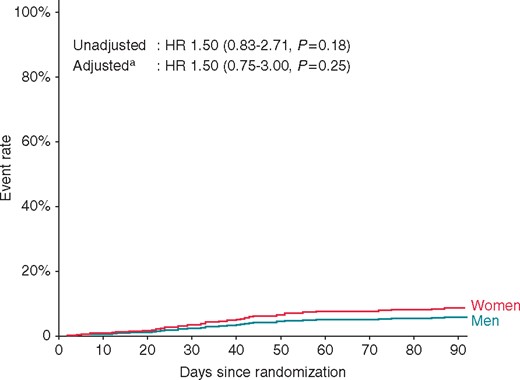
The cumulative occurrence of primary outcome events from randomization until 90 days follow-up is shown. aAdjusted for age, weight, type of AF, CHADS2 VAS2c score, and randomization arm. AF, atrial fibrillation; HR, hazard ratio.
Outcomes
| All patients (N = 633) | Women (N = 209) | Men (N = 424) | P-value | |
|---|---|---|---|---|
| Primary outcomea | ||||
| Primary endpoint: composite all-cause death, stroke, or major bleeding | 45 (7.1%) | 19 (9.1%) | 26 (6.1%) | 0.19 |
| Death | 2 (0.3%) | 1 (0.5%) | 1 (0.2%) | 0.61 |
| Stroke or TIA | 2 (0.3%) | 0 | 2 (0.5%) | 0.32 |
| Major bleeding (BARC 2–5) | 42 (6.6%) | 19 (9.1%) | 23 (5.4%) | 0.09 |
| BARC 2: bleeding requiring medical attention | 21 (3.3%) | 12 (5.7%) | 9 (2.1%) | 0.03 |
| BARC 3a: haemoglobin drop of 30 to <50 g/L or requiring transfusion | 9 (1.4%) | 3 (1.4%) | 6 (1.4%) | 0.98 |
| BARC 3b: haemoglobin drop >50 g/L, or requiring surgery or iv vasoactive agents, or cardiac tamponade | 11 (1.7%) | 3 (1.4%) | 8 (1.9%) | 0.68 |
| BARC 3c: intracranial haemorrhage | 1 (0.2%) | 1 (0.5%) | 0 | 0.15 |
| TIMI major bleeding (intracranial bleed or bleeding resulting in haemoglobin drop of ≥50 g/L, or bleeding resulting in death within 7 days) | 4 (0.6%) | 2 (1.0%) | 2 (0.5%) | 0.47 |
| ISTH major bleeding | 24 (3.8%) | 11 (5.3%) | 13 (3.1%) | 0.19 |
| Cardiac tamponade | 7 (1.1%) | 2 (1.0%) | 5 (1.2%) | 0.80 |
| Secondary outcomes | ||||
| Cardiovascular hospitalization, n (%) | 136 (21.5%) | 53 (25.4%) | 83 (19.6%) | 0.10 |
| Nights spent in hospital during follow-up, median (q1–q3) | 3 (2–6) n = 105 | 3 (2–7) n = 39 | 3 (1–5) n = 66 | 0.16 |
| Recurrent AF | 185/619 (29.9) | 71/207 (34.3) | 114/412 (27.7) | 0.09 |
| One time | 69 (11.1) | 27 (13.0) | 42 (10.2) | |
| Several times | 87 (14.1) | 35 (16.9) | 52 (12.6) | |
| Still in AF | 29 (4.7) | 9 (4.4) | 20 (4.9) |
Number of patients with available information is given when patients had missing values.
AF, atrial fibrillation; BARC, Bleeding Academic Research Consortium; ISTH, International Society on Thrombosis and Haemostasis; TIA, transient ischaemic attack; TIMI, thrombolysis in myocardial infarction bleeding classification.
Number of patients per group are shown. Some patients had more than one event.
Atrial fibrillation recurrence rate was not significantly different between women and men (34% vs. 28%, P = 0.09). Similarly, there was no cardiovascular hospitalization difference (25.4% vs. 19.6%, P = 0.10). Both women and men spend a median of three nights in hospital during follow-up (Table 3).
Secondary outcomes
Quality of life
Baseline QoL was lower in women than in men (Table 4). This was true for the SF-12 physical component, the SF-12 mental component, the Karnofsky scale, and the EQ-5D score. In women and men the SF-12 physical (5.1% vs. 5.9%) and mental (3.7% vs. 1.6%) component scores increased and the Karnofsky scale remained stable or improved (both interquartile range 0–12.5%) during follow-up. The amount of improvement did not differ statistically between the sexes. The EQ-5D score did not improve in women, contrary to men. At the end of follow-up women continued to have a lower QoL with lower SF-12 physical, SF-12 mental, and EQ-5D scores.
Quality of life
| All patients | Women | Men | P-valuea | |
|---|---|---|---|---|
| SF-12 physical component | ||||
| Baseline | 44.6 (37.7–51.4) n = 597 | 42.2 (36.3–48.6) n = 196 | 45.5 (39.2–52.9) n = 401 | <0.001 |
| Follow-up | 48.6 (42.0–54.2)n = 564 | 45.6 (39.8–51.3) n = 190 | 50.8 (43.2–55.0) n = 374 | <0.001 |
| Change | ||||
| Absolute, median (q1–q3) | 2.5 (−2.1 to 8.1) | 2.1 (−3.5 to 8.4) | 2.7 (−1.3 to 8.0) | 0.26 |
| Percentage, median (q1–q3) | 5.6 (−4.0 to 20) n = 547 | 5.1 (−6.9 to 20.9) n = 184 | 5.9 (−3.2 to 19.1) n = 363 | |
| P-valueb | <0.001 | 0.001 | <0.001 | |
| SF-12 mental component | ||||
| Baseline | 50.3 (42.7–57.5) n = 598 | 48.2 (40.6–55.2) n = 197 | 51.8 (43.6–58.0) n = 401 | <0.001 |
| Follow-up | 54.4 (46.0–58.6) n = 565 | 52.9 (45.2–57.5) n = 191 | 54.9 (47.3–59.7) n = 374 | 0.01 |
| Change | ||||
| Absolute, median (q1–q3) | 1.2 (−3.2 to 8.0) | 1.8 (−3.2 to 8.7) | 0.4 (−3.3 to 7.7) | 0.17 |
| Percentage, median (q1–q3) | 2.0 (−6.6 to 17.3) n = 548 | 3.7 (−6.1 to 19.1) n = 185 | 1.6 (−6.6 to 16.3) n = 363 | |
| P-valueb | <0.001 | <0.001 | 0.002 | |
| Karnofsky scale | ||||
| Baseline | 90 (80–90) n = 633 | 80 (80–90) n = 209 | 90 (80–90) n = 424 | 0.04 |
| Follow-up | 100 (90–100) n = 619 | 100 (90–100) n = 207 | 100 (90–100) n = 412 | 0.06 |
| Change | ||||
| Absolute, median (q1–q3) | 10 (0–10) | 0 (0–10) | 10 (0–10) | 0.60 |
| Percentage, median (q1–q3) | 11.1 (0.0–12.5)n = 619 | 0 (0–12.5) n = 207 | 11.1 (0.0–12–5) n = 412 | |
| P-valueb | <0.001 | <0.001 | <0.001 | |
| EQ-5D score | ||||
| Baseline | 0.80 (0.69–1.00) n = 598 | 0.76 (0.69–0.88) n = 198 | 0.80 (0.73–1.00) n = 400 | <0.001 |
| Follow-up | 0.85 (0.73–1.00) n = 565 | 0.80 (0.69–1.00) n = 188 | 0.85 (0.76–1.00) n = 377 | <0.001 |
| Change | ||||
| Absolute, median (q1–q3) | 0.00 (−0.04 to 0.14) | 0.00 (−0.07 to 0.12) | 0.00 (0.00 to 0.15) | 0.09 |
| Percentage, median (q1–q3) | (−5.0 to 17.6) n = 547 | 0.0 (−11.7 to 17.3) n = 183 | 0.0 (0.0 to 17.6) n = 364 | |
| P-valueb | <0.001 | 0.27 | <0.001 |
All values are depicted as median (q1–q3). In all cells, the number (n) of patients with available data is shown.
P-value women vs. men.
P-value between baseline and end of follow-up measurements.
EQ-5D, Euro-QoL 5-Dimensional questionnaire; SF-12, 12-item Short Form Health Survey.
Cognitive function and acute brain lesions
Baseline MoCA scores were similar in women and men, with a median of 27 points (Table 5). At the end of follow-up MoCA increased by a median of 1 point (ranging from −1 to 2 points) in women and 0 (ranging from −1 to 2 points) in men, P = 0.37. At least mild cognitive impairment according to the MoCA score was observed in 65 (32%) women and 123 (30%) men at baseline, this reduced to 23% for both sexes at end of follow-up. Three hundred and twenty-three patients had analysable MRIs. Acute brain lesions were detected in 30/106 (28%) of women and 54/217 (25%) of men, P = 0.56 (Table 6).
Cognitive function
| All patients | Women | Men | P-valuea | |
|---|---|---|---|---|
| MoCA score | ||||
| Baseline | 27 (25–29) n = 618 | 27 (24, 29) n = 206 | 27 (25, 29) n = 412 | 0.54 |
| Follow-up | 28 (26–29) n = 607 | 28 (26–29) n = 204 | 28 (26–29) n = 403 | 0.57 |
| Change | ||||
| Absolute, median (q1–q3) | 1 (−1 to 2) | 1 (−1 to 2) | 0 (−1 to 2) | 0.37 |
| Percentage, median (q1–q3) | 3.4 (−3.4 to 7.7) n = 597 | 3.4 (−3.3 to 8.2) n = 201 | 0 (−3.4 to 7.4) n = 396 | |
| P-valueb | <0.001 | <0.001 | <0.001 | |
| At least mild cognitive impairment (MoCA < 26) | ||||
| Baseline | 188 (30) n = 618 | 65 (32) n = 206 | 123 (30) n = 412 | 0.71 |
| Follow-up | 141 (23) n = 607 | 47 (23) n = 204 | 94 (23) n = 403 | 0.99 |
| P-value | <0.001 | <0.001 | <0.001 |
MoCA scores are depicted as median (q1–q3), mild cognitive impairment as number (percentage). In all cells, the number (n) of patients with available data is shown.
MoCA, the Montreal Cognitive Assessment.
P-value women vs. men.
P-value between baseline and end of follow-up measurements.
Acute brain lesions (MRI substudy)
| All patients (N = 323) | Women (N = 106) | Men (N = 217) | P-value | |
|---|---|---|---|---|
| No. of lesions observed, n (%) | 0.56 | |||
| No lesion | 239 (74.0) | 76 (71.7) | 163 (75.1) | |
| Exactly one lesion | 46 (14.2) | 14 (13.2) | 32 (14.7) | |
| Exactly two lesions | 21 (6.5) | 8 (7.5) | 13 (6.0) | |
| More than two lesions | 17 (5.3) | 8 (7.5) | 9 (4.1) |
MRI, magnetic resonance imaging.
Discussion
In this contemporary cohort of patients undergoing AF ablation on continuous anticoagulation, women were older than men, more often symptomatic, and with lower QoL at baseline. There was no difference between women and men in primary outcomes after AF ablation with a similar rate of adverse events, with the exception of a trend towards more nuisance (BARC 2) bleedings and a longer time spent in hospital for the procedure. Quality of life and MoCA test results improved in a similar fashion in both sexes, although overall QoL remained lower in women than in men.
Patient population
Catheter ablation is a mainstay in the treatment of AF, but currently, most patients receiving an ablation for AF are white men. Registry studies, as well as randomized controlled trials, show an underrepresentation of women, with only ∼20% to 40% females.2–4 This may represent under-treatment of women, who besides more AF-related symptoms are also less likely to successfully respond to pharmacological treatment and more often fail antiarrhythmic medication than men before receiving catheter ablation.1 Women who do receive an ablation tend to be older, have a longer duration of the arrhythmia, and more comorbidities including hypertension and valvular disease.5,10 The lower success rate of catheter ablation in women, as well as the higher complication rate, may be partially related to these high-risk features.1 Women included in AXAFA-AFNET 5 had a longer history of AF and were on average 3 years older but had a largely similar underlying risk factor burden. In the randomized FIRE AND ICE trial, and the German Ablation Registry women were on average 5–7 years older, had worse kidney function (FIRE AND ICE), and more often hypertensive heart disease (German Ablation Registry).3,4 Both these studies describe distinct sex-related outcomes in contrast to our observations. Whether observed sex differences are solely a reflection of older age with more risk factors in women, or dependent on sex differences in anatomy, physiological-, and pathophysiological mechanisms, remains incompletely understood.1
Catheter ablation procedure
No significant differences were observed in index catheter ablation procedure itself. The only difference was the observation that women had a prolonged hospital stay after index ablation of ∼0.5 day, an observation also reported in the FIRE AND ICE trial.4 Reasons remain elusive but may include more (atypical) symptoms after catheter ablation, in line with women’s higher symptom burden in general, or caution of the treating physician who may expect a more complicated course of the ablation procedure in women.1
Outcomes
BARC 2 type bleeding (bleeding events that required medical attention)13 occurred slightly more often in women. Vascular access complications that resulted in actual prolongation of in-hospital stay or specific therapy such as surgery or supplementation of coagulant factors were extremely rare and occurred in only two women and one man. Most studies describe a higher prevalence of non-fatal access complications in women.2,3,6 Reasons may include the older age at the time of ablation, sex-specific anatomical varieties of the groin vessels, or obesity, an associated risk factor for more complications.1 Almost all women included in AXAFA-AFNET 5 had body mass index within the range 25–30 kg/m2, however, the same was true for the men. Bleeding events requiring invasive treatment beyond medical attention (e.g. surgery or transfusion) did not differ between the sexes. Importantly, cardiac tamponade did not occur more often in women. In AXAFA-AFNET 5, the ablation approach was similar between the sexes, i.e. women did not receive more extensive ablations with additional ablation lines. Also, per protocol, ACT was closely monitored and targeted >300 ms during the ablation, which may have contributed to improved procedural safety. Furthermore, included sites in the AXAFA-AFNET 5 study had experienced personnel. The influence of poorer outcomes in low-volume centres might have therefore been prevented.8 Short-term AF recurrence did not differ between the sexes. Similar early success in both women and men was also observed in the FIRE AND ICE trial.4 Long-term efficacy, which was not studied in AXAFA-AFNET 5, is often lower in women and is heavily influenced by a longer history of AF, as well as non-paroxysmal AF.14
Quality of life
QoL was lower in women at baseline and remained lower at follow-up. This lower QoL in women was frequently observed and reflects more symptoms, a reduced capacity to carry on normal activity and work and is associated with more concerns regarding treatment approaches.15 However, with the exception of the EQ-5D score, the improvement in QoL was similar, implying that benefits of ablation are largely the same in women in men, making it a more promising strategy than antiarrhythmic drugs alone in improving patient’s life.16,17 Advancing age is associated with more concerns and anxiety regarding personal health and a negative impact on overall health status status.16,17 The lack of improvement in the EQ-5D score may reflect the higher median age of women in our cohort. Incorporation of health-related questionnaires may show which patients could potentially benefit the most from catheter ablation and may be used as a means of minimizing sex differences in management strategies.15
Cognitive function and magnetic resonance imaging-detected acute brain lesions
Atrial fibrillation is associated with a ∼1- to 3-fold increased risk of cognitive impairment and dementia.18 Especially, vascular risk factors, including diabetes mellitus and stroke, are strongly associated with cognitive impairment and a higher prevalence of dementia.18 To our knowledge, no clear sex-specific differences in the relationship between cognition and sex in patients with AF have been observed so far. In AXAFA-AFNET 5, MoCA scores were similar in women and men. The number of study patients with acute brain lesions after ablation (∼25%) was in line with previous publications19,20 and without significant differences in women and men. In light of this relatively high percentage of acute brains lesions, the observation that in both women and men the presence of at least mild cognitive dysfunction according to the MocA test decreased in a similar manner from 32% and 30%, respectively to 23% at the end of follow-up is reassuring but may be related to repetitive testing.
Future implications
The current study supplies evidence that catheter ablation provides uniform benefit to women and men in terms of effectiveness in maintaining short-term sinus rhythm, increase in QoL, and cognitive function as assessed by the MoCA test. Importantly, no major differences regarding safety were observed. With the exception of slightly more non-fatal bleeding BARC 2 bleeding events, no differences in tamponade occurrence or vascular injury requiring transfusion were observed. Evolving ablation techniques, intracardiac echocardiography, and ultrasound guidance may in the future further reduce complications and completely eliminate any difference in complication rates between women and men. Increase in QoL is one of the key reasons to perform ablation. The fact that women can achieve similar results as men is an important reason not to withhold this therapy from women. The barriers, as well as facilitators, of catheter ablation in women deserve more attention as offering catheter ablation to more women holds an opportunity to positively affect outcomes.
Study limitations
Although this was a pre-specified analysis of AXAFA-AFNET 5, the study was not powered to detect sex differences. While patient characteristics, anticoagulation treatment, and ablation procedure did not show large differences between women and men, unmeasured confounders may be unbalanced. Prevalence of certain outcome events, including death and stroke or cardiac tamponade, was low which may have limited power to detect sex differences. Data on incidence of oesophageal thermal lesions were missing. In addition, changes in QoL and cognitive function were analysed at 3 months and therefore reflect short-term outcomes that prohibit making valid conclusions about the long-term effects of AF catheter ablation on these parameters.
Conclusion
The current AXAFA-AFNET 5 analysis revealed no major sex differences in terms of efficacy and safety of first-time catheter ablation under continuous anticoagulation. The increase in QoL and improvement in MoCA test score during follow-up was largely similar for women and men. Therefore, considering that hospital stay may be slightly longer in women than in men, ablation should not be withheld from women with symptomatic AF.
Funding
The AXAFA-AFNET 5 study was conducted with support from Pfizer/BMS and the German Centre for Cardiovascular Research supported by the German Ministry of Education and Research (DZHK, via a grant to AFNET). This work received additional support from European Union [grant agreement No. 633196 (CATCH ME) to P.K., L.F., and U.S.], European Union BigData@Heart (grant agreement EU IMI 116074 to P.K.), British Heart Foundation (FS/13/43/30324 to P.K and L.F., PG/17/30/32961 to P.K. and AA/18/2/34218 to P.K and L.F.), and Leducq Foundation to P.K.
Conflict of interest: K.G.H. reports study grants by Bayer and Sanofi-Aventis, lecture fees/advisory board fees from Sanofi-Aventis, Pfizer, Bristol-Myers-Squibb, Boehringer Ingelheim, Daiichi Sankyo, Biotronik, W. L. Gore & Associates, Edwards Lifesciences, and Medtronic. D.T. reports patient recruitment based funding from Bristol-Myers-Squibb-Pfizer during the conduct of the study, personal fees from Abbott UK, personal fees from Boston Scientific UK, personal fees from Medtronic UK, and personal fees from Daiichi-Sankyo, outside the submitted work. J.C.N. reports grants from Novo Nordisk Foundation (NNF16OC0018658), outside the submitted work. U.S. reports personal fees from EP Solutions, grants from Roche, outside the submitted work. J.P.P. reports grants from AFNET during the conduct of the study, grants from Abbott, personal fees from Allergan, grants from Bayer, grants from Boston Scientific, grants and personal fees from Philips, personal fees from Medtronic, personal fees from Milestone, and personal fees from Sanofi, outside the submitted work. P.K. receives research support for basic, translational, and clinical research projects from European Union, British Heart Foundation, Leducq Foundation, Medical Research Council (UK), and German Centre for Cardiovascular Research, from several drug and device companies active in atrial fibrillation and has received honoraria from several such companies in the past. P.K. is listed as inventor on two patents held by University of Birmingham (Atrial Fibrillation Therapy WO 2015140571, Markers for Atrial Fibrillation WO 2016012783). L.M. reports grants from Abbott Medical, personal fees from Abbott Medical, grants from Boston Scientific, personal fees from Boston Scientific, grants from Medtronic, personal fees from Medtronic, grants from Biotronik, grants from Johnson&Johnson, personal fees from Johnson&Johnson, personal fees from MicroPort, other from Galgo Medical, outside the submitted work.
