


Abstract
Atrial fibrillation (AF) is a progressive disease, but identifying patients at risk for AF progression is challenging. We aimed to identify factors associated with AF progression.
Atrial fibrillation progression was assessed in 392 patients with recent-onset paroxysmal or persistent AF included in the prospective, observational, multicentre identification of a risk profile to guide atrial fibrillation (AF-RISK) study. Progression of AF was assessed by Holter monitoring and 2-week event recorder at baseline and 1-year follow-up. AF progression was defined as: (i) doubling in AF burden at 1 year compared to baseline with a minimum AF burden of 10% in paroxysmal AF; or (ii) transition from paroxysmal to persistent or permanent AF; or (iii) persistent to permanent AF. Age was 60 ± 11 years, 62% were men, and 83% had paroxysmal AF. At 1 year, 52 (13%) had AF progression (11% in paroxysmal; 26% in persistent AF). Multivariable logistic regression showed that left atrial volume [odds ratio (OR) per 10 mL 1.251, 95% confidence interval (CI) 1.078–1.450; P < 0.001], N-terminal pro-B-type natriuretic peptide (NT-proBNP; OR per standard deviation increase 1.583, 95% CI 1.099–2.281; P = 0.014), and plasminogen activator inhibitor-1 (PAI-1; OR per standard deviation increase 0.660, 95% CI 0.472–0.921; P = 0.015) were associated with AF progression. In an additional follow-up of 1.9 (0.9–3.3) years patients with AF progression developed more cardiovascular events and all-cause mortality (12.4%/year vs. 2.3%/year, P < 0.001).
Atrial fibrillation progression occurred in 13% of patients with recent-onset AF during 1-year follow-up. Left atrial volume, NT-proBNP, and PAI-1 were associated with AF progression. Patients with AF progression had a higher event rate.
Clinicaltrials.gov NCT01510210.
Present study prospectively evaluated atrial fibrillation (AF) progression in 392 patients using standardized rhythm monitoring that included Holter monitoring and event recorders, compared to most studies on AF progression that only use electrocardiograms as rhythm monitoring.
The risk on developing cardiovascular events is higher in patients who have progression of AF.
We found left atrial volume, N-terminal pro-B-type natriuretic peptide, and plasminogen activator inhibitor-1 levels to be associated with AF progression.
Introduction
Atrial fibrillation (AF) is a dynamic disease.1 Atrial remodelling due to cardiovascular risk factors and comorbidities are associated with progression of AF to more advanced forms, e.g. paroxysmal AF transcending into persistent AF.2 Adequately treating risk factors and comorbidities can, however, prevent AF progression.3 Depending on the exact definition and characteristics of the population studied, AF progression rates range from <1% to 30% per year.4 Identifying patients at risk for AF progression is of importance because its association with worse cardiovascular outcome.5–8
Our current knowledge on AF progression is based on registries with limited rhythm monitoring4–6,8 and AF progression is often defined by transition from self-terminating to non-self-terminating AF on the basis of repeated electrocardiograms (ECGs) and clinical evaluation. This misclassifies patients who progress from low-burden paroxysmal AF to high-burden paroxysmal AF as having no progression. The American Heart Association recently released a statement which advocates more research on AF beyond a binary entity (either present or absent).9 This also includes a more refined definition of AF progression, its determinants, pathophysiological mechanisms, and outcome.
In the present multicentre, prospective study, we aimed to assess AF progression rate, clinical, echocardiographic factors, and blood biomarkers associated with AF progression in patients with a short history of AF, and the association of AF progression with cardiovascular morbidity and mortality.
Methods
Study design
The identification of a risk profile to guide atrial fibrillation therapy (AF-RISK) study was a prospective, observational, multicentre study. Primary aim was to assess AF progression. The study was performed in The Netherlands (University Medical Centre Groningen and the Maastricht University Medical Centre +). The study was performed in concordance with the Declaration of Helsinki, was approved by the institutional review boards, and was registered on ClinicalTrials.gov (identifier NCT01510197). All patients gave written informed consent.
Patient population
Between May 2011 and March 2016, 499 patients were included. Patients aged ≥18 years who presented at either the inpatient or outpatient cardiology clinic with recent-onset paroxysmal AF (total AF history <2 years, or total AF history <3 years in case of ≤2 AF episodes of ≤48 h per month terminating spontaneously) or with a short history of persistent AF (total AF history <2 years, and total persistent AF duration >7 days and <1 year) in whom a rhythm control strategy was preferred, were eligible. Patients with history of heart failure >3 years; severe valvular disease; contra-indication for oral anticoagulation; acute coronary syndrome <1 month; or post-operative AF were not eligible. Heart failure was defined as one of the following: (i) history of heart failure admission, regardless of the left ventricular ejection fraction (LVEF); (ii) LVEF <45%; (iii) LVEF >45%, a history of elevated N-terminal pro-B-type natriuretic peptide (NT-proBNP) with either structural heart disease and/or diastolic dysfunction.3
Study procedures
All patients were treated according to the European Society of Cardiology AF management guidelines.1 At inclusion, patients’ demographic and clinical characteristics concerning underlying disease, cardiovascular risk factors, lifestyle, AF triggers, symptomatology, and medication use were carefully collected. All patients underwent physical examination, ECG, echocardiography, and exercise test. Patients were seen at the outpatient clinic at 1, 3, 6, and 9 months and at 1 year. Detailed study-related activities are shown in the Supplementary material online, File S1. All patients with persistent AF were in sinus rhythm at baseline, either by scheduled cardioversion or spontaneous conversion.
Rhythm monitoring was done by a 24-h Holter at baseline and 6 months, a 48-h Holter at 1-year follow-up, and 2-week event monitor (Vitaphone 100IR, Vitagroup, Mannheim, Germany) at baseline and 1 year. In a subset of 76 patients, only baseline information was collected, including blood sampling, and were, therefore, not included in the current analysis (Figure 1).
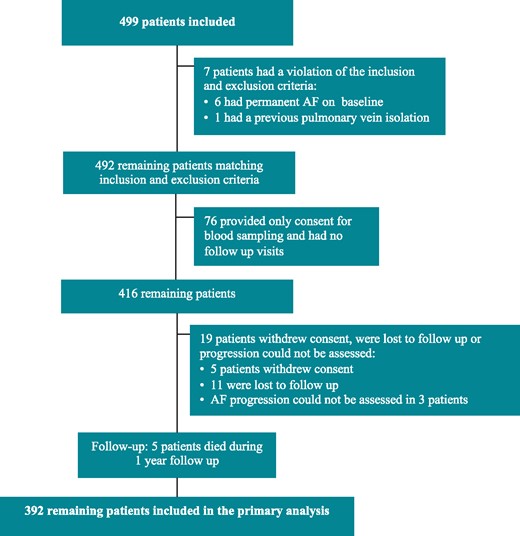
A flowchart of all patients included in the AF-RISK study. Primary analyses included 392 patients. AF, atrial fibrillation.
Echocardiography
A two-dimensional transthoracic echocardiogram was performed according to the recommendations of the European Society of Cardiology.10 For speckle tracking analysis of atrial strain, the endocardial surface was manually traced. A point-and-click approach was used and the additional tracing was automatically generated (GE, EchoPac BT12), and manually checked for accuracy. Values of reservoir, conduit, and contraction strain for the left atrium were measured in all patients who were in sinus rhythm during the echo.
Blood biomarkers
At baseline, blood samples were collected. Multiplex immunoassay by proximity extension assay technology (Olink Bioscience, Uppsala, Sweden) was used to assess 92 cardiovascular biomarkers from the Cardiovascular III panel in EDTA plasma. Values of four biomarkers had >10% of the values below the limit of detection and were therefore excluded from the analysis. Data are presented as arbitrary units on a Log2-scale. The total list of available biomarkers is shown in Supplementary material online, File S2.
Atrial fibrillation progression
Type of AF was defined as paroxysmal (≤7 days of continuous AF), persistent (>7 days of continuous AF), and permanent AF (inability to restore sinus rhythm or sinus rhythm is no longer pursued by the treating physician).1 Atrial fibrillation progression was defined as one of the following: (i) a doubling in AF burden at 1-year follow-up compared to baseline with a minimum AF burden of 10%, in patients with paroxysmal AF; (ii) progression from paroxysmal to either persistent or permanent AF; and (iii) progression from persistent to permanent AF. The AF burden was calculated by the amount of time of AF divided by the total monitoring time.
Cardiovascular morbidity and mortality
Cardiovascular events and all-cause mortality were prospectively collected after AF progression was assessed through electronic patient records. All-cause mortality, heart failure hospitalization, stroke, systemic embolism, major bleeding, syncope, life-threatening adverse effects of AF drugs, sustained ventricular tachycardia, myocardial infarction, and implantation of a pacemaker or implantable cardioverter-defibrillator were events of interest.
Statistical analysis
Descriptive data of continuous variables are presented as mean ± standard deviation in normally distributed data or median (interquartile range) in non-normally distributed data. Categorical variables are presented as numbers with percentages. Differences between groups were evaluated by Student’s t-test or Mann–Whitney U test for continuous variables, and Fisher’s exact test (two categories) or χ2 (>2 categories) for categorical variables. Univariable logistic regression analysis was performed to identify factors associated with AF progression. A multivariable model of AF progression was made by stepwise logistic regression. Odds ratios (ORs) were presented with a 95% confidence interval (CI). The final model was tested for significant interactions and collinearity. The multivariable regression model found for AF progression was additionally adjusted for type of AF at baseline (either paroxysmal or persistent AF; Model 1) and type of AF at baseline, pulmonary vein isolation during study period, and anti-arrhythmic drug use (Model 2).
After assessment of AF progression at one year, cardiovascular events were collected. Yearly event rates were calculated by dividing the number of follow-up years after assessing AF progression by the number of events, with censoring after the first event. Differences in event rates and 95% CI were calculated using MedCalc (version 18.2, MedCalc Software, Belgium). Differences in event rates in patients with and without AF progression was illustrated by a Kaplan–Meier made using GraphPad Prism version 7.02 (GraphPad Software, La Jolla, CA, USA) and was tested by log-rank test. Cox proportional hazards regression was performed and hazard ratio (HR) and 95% CI were given and additionally adjusted for age, sex, CHA2DS2-VASc score, and left atrial volume. All other analyses were performed using SPSS (IBM, Armonk, NY, USA) statistical software, version 23. A P-value <0.05 was considered statistically significant.
Results
Figure 1 shows the study profile. Baseline characteristics are shown in Table 1 (not different from the total AF-RISK population, data not shown). Patients with persistent AF were older (63 ± 10 vs. 59 ± 12 years, P = 0.016), more often men (77% vs. 58%, P = 0.004) and had more comorbidities (2.6 ± 1.4 vs. 1.7 ± 1.3, P < 0.001), as well as larger left atrial volume (89 ± 25 vs. 67 ± 21, P < 0.001) and lower left atrial reservoir (34 ± 13 vs. 26 ± 13, P < 0.001) and contraction strain (16 ± 7 vs. 10 ± 7, P < 0.001) compared to paroxysmal AF (Supplementary material online, File S3). During 1-year follow-up, 177 (45%) patients had no documented AF recurrence. Patient with paroxysmal AF on baseline had a higher proportion of patients without recurrence (48% vs. 32%, P < 0.001).
Baseline characteristics
| Characteristics | Total population (N = 392) | AF progression in 1 year (N = 52) | No AF progression in 1 year (N = 340) | P-value |
|---|---|---|---|---|
| Age (years) | 60 ± 11 | 64 ± 10 | 60 ± 12 | 0.015 |
| History of AF (months) | 5 (2–15) | 6 (3–17) | 5 (2–15) | 0.139 |
| Male sex | 241 (62) | 29 (55) | 212 (62) | 0.364 |
| Type of AF | 0.001 | |||
| Paroxysmal AF | 323 (82) | 34 (65) | 289 (85) | |
| Persistent AF | 69 (18) | 18 (35) | 51 (15) | |
| Heart failure | 205 (52) | 24 (46) | 181 (53) | 0.373 |
| Hypertension | 201 (51) | 30 (58) | 161 (47) | 0.182 |
| Diabetes mellitus | 39 (10) | 6 (12) | 33 (10) | 0.624 |
| Coronary artery disease | 33 (8) | 4 (8) | 29 (9) | 1.000 |
| Peripheral artery disease | 10 (3) | 5 (10) | 5 (2) | 0.005 |
| Stroke or TIA | 26 (7) | 4 (8) | 21 (6) | 0.759 |
| COPD | 27 (7) | 5 (10) | 22 (7) | 0.381 |
| CHA2DS2-VASc scorea | 1.7 ± 1.4 | 2.2 ± 1.5 | 1.6 ± 1.4 | 0.007 |
| Number of comorbiditiesb | 1.9 ± 1.3 | 2.3 ± 1.4 | 1.8 ± 1.3 | 0.013 |
| EHRA class | 0.294 | |||
| I | 109 (28) | 11 (21) | 98 (29) | |
| II | 217 (55) | 34 (65) | 183 (54) | |
| III | 66 (17) | 7 (14) | 59 (17) | |
| Height (cm) | 178 ± 10 | 177 ± 9 | 178 ± 10 | 0.544 |
| Weight (kg) | 89 ± 17 | 91 ± 20 | 88 ± 17 | 0.368 |
| BMI (kg/m2) | 28 ± 5 | 29 ± 5 | 28 ± 5 | 0.236 |
| Obesity (BMI >30) | 108 (28) | 15 (29) | 93 (27) | 0.868 |
| Blood pressure (mmHg) | ||||
| Systolic | 131 ± 17 | 132 ± 18 | 130 ± 17 | 0.529 |
| Diastolic | 78 ± 10 | 79 ± 10 | 78 ± 9 | 0.845 |
| Medications | ||||
| β-blocker | 243 (62) | 31 (60) | 212 (62) | 0.760 |
| Verapamil/diltiazem | 39 (10) | 9 (17) | 20 (9) | 0.078 |
| Digoxin | 16 (4) | 1 (2) | 15 (4) | 0.706 |
| ACE-inhibitor | 115 (29) | 17 (33) | 98 (29) | 0.624 |
| Angiotensin receptor blocker | 53 (14) | 9 (17) | 44 (13) | 0.386 |
| Anticoagulant | 265 (68) | 41 (79) | 224 (66) | 0.050 |
| Class Ic AAD | 34 (9) | 2 (4) | 32 (9) | 0.287 |
| Class III AAD | 23 (6) | 3 (6) | 20 (6) | 1.000 |
| PQ time (ms) | 168 ± 27 | 176 ± 30 | 167 ± 27 | 0.054 |
| Echocardiographic variables | ||||
| Left atrial volume (mL) | 71 ± 23 | 85 ± 27 | 69 ± 22 | <0.001 |
| Left atrial volume index (mL/m2) | 34 ± 11 | 41 ± 12 | 33 ± 10 | <0.001 |
| LV ejection fraction (%) | 57 ± 5 | 55 ± 6 | 57 ± 5 | 0.096 |
| LV mass (g) | 170 ± 46 | 178 ± 56 | 169 ± 44 | 0.191 |
| LV mass index (g/m2) | 83 ± 19 | 85 ± 22 | 82 ± 18 | 0.334 |
| LV hypertrophy | 35 (9) | 5 (10) | 30 (9) | 0.792 |
| Left atrial strain (%) | ||||
| Reservoir | 33.5 ± 12.6 | 31.0 ± 13.1 | 33.7 ± 12.5 | 0.325 |
| Conduit | 17.9 ± 9.1 | 16.8 ± 8.2 | 18.0 ± 9.2 | 0.553 |
| Contraction | 15.6 ± 7.2 | 14.2 ± 6.4 | 15.7 ± 7.3 | 0.334 |
Data are expressed as mean (standard deviation), number of patients (%), or median (interquartile range).
AAD, anti-arrhythmic drug; ACE, angiotensin-converting enzyme; AF, atrial fibrillation; BMI, body mass index; COPD, chronic obstructive pulmonary disease; ECG, electrocardiogram; EHRA, European Heart Rhythm Association class for symptoms; HF, heart failure; LV, left ventricular; NOAC, novel oral anticoagulant drugs; TIA, transient ischaemic attack.
The CHA2DS2-VASc score assesses thromboembolic risk. C, congestive heart failure/LV dysfunction; H, hypertension; A2, age ≥75 years; D, diabetes mellitus; S2, stroke/transient ischaemic attack/systemic embolism; V, vascular disease; A, age 65–74 years; Sc, sex category (female sex).
The number of comorbidities was calculated by awarding a point for hypertension, age >65 years, diabetes, coronary artery disease, body mass index >25, kidney dysfunction, and moderate or severe mitral valve regurgitation.
Atrial fibrillation progression
Atrial fibrillation progression occurred in 52 of 392 patients (13%), 34 of 323 (11%) with paroxysmal AF (Figure 2), and in 18 of 69 (26%) persistent AF patients. Twenty-three (7%) patients with paroxysmal AF had a significant increase in AF burden during follow-up, and 11 patients (3%) progressed from paroxysmal to persistent or permanent AF. A total of 18 (26%) patients with persistent AF on baseline developed permanent AF. We observed no sex differences in progression rate (OR for women vs. men 1.314, 95% CI 0.728–2.369; P = 0.365). A total of three clinical variables were univariably associated with AF progression, including age (OR 1.037 per year, 95% CI 1.007–1.069; P = 0.016), type of AF (OR 3.000 for persistent AF vs. paroxysmal AF, 95% CI 1.575–5.713; P < 0.001) and left atrial volume (OR 1.328 per 10 mL, 95% CI 1.168–1.511; P < 0.001). Additionally, two risk scores were also univariably associated with AF progression: CHA2DS2-VASc (OR 1.293 per point, 95% CI 1.070–1.562; P = 0.008) and the HATCH score (OR 1.300 per point, 95% CI 1.002–1.685; P = 0.048). We observed no differences in progression rate on individual components of the HATCH score, except for age, including heart failure (OR 0.753, 95% CI 0.419–1.352; P = 0.342), chronic obstructive pulmonary disease (OR 1.538, 95% CI 0.555–4.257; P = 0.407) or prior stroke or transient ischaemic attack (OR 1.266, 95% CI 0.419–1.352; P = 0.678). A total of 17 biomarkers were univariably associated with AF progression (Supplementary material online, File S4). Multivariable analysis revealed that left atrial volume (OR per 10 mL 1.251, 95% CI 1.078–1.450; P < 0.001), NT-proBNP (OR per standard deviation 1.583, 95% CI 1.099–2.281; P = 0.014) and plasminogen activator inhibitor-1 (PAI-1; OR per standard deviation 0.660, 95% CI 0.472–0.921; P = 0.015) were associated with AF progression (Table 2). Changes in therapy during follow-up included pulmonary vein isolation in 59 (15%); 51 (16%) in paroxysmal AF and 8 (12%) in persistent AF. In 40 (10%) patients, anti-arrhythmic drugs were initiated or dosage was increased; 31 (10%) in paroxysmal AF and nine (13%) in persistent AF (Supplementary material online, File S5). In patients with AF progression, two (4%) had an ablation during follow-up, compared to 57 (17%) of patients without AF progression (P = 0.012). Factors included in the multivariable regression model remained significant after adjusting for type of AF (Model 1); and type of AF, pulmonary vein isolation during study period and anti-arrhythmic drug use (Model 2). During follow-up, patients with AF progression had an average weight gain of 1 ± 4 kg, which was comparable to patients without AF progression (1 ± 4 kg, P = 0.971). There was also no difference in the proportion of patients who had significant (≥5%) weight loss [five (10%) patients with AF progression and 29 (9%) without AF progression, P = 0.815].
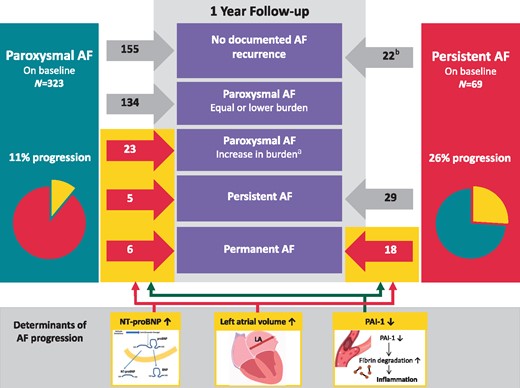
Change in type of AF from baseline to 1 year. Red arrows and numbers represent patients with AF progression and grey arrows and numbers represent patients without AF progression. aIncrease in AF burden was defined according to the AF progression definition: a doubling in AF burden at one year with at least an AF burden of 10%. bAll patients with persistent AF underwent a cardioversion at baseline. AF, atrial fibrillation; LA, left atrium; NT-proBNP, N-terminal pro-B-type natriuretic peptide; PAI-1, plasminogen activator inhibitor.
Multivariable factors associated with AF progression
| Unadjusted model | Adjusted Model 1 | Adjusted Model 2 | ||||
|---|---|---|---|---|---|---|
| OR (95% CI) | P-value | OR (95% CI) | P-value | OR (95% CI) | P-value | |
| LA volume (per 10 mL) | 1.251 (1.078–1.450) | 0.003 | 1.248 (1.070–1.456) | 0.005 | 1.242 (1.062–1.452) | 0.007 |
| NT-proBNP (per SD) | 1.583 (1.099–2.281) | 0.014 | 1.575 (1.071–2.315) | 0.021 | 1.588 (1.075–2.345) | 0.020 |
| PAI-1 (per SD) | 0.660 (0.472–0.921) | 0.015 | 0.660 (0.472–0.921) | 0.015 | 0.680 (0.487–0.950) | 0.024 |
Model 1 was adjusted for type of AF at baseline (paroxysmal or persistent). Model 2 was adjusted for type of AF at baseline, pulmonary vein isolation during study period, and the use of anti-arrhythmic drugs.
CI, confidence interval; LA, left atrium; NT-proBNP, N-terminal pro-B-type natriuretic peptide; OR, odds ratio; PAI-1, plasminogen activator inhibitor; SD, standard deviation.
Cardiovascular morbidity and mortality
Additional follow-up to assess events was 1.9 (0.9–3.3) years. A total of 32 events occurred in 27 (8%) patients (Table 3). The yearly event rate in patients with AF progression was 12.4%/year (95% CI 6.4–21.6%) vs. 2.3%/year (95% CI 1.3–3.8%) in patients without AF progression (HR 5.764, 95% CI 1.820–18.258; P < 0.0001; Figure 3). Excluding patients with pulmonary vein isolation during follow-up or initiation or dose-change of anti-arrhythmic drugs did not affect results (HR 5.966, 95% CI 2.612–13.627; P < 0.0001), nor did adjustment for differences in age, sex, CHA2DS2-VASc, and left atrial volume (HR 3.591, 95% CI 1.401–9.206; P = 0.008).

Kaplan–Meier estimates showing the composite of cardiovascular events and all-cause mortality for patients with and without AF progression during additional follow-up. aA follow-up duration began after AF progression assessment at 1 year. AF, atrial fibrillation; CI, confidence interval.
Cardiovascular events and all-cause mortality after 1-year, including yearly event rates during additional follow-up
| Total (N = 350) | AF progression (N = 49) | No AF progression (N = 301) | P-valuea | |
|---|---|---|---|---|
| Patients with an event | 27 (8%) | 12 (24%) | 15 (5%) | <0.001 |
| Total number of events | 32 | 15 | 17 | |
| Cardiovascular events | 3.6%/year | 12.4%/year | 2.3%/year | <0.001 |
| All-cause mortality | 7 (0.9%/year) | 2 (1.8%/year) | 5 (0.8%/year) | 0.287 |
| HF hospitalization | 4 (0.5%/year) | 2 (1.9%/year) | 2 (0.3%/year) | 0.040 |
| Stroke | 3 (0.4%/year) | 1 (0.9%/year) | 2 (0.3%/year) | 0.347 |
| Systemic embolism | – | – | – | |
| Major bleeding | 4 (0.5%/year) | 2 (1.9%/year) | 2 (0.3%/year) | 0.038 |
| Syncope | 4 (0.5%/year) | 3 (2.8%/year) | 1 (0.2%/year) | <0.001 |
| Life-threatening AE of AF drugs | – | – | – | |
| Sustained ventricular tachycardia | 1 (0.1%/year) | – | 1 (0.2%/year) | 0.681 |
| Myocardial infarction | 3 (0.4%/year) | 3 (2.8%/year) | – | <0.001 |
| PM implant | 5 (0.7%/year) | 2 (1.9%/year) | 3 (0.5%/year) | 0.095 |
| ICD implant | 1 (0.1%/year) | – | 1 (0.2%/year) | 0.679 |
AE, adverse events; AF, atrial fibrillation; HF, heart failure; ICD, implantable cardioverter-defibrillator; PM, pacemaker.
P-value is given for differences in yearly event rate between patients with and without AF progression.
Also in patients with paroxysmal AF on baseline only the event rate was higher in those with AF progression (HR 5.880, 95% CI 2.235–15.467; P = 0.0003; Supplementary material online, File S3).
Discussion
In patients with recent-onset of AF, we observed an AF progression rate of 13% in 1-year follow-up, with higher AF progression rates in persistent (26%), compared to paroxysmal AF (11%). Larger left atrial volume, higher levels of NT-proBNP, and lower levels of PAI-1 were associated with AF progression. Patients with AF progression had a higher all-cause mortality and cardiovascular event rate.
Atrial fibrillation progression
Assessment of AF progression is limited by the amount of rhythm monitoring. A uniformly accepted definition is lacking, but most often the transition from self-terminating to non-self-terminating AF is used.4,5 Our definition also included increase in AF burden, to avoid misclassifying patients who progress from low- to high-burden paroxysmal AF.9 By using a threshold of 10% burden, we tried to prevent misclassifying patients as having progression with minimal absolute increase in burden (e.g. 1% at baseline and 2.5% at 1 year). Using the traditional definition a yearly progression rate of 15% was found in the Euro Heart Survey.5 However, using the same definition, Padfield et al.11 only found 8.6% progression in 1 year in patients who were slightly younger and had less underlying cardiovascular conditions. And in patients with young-onset AF (<60 years) with few comorbidities, a yearly AF progression rate to permanent AF as low as 2% was observed.6 In AF-RISK, 3% had progression to persistent or permanent AF in 1-year follow-up. This relatively lower number can be explained by the low-risk profile of our patients. Using our definition, including progression from low to higher AF burden of paroxysmal AF, we found a progression rate of 13%, with higher AF progression rates in persistent (26%), compared to paroxysmal AF (11%). Different AF progression rates for paroxysmal and persistent AF were also found in a recent meta-analysis, with AF progression rates of 7.1% (paroxysmal to non-paroxysmal) and 18.6% (persistent to permanent AF), which is comparable to our progression rates.4 Higher progression rates in patients with persistent AF could be explained by more structural remodelling, due to more comorbidities and a higher age. This is supported by lower left atrial reservoir and contract strain and larger left atrial size that we found in persistent AF, compared to paroxysmal AF.
Factors associated with atrial fibrillation progression
Left atrial volume, NT-proBNP and PAI-1 were associated with AF progression. Treatment differences during follow-up that interfere with assessing the true AF progression rate remain an important limitation in studies on AF progression. Yet, the same factors remained associated with progression after correction for type of AF and treatment during follow-up. Increased left atrial volume has often been associated with AF incidence, recurrence and cardiovascular events.12 An enlarged left atrium is a sign of an atrial myopathy due to progressive atrial remodelling caused by risk factors and comorbidities including ageing, stretch from pressure and volume overload, inflammation, and oxidative stress.2 This results in atrial fibrosis, loss of atrial contractile function, and formation of both an arrhythmogenic and thrombogenic substrate.13
Multiple blood biomarkers, including interleukin-6, C-reactive protein, and troponin have previously been associated with incident and recurrent AF. Yet, limited data are available on blood biomarkers in AF progression. Progression from persistent to permanent AF has been associated with higher levels of fibrotic and inflammatory markers, such as transforming growth factor β1.14 In a small study, Akutsu et al.15 linked baseline elevated levels of BNP with AF progression to persistent AF. In our cohort, NT-proBNP was also associated with AF progression. N-terminal pro-B-type natriuretic peptide, a cardiac-specific marker, has been associated with incident AF and increased risk of mortality.16 Secretion of NT-proBNP is promoted by cardiac myocyte stretch. Since atrial stretch also causes release of NT-proBNP, it reflects a degree of atrial dysfunction.
Plasminogen activator inhibitor-1 serves as marker of fibrinolysis with its main function being inhibition of tissue plasminogen activator and urokinase, thereby attenuating fibrinolysis. The role of PAI-1 in AF is less known. In a large community-based study no clear association of PAI-1 with incident AF was found.17 Despite being a marker of increased fibrinolysis, low PAI-1 levels do not necessarily reflect hypocoagulability or a reduced atherothrombotic risk, as thrombin and/or fibrin formation might be normal, or even increased. Hypercoagulability has previously been linked to atrial remodelling, promoting AF.13 Promotion of fibrosis has been demonstrated in PAI-1 deficient mice.18 One explanation for this latter observation could be increased inflammation and chemotaxis inducted by fibrin degradation products. Indeed, fibrin degradation products, including D-dimer, have been shown to cause an inflammatory response.19 This can, in turn, enhance atrial substrate formation and explain our observed association between lower PAI-1 levels and AF progression.
In the recent meta-analysis, Blum et al.4 found history of hypertension, frequency of paroxysmal AF at baseline, age, history of heart failure, and duration of follow-up to be predictors of AF progression. This is partly in agreement with earlier findings of de Vos et al.,5 who developed the HATCH AF-progression risk-score, which is an acronym for Hypertension, Age >75 years, previous Transient ischaemic attack or stroke, Chronic obstructive pulmonary disease, or Heart failure. Both indicate that underlying (cardiovascular) disease and number of comorbidities underlie AF progression and should be treated accordingly in order to prevent AF progression.3
Cardiovascular events and mortality
Patients with AF progression showed a higher rate of cardiovascular events and all-cause mortality as has been demonstrated before.5–8 This effect was observed in both paroxysmal AF and persistent AF, and remained after adjusting for several factors, including left atrial size and CHA2DS2-VASc score. However, most definitions did not include progression from low- to high-burden paroxysmal AF. Increased morbidity and mortality associated with AF progression has been shown in patients with progression of subclinical AF episode duration.7 Atrial fibrillation progression defined as prolongation to atrial high rate episodes >24 h was associated with a higher rate of heart failure hospitalizations. In ECG-detected AF this has been demonstrated as well. Vanassche et al.8 found type of AF being one of the strongest predictors of stroke. Go et al.20 found a three-fold increase in stroke risk in patients within the highest tertile of AF burden. These results signify that the amount of AF itself may have prognostic value. Yet, whether this is due to a causal relation of AF burden with events or that these patients have more severe underlying diseases, being therefore, more challenging to treat, cannot be concluded from our data.
Future perspectives
More data are needed to clarify the relation of cardiovascular events and the amount of AF and whether preventing AF progression also leads to a more favourable prognosis. The Reappraisal of Atrial Fibrillation: Interaction Between HyperCoagulability, Electrical Remodelling, and Vascular Destabilization in the Progression of Atrial Fibrillation (RACE V; Clinicaltrials.gov identifier NCT02726698) registry is currently enrolling patients with paroxysmal AF and aims to elucidate the factors associated with AF progression, with special emphasis on the role of hypercoagulability. This is done by deep phenotyping patients with paroxysmal self-terminating AF and the use of continuous rhythm monitoring through an implantable loop recorder or a pacemaker and will be able to validate the present findings and provide in the process of AF progression in a population with continuous rhythm monitoring.
Strengths and limitations
Strengths of the present analysis include the prospective study design with AF progression as primary aim, the well-phenotyped population with frequent study-related outpatient clinic visits on top of rhythm monitoring by Holter and event recording at several time points during 1 year. Continuous rhythm monitoring was not used, which may be considered an important limitation. Yet, the combination of Holter monitoring and event recording as rhythm monitoring strategy during follow-up may have provided more accurate data on AF progression compared to other studies.
Although the study population consisted of both paroxysmal and persistent AF, adding the type of AF to the regression model did not affect results, as well as differences in treatment during follow-up between patients. And indeed, higher progression rates were found in more advanced forms of AF (e.g. persistent AF compared to paroxysmal AF). The AF-RISK population was a relatively low-risk AF population, limiting the number of AF progression events and cardiovascular events during follow-up. Therefore, our data cannot be translated to higher risk AF patients. And finally, the associations that have been found do not necessarily reflect causal relation.
Conclusion
Atrial fibrillation is a progressive disease. We found a 13% progression rate during 1-year follow-up with higher progression rates in persistent (26%) compared to paroxysmal AF (11%). A larger left atrial volume, higher NT-proBNP plasma levels, and a lower PAI-1 plasma level were associated with AF progression, also after adjusting for type of AF at baseline. Patients with AF progression had a higher morbidity and mortality rate.
Acknowledgements
The authors acknowledge the support from the Netherlands Cardiovascular Research Initiative: an initiative with support of the Dutch Heart Foundation, CVON 2014-9: Reappraisal of Atrial Fibrillation: interaction between hyperCoagulability, Electrical remodelling, and Vascular destabilization in the progression of AF (RACE V). Grant support to the institution from Medtronic outside submitted work.
Conflict of interest: none declared.
Funding
This work was supported by the Dutch Heart Foundation (NHS2010B233).
