


Abstract
During atrial fibrillation ablation, oesophageal heating typically prompts reduction or termination of radiofrequency energy delivery. We previously demonstrated oesophageal temperature rises are associated with posterior left atrial pulmonary vein reconnection (PVR) during redo procedures. In this study, we assessed whether mechanical oesophageal deviation (MED) during an index procedure minimizes posterior wall PVRs during redo procedures.
Patients in whom we performed a first-ever procedure followed by a clinically driven redo procedure were divided based on both the use of MED for oesophageal protection and the ablation catheter employed (force or non-force sensing) in the first procedure. The PVR sites were compared between MED using a force-sensing catheter (MEDForce), or no MED with a non-force (ControlNoForce) or force (ControlForce) sensing catheter. Despite similar clinical characteristics, the MEDForce redo procedure rate (9.2%, 26/282 patients) was significantly less than the ControlNoForce (17.2%, 126/734 patients; P = 0.002) and ControlForce (17.5%, 20/114 patients; P = 0.024) groups. During the redo procedure, the posterior PVR rate with MEDForce (2%, 1/50 PV pairs) was significantly less than with either ControlNoForce (17.7%, 44/249 PV pairs; P = 0.004) or ControlForce (22.5%, 9/40 PV pairs; P = 0.003), or aggregate Controls (18.3%, 53/289 PV pairs; P = 0.006). However, the anterior PVR rate with MEDForce (8%, 4/50 PV pairs) was not significantly different than Controls (aggregate Controls—3.5%, 10/289 PV pairs, P = 0.136; ControlNoForce—2.4%, 6/249 PV pairs, P = 0.067; ControlForce—10%, 4/40 PV pairs, P = 1.0).
Oesophageal deviation improves the durability of the posterior wall ablation lesion set during AF ablation.
When mechanical oesophageal displacement is employed during an index PV isolation procedure, the rate of posterior wall PV reconnections during a clinically driven redo ablation procedure was only 2%.
The low rate of posterior wall PV reconnections with mechanical deviation was substantially lower than when the initial procedure was performed using oesophageal temperature monitoring only (18.3%, P = 0.006).
The use of mechanical deviation during the index procedure was associated with a lower rate of patients undergoing second/redo ablation procedures (9.2% vs. 17.2%, P = 0.001).
Introduction
Acute pulmonary vein isolation (PVI) is typically achieved during atrial fibrillation (AF) ablation, but the durability of PVI is not assured. The PV reconnections (PVRs) have been demonstrated to be a primary mechanism of recurrent AF.1 Greater energy delivery may decrease the rate of long-term PVR, but the proximity of the oesophagus to the posterior left atrium (LA) raises safety concerns. To avoid thermal oesophageal damage, operators typically reduce the power applied for posterior LA applications. Continuous luminal oesophageal temperature (LET) monitoring is commonly employed: LET rises prompt termination of ablation and further reductions in radiofrequency (RF) power.1,2 Besides interfering with acute PVI, such interruptions in energy delivery may also impact PVI durability, which in turn may affect the long-term clinical outcome. Indeed, in patients undergoing a redo AF ablation procedure after a first-ever procedure with LET monitoring, the majority of PVRs is located along the posterior LA (83%).3 Furthermore, these posterior LA PVRs were spatially associated with LET elevations during the index procedure.3
These data suggest that LET-related premature termination of energy delivery negatively affects PVI durability. Conversely, this suggests that ablation success may improve if these LET rises are avoided. We previously demonstrated that mechanical oesophageal deviation (MED) can be successfully performed during AF ablation.4–6 By allowing uninterrupted posterior LA RF delivery, MED may be postulated to potentiate a greater lesion durability. On the other hand, given the number of variables potentially responsible for lesion durability (catheter stability, lesion contiguity, power delivered, etc.), and given the relative thinness of the posterior LA tissue, these LET rises might not significantly affect lesion durability. To directly address this question, we capitalized on the relatively uniform/unvaried ablation strategy employed at our institution—except for the introduction of MED in 2013 (used routinely starting 2014), and contact force-sensing RF catheters (catheterForce in 2013). This provided us the opportunity to study the impact of MED during an index ablation procedure on the incidence of posterior LA PVRs during subsequent clinically driven redo procedures.
Methods
Study populations
Patients with a first-ever RF ablation procedure for paroxysmal or persistent AF along with oesophageal deviation plus LET monitoring (between 2013 and July 2016) were identified; notably, cathetersForce were used in these patients. Patients after balloon ablation, or participating in clinical trial, were excluded (exception below). Patients who subsequently underwent redo ablation for clinical recurrence constituted the study cohort (MEDForce group). They were compared with Controls also undergoing redo procedures, but in whom the index procedure was performed (between 2009 and 2014) in consecutive patients without MED, and instead only LET monitoring. Controls were sub-divided into those with index procedures having been performed with either non-force-sensing (ControlNoForce) or force-sensing (ControlForce) catheters. This latter cohort consisted of consecutive patients enrolled in clinical trials of force-sensing catheters at our institution between 2011 and 2014.
The hospital’s institutional review board approved the study protocol, and the study complied with the principles of the Declaration of Helsinki. The MED was performed after approval by the Hospital’s Novel Procedures Oversight Committee; in addition to the standard consent AF ablation, patients were separately consented for MED.
Index procedure
All study procedures were performed under general anaesthesia with double transseptal puncture. Electroanatomic LA–PV maps were created using either the NavX (Abbott, St. Paul, MN, USA) or Carto (Biosense-Webster, Diamond Bar, CA, USA) navigation systems. Patients underwent ipsilateral PVI with a single wide area circumferential antral ablation lesion set. In MEDForce, an externally irrigated contact force sensing (catheter enabled with ThermoCool Smarttouch, Biosense-Webster, or TactiCath, Abbott) was used. The ablation catheter used in ControlNoForce was the Thermocool catheter (Biosense-Webster), and in ControlForce, either the Thermocool Smarttouch or the TactiCath catheter. In all procedures, a deflectable sheath (Agilis, Abbott) was used to enhance catheter stability, and single interrupted point-by-point ablation lesions were delivered in power control mode. After circumferential isolation, adenosine was administered to provoke latent PVR; additional ablation was performed if necessary. A multisensory oesophageal temperature probe (Circa S-Cath; Circa Scientific, Park City, UT, USA) was used for continuous LET monitoring.
In Controls, typically 35 W of RF energy was used except on the posterior wall, where it did not exceed 25 W. In MEDForce, there was no down-titration of power posteriorly, unless an LET rise exceeding 38°C was noted. Ablation lesions associated with LET rises were annotated on the electroanatomic maps.
Mechanical oesophageal deviation
As previously described, MED was performed after transseptal puncture but prior to LA geometry creation using either the stylet technique or the DV8 oesophageal retractor (Manual Surgical Sciences, Minneapolis, MN, USA; Figure 1).3–6 As previously described, the distance between the trailing oesophageal edge to the ablation line was measured for each PVI lesion set.5,6
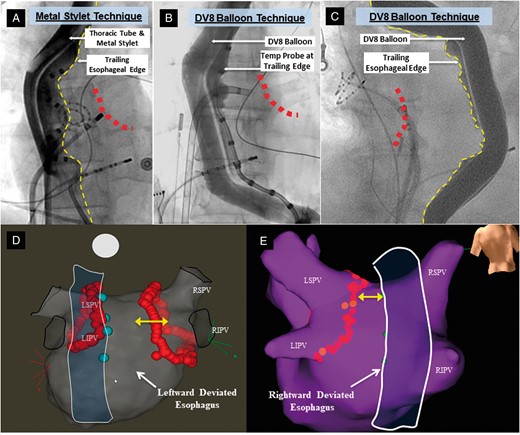
Mechanical oesophageal deviation techniques and electroanatomical mapping. These fluoroscopic anteroposterior views show MED using either rightward deviation with the malleable metal stylet (A) or balloon retractor (B) or leftward deviation with the balloon (C). Contrast is instilled into the oesophageal lumen to delineate the trailing edge (dotted yellow lines). The red dots represent the approximate location of the posterior ablation line. A temperature probe is also on the oesophageal trailing edge in (A) and (B); (C) is from a patient in whom a temperature probe was not used (and not included in this study dataset) in order to better delineate the edge of oesophagus clearly. Representative electroanatomical maps are shown in (D) and (E). The closest border of the deviated oesophagus (outline created artificially to display this) is marked with cyan tags on the electroanatomic map. These tags were placed on the map by visually aligning the ablation catheter on the posterior wall to the trailing oesophageal edge on an anteroposterior view. LIPV, left inferior pulmonary vein; LSPV, left superior pulmonary vein; MED, mechanical oesophageal deviation; RIPV, right inferior pulmonary vein; RSPV, right superior pulmonary vein.
Repeat procedure
Patients presenting with clinical recurrences underwent repeat procedures. The PVs were interrogated for electrical reconnections at baseline and after adenosine challenge. The relationship between the PVR site and the location of LET rises documented during the index procedure was analysed.
Statistical analysis
Continuous variables are expressed as means ± standard deviation for normally distributed variables or as median (25th, 75th percentiles) for non-normal distribution and categorical variables as frequency (percentage). A χ2 test was used to compare categorical variables, and frequencies compared using Fisher’s exact test when any cell within the table contained a value ≤ 5. A two-sample t-test was used to compare the normally distributed continuous variables. The non-parametric Mann–Whitney U test compared non-normal continuous variables. P-values <0.05 were considered significant.
Results
Patient cohorts
As shown in Table 1, the total cohort sizes of the index PVI procedures without MED and using a non-force-sensing catheter (ControlNoForce) or with force-sensing (ControlForce), or with MED and with force-sensing (MEDForce) were 734, 114, and 282 patients, respectively. The MED had been performed using either the stylet or balloon retractor technique in 245/282 (86.9%) or 37/282 (13.1%) patients, respectively. The redo procedure rate for MEDForce (9.2%) was significantly lower than either ControlNoForce (17.2%) or ControlForce (17.5%) individually, or the ControlAll (17.2%) aggregate cohort. On the other hand, the differences in redo procedure rates were similar between the two Control groups. Also shown in Table 1, the time transpiring between first and second procedures was similar between MEDForce and both ControlNoForce and ControlForce.
Redo procedure rates
| Redo rate, n (%) | P-valuea | Days between procedures | P-value b | ||
|---|---|---|---|---|---|
| Mean ± SD | Median | ||||
| MEDForce | 26/282 (9.2) | Refa | 253 ± 167 | 183 [113–373] | Refb |
| Control groups | |||||
| ControlForce | 20/114 (17.5) | 0.024 | 415 ± 408 | 315 [92–545] | 0.273 |
| ControlNoForce | 126/734 (17.2) | 0.002 | 276 ± 249 | 179 [119–386] | 0.969 |
| ControlAll | 146/848 (17.2) | 0.001 | – | – | – |
Indicated P-values are relative to the MEDForce group; the P-value for the comparison between the two Control groups is 1.0.
Indicated P-values are relative to the MEDForce group.
MED, mechanical oesophageal deviation.
The clinical characteristics of the cohorts were typical of patients referred for AF ablation: mostly younger, predominantly male, overall preserved left ventricular ejection fraction, and moderately dilated LA (Table 2). Approximately half the population presented with paroxysmal AF, except in ControlForce where, as per the clinical protocols, all patients had paroxysmal AF. Although body weight was also different between groups, these differences would be expected to bias against MEDForce—that is, higher BMI and fewer proportion of paroxysmal AF.
Clinical characteristics of redo procedure patients
| MEDForce (n = 26) | ControlNoForce (n = 126) | P-valuea | ControlForce (n = 20) | P-valueb | |
|---|---|---|---|---|---|
| Age | 64.0 ± 8.1 | 61.5 ± 11.8 | 0.282 | 65.0 ± 7.5 | 0.693 |
| BMI (kg/m2) | 31.1 ± 5.9 | 28.7 ± 5.5 | 0.056 | 27.0 ± 3.7 | 0.012 |
| Male, n (%) | 19 (73) | 84 (67) | 0.647 | 16 (80) | 0.732 |
| CHA2DS2-VASc | 2.0 ± 1.5 | 1.7 ± 1.6 | 0.352 | 2.2 ± 1.4 | 0.709 |
| SHD, n (%) | 6 (23) | 38 (30) | 0.159 | 0 (0) | 0.059 |
| LVEF (%) | 57.2 ± 12.9 | 57.1 ± 11.8 | 0.963 | 61.7 ± 7.4 | 0.176 |
| LA size (mm) | 42.5 ± 7.9 | 43.8 ± 8.9 | 0.355 | 40.6 ± 5.7 | 0.418 |
| Paroxysmal AF (%) | 14 (54) | 62 (49) | 0.830 | 20 (100) | <0.001 |
Compares MEDForce to ControlNoForce.
Compares MEDForce to ControlForce.
AF, atrial fibrillation; BMI, body mass index; LA, left atrium; LVEF, left ventricular ejection fraction; MED, mechanical oesophageal deviation; SHD, structural heart disease.
First (index) procedure
During the index procedure for MEDForce, 50 of 52 PV pairs (in 26 patients) were successfully isolated. The two PV pairs not acutely isolated were both right-sided, with the area of difficulty being anterior to the right PVs; during the redo procedures, these PVs remained un-isolated anteriorly. During the initial procedure, adenosine challenge was performed in 22 of 24 patients—transient reconnections were provoked in only 2 of 44 (4.5%) PV pairs; additional ablation eliminated this latent re-conduction.
The MED successfully facilitated bilateral PV pair isolation in 24 of 26 patients. Attempts at rightward MED were ineffective in the remaining two patients, but acute PVI was ultimately achieved. The LET rises (>38°C) occurred in 10 of 26 patients (38.5%)—occurring during right and left PVI in two and eight patients, respectively. No patient had LET rises ≥40°C. In instances when LET rises prompted termination of energy delivery, the mean time from onset of ablation to termination was relative long (32.1 ± 6.2 s; Table 3). In the two patients with failed right PVI due to anterior gaps, LET rises had not occurred. The mean distances between the trailing edge of the oesophagus and the ipsilateral line of isolation were 18.7 ± 8.0 and 10.0 ± 8.3 mm in the patients without and with LET rises, respectively (P = 0.004).
Procedural characteristics of the index procedures for the MEDForce cohort
| Extent of MEDa | |
| Rightward deviation (mm) | 10.8 ± 6.2 |
| Leftward deviation (mm) | 21.8 ± 7.6 |
| No. of pts with temperature rises >38.0°C, n (%) | 10/26 (38) |
| No. of pts with temperature rises >40.0°C, n (%) | 0/26 (0) |
| Mean no. of lesions/pt with temperature rise >38.0°C | 2.1 |
| Mean duration of RF for lesions with LET rises (s) | 32.1 ± 6.2 |
Measured from the trailing edge of the deviated oesophagus to the ablation line.
LET, luminal oesophageal temperature; RF, radiofrequency; MED, mechanical oesophageal deviation.
For ControlAll, 289 of 292 PV pairs (in 146 patients) were successfully isolated during the index procedure. Of the three remaining PV pairs not acutely isolated, one was right-sided, one was unknown, and one was left-sided. Only in the latter patient were LET rises responsible for PVI failure. Adenosine challenge was performed in 85/146 patients—for whom transient PVRs were provoked in 11 of 170 PV pairs (6.5%). Additional ablation eliminated latent re-conduction in all but one, in which the PVR, situated posteriorly, only transiently manifested with Adenosine. The LET data were not systematically collected during the index procedures for Controls.
Redo procedure—PV reconnections
Posterior wall PVRs occurred in only 1 of 50 (2%) PV pairs for MEDForce (Figures 2 and 3); for the sole PVR, there were no (0%) LET rises during the index procedure. This low posterior wall PVR rate was significantly lower than observed in either the individual ControlNoForce (17.7%, P = 0.004) or ControlForce (22.5%, P = 0.003) or aggregate ControlAll cohorts (18.3%, P = 0.006). Among the posterior wall PVRs, LET rises occurred in 19 of 44 (43.1%) and 5 of 8 (62.5%) PV pairs in the ControlNoForce and ControlForce groups, respectively (LET was not recorded for one PV pair).
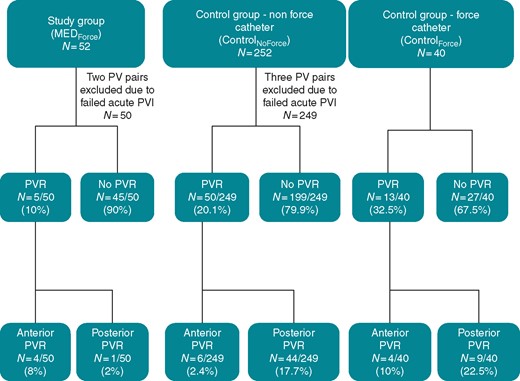
PVR outcomes. This flowchart details PVR rates and sites of reconnection in patients with and without MED. MED, mechanical oesophageal deviation; PVR, pulmonary vein reconnection.
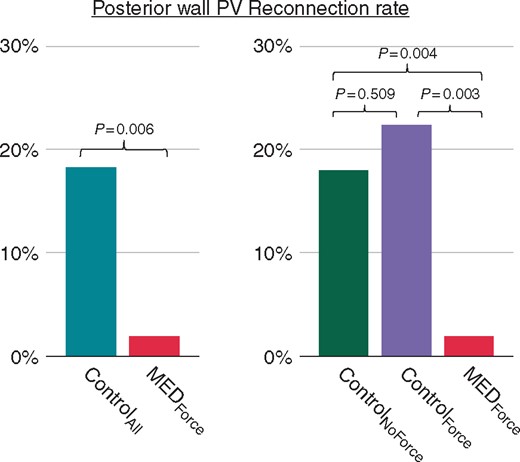
Posterior wall PV reconnection rates. The bar chart shows the comparison of posterior PVR rates between the MEDForce and Control groups, as well as the corresponding P-values. MED, mechanical oesophageal deviation; PV, pulmonary vein; PVR, pulmonary vein reconnection.
Conversely, the rate of anterior wall PVRs for MEDForce (4 of 50 PV pairs, 8%) was not significantly different than either ControlNoForce (2.4%, P = 0.067), ControlForce (10%, P = 1.0), or ControlAll (3.5%, P = 0.136). The overall PVR rate, including both anterior and posterior PVRs, for MEDForce (5 of 50 PV pairs, 10%) was not significantly different than ControlNoForce or ControlAll (P = 0.111 and P = 0.057, respectively), but did reach statistical significance for ControlForce (P = 0.015).
Finally, the proportion of PVRs that occurred posteriorly was calculated for each cohort (Table 4). For MEDForce, PVRs were rarely situated posteriorly—only one of five PV pairs (20%). In contrast, most PVRs in the Control cohorts occurred posteriorly: ControlNoForce—44 of 50 (88%, P = 0.003), ControlForce—9 of 13 (69%, P = 0.118), and ControlAll—53 of 63 (84%, P = 0.005).
Relative distribution of PV reconnections
| PV reconnections | P-valuesa | |||
|---|---|---|---|---|
| Total (n) | Posterior, % (n) | Vs. MEDForce | Vs. ControlForce | |
| MEDForce | 5 | 20 (1) | Ref | 0.118 |
| Control groups | ||||
| ControlAll | 63 | 84 (53) | 0.005 | – |
| ControlNoForce | 50 | 88 (44) | 0.003 | 0.194 |
| ControlForce | 13 | 69 (9) | 0.118 | Ref |
MED, mechanical oesophageal deviation; PV, pulmonary vein.
Discussion
The major finding of this study is that mechanical displacement of the oesophagus away from the site of ablation during PVI procedures results in a significant reduction of posterior LA PV reconnections during redo procedures. Posterior wall reconnections occurred in only 2% of all ablated PV pairs with MED in the index procedure, as compared with 17.7% and 22.5% of PV pairs (P = 0.004 and 0.003, respectively) for initial ablation without MED with non-force and force-sensing catheters, respectively.
The LA to PV conduction recovery is the primary cause of recurrent atrial tachyarrhythmias after AF ablation, and ablation of these PVRs has been the mainstay of the redo procedure.7 The PVRs along the posterior wall segments have been reported to be common. We previously demonstrated that 83% of all PVRs were located posteriorly in patients who had undergone their initial procedure using standard, non-force-sensing catheters.3 Similarly, Chinitz et al.8 demonstrated that in patients with initial procedures with either force or non-force-sensing catheters, the posterior PVR rate was 58%. Indeed, in our present study, most PVRs in Controls were situated posteriorly—84% for ControlAll. And similar to Chinitz et al., force-sensing catheters did not appreciably improve the posterior PVR rate—88% and 69% (P = 0.194) for ControlNoForce and ControlForce, respectively. This observation is further corroborated by El Haddad et al.,9 who also examined PVRs after initial PVI with a force-sensing catheter: 27 of 44 (61.4%) PVR segments were situated posteriorly (25 acute and 19 late PVRs). Together these data confirm that the advent of force-sensing catheters has not appreciably reduced the incidence of posterior wall PVRs.
Posterior LA ablation is commonly associated with oesophageal temperature elevations that prompt premature termination of RF energy or the use of lower powers, which may lead to incomplete lesions. We previously demonstrated that MED can be used to avoid oesophageal thermal damage, and we speculated that deviation may also impact ablation efficacy.3–6 That is, could MED optimize posterior wall ablation by allowing uninterrupted RF ablation with adequate power, thereby reducing posterior PVRs? In this study, we demonstrated that with MED, posterior PVRs occurred in only 2% of ablated PV pairs, as compared with no MED wherein they occurred in 18.3% of ablated PV pairs (P = 0.006).
Furthermore, this statistically significant reduction in posterior PVRs in the MEDForce group was mechanistically consistent with the absence of LET rises >40°C during the index procedures. The displacement of the nearest oesophageal border was 10.8 ± 6.2 mm for rightward deviation and 21.8 ± 7.6 mm for leftward deviation. In addition, though approximately a third of subjects experienced some LET rise >38°C: (i) this occurred for only a mean of two lesions per patient and (ii) the LET rises were gradual, requiring termination of RF energy delivery after a mean of 32 s. This further confirms the significant and clinically relevant lateral separation of the oesophagus from the site of ablation. Of note, the dedicated oesophageal balloon retractor was employed in only ∼13% of the cases—an important fact since this approach is superior to the stylet technique for MED.6 Finally, analysis of LET rises in Control cases would have helped further corroborate the mechanistic basis of posterior PVRs during PVI without MED; but as previously indicated, these data were not available.
Because this was a retrospective analysis, the hypothesis that MED improves posterior wall lesion durability is susceptible to confounding factors. Accordingly, we tried to minimize their potential influence. First, we used deflectable sheaths in all procedures since the mid-to-late 2000s—long before the first index procedures of the Control group were performed. Second, it is true that force-sensing catheters were introduced into our clinical practice midway through this patient experience; indeed, force-sensing catheters had become our ablation tool of choice by the time we instituted MED into our routine practice. However, when we sub-categorized our Control cohort into the ControlNoForce and ControlForce groups, the posterior wall PVR rates (17.7% and 22.5%, respectively) were not statistically different (P = 0.509) between groups. And importantly, the substantially lower posterior PVR rate in the MEDForce group (2%) was significantly lower than both Control groups (P = 0.004 and 0.003, respectively).
Another important indicator that the difference in posterior PVR rates is truly related to MED, as opposed to a simple overall improvement in operator experience is the data regarding anterior wall PVR. If other variables were operative, one would not have expected the anterior wall PVR rates to be statistically similar between the MED and Control groups (8% and 3.5%, respectively; P = 0.136). These data strongly suggest that it was indeed MED that accounted for the improvement in posterior PVR rates. But interestingly, there did appear to be significant difference in anterior PVR rates between ControlNoForce and ControlForce—2.4% and 10%, respectively (P = 0.036). We believe this paradoxical poorer outcome with ControlForce to be related to procedural modifications implemented around the time force-sensing catheters entered our clinical practice. In brief, in our zeal to incorporate more atrial septal tissue anterior to the right PVs into the PVI lesion set, we may have inadvertently increased the difficultly in achieving a durable anterior linear lesion. That is, when the right anterior lesion set is placed too far away from the PVs, the tissue can be quite thick. Indeed, in some instances, ablation from the right atrial septum becomes necessary to achieve transmurality.10
In toto, the reduction of posterior PVRs with MED did improve the overall rate of durably isolated PV pairs from between 67.5% (ControlForce) and 79.9% (ControlNoForce) to 90% in the MEDForce group (Figure 4). Furthermore, the differences in rates of redo procedures between the cohorts are compelling: unlike the similar redo procedure rates between the ControlNoForce (17.2%) and ControlForce (17.5%) groups, the redo procedure rate was significantly less in the MEDForce group (9.2%; P = 0.002 and P = 0.024, respectively). And importantly, the time transpiring between the first and second procedures was similar between groups—indicating that the differences in clinical success are best explained by improved durability of PV isolation with MEDForce.

Anterior wall and total PV reconnection rates. The bar charts show the comparison of anterior and total (composite of anterior plus posterior) PVR rates between the MEDForce and Control groups, as well as the corresponding P-values. MED, mechanical oesophageal deviation; PV, pulmonary vein; PVR, pulmonary vein reconnection.
Consistent with our data is another recent retrospective report in which patients undergoing AF ablation with MED were compared with a historical cohort of patients ablated without MED.11 There were significantly fewer LET rises in the MED than non-MED group (3% vs. 79.4%, respectively, P < 0.001). That study did not report the results of redo procedures, so one cannot infer any mechanistic understanding of how MED affected lesion durability. However, the 1-year rate of AF recurrence with MED (23.3%) was improved relative to the non-MED (33.3%) cohort (P = 0.05).
Limitations
Despite our attempt to account for potential confounders, the retrospective nature of this analysis limits the robustness of our conclusions. However, it is unlikely that a fully powered prospective randomized trial of the impact of MED on posterior LA ablation durability would be performed (see Supplementary material online). Accordingly, retrospective data such as ours and Parikh et al. will likely be the only data available.
During MED, the power delivered to the posterior wall was not reduced; however, we cannot precisely quantify this since detailed RF biophysical data were not collected. Also, some electrophysiologists have begun using alternative power titration strategies during posterior wall ablation (e.g. 50 Watts, short-duration lesions). However, the lesion durability of this approach appears limited: in a recent series of 51 patients employing this power titration strategy, all redo patients had at least one PVR.12
The differential rate of redo procedures between groups is compelling, but it should be understood that this is not the same as AF recurrence. That is, the reason to undertake a redo procedure requires AF recurrence, but includes other factors such as the burden of AF which would affect the level of symptomaticity, the frame of mind of the patient, etc. On the other hand, the redo procedure rate is arguably the most relevant outcome parameter because it integrates all this information to a clinically relevant outcome is the AF recurrence so bad as to warrant a second procedure? Also, the retrospective nature of our analysis minimizes the chance of physician bias into whether a patient is referred for a redo procedure.
When assessing the risk-benefit relationship of MED, in addition to improved lesion durability, one must consider that: (i) each MED technique has its own potential safety issues such as oropharyngeal trauma and oesophageal mucosal abrasions (or potentially tears) and (ii) to date, all MED approaches require the use of general anaesthesia, which may not be common practice during AF ablation procedures in certain geographies. If the lab does not typically employ anaesthesia during AF ablation, adding it just to allow MED would impose additional logistical and time hurdles, Also, this manuscript did not address the effectiveness of MED, any potential ameliorative effect on oesophageal lesions by endoscopy, or the ideal luminal temperature cut-off that should be employed with MED.
The improved durability observed with MED is only safe if the oesophagus is actually displaced from the ablation sites. Accordingly, it must be emphasized that contrast should be instilled into the oesophageal lumen to delineate the trailing edge. Otherwise, MED may create a false sense of security, potentially worsening outcomes. Similarly, there is no reason to expect MED to have any beneficial effects on non-oesophageal complications such as damage to the bronchi. And finally, it remains an open question as to whether the use of novel temperature probes during AF ablation procedures would similarly improve lesion durability.
Conclusions
As compared with the use of oesophageal temperature monitoring alone, MED during AF ablation improves the durability of the pulmonary vein isolation lesion set along the posterior left atrial wall.
Conflicts of interest: Drs. S.R.D., A.J.M., and V.Y.R. hold equity interest in Manual Surgical Sciences Inc.; Dr V.Y.R. also holds equity interest in Circa Scientific Inc., and serves as a consultant to and receives grant support from Biosense-Webster Inc. and Abbott Inc. Dr V.Y.R. also has conflicts of interest with other companies not related to this manuscript; a comprehensive list is in the Supplementary material online, Appendix.
