


Abstract
Besides providing mechanical stability, fibroblasts in the heart could modulate the electrical properties of cardiomyocytes. Here, we aim to develop a three-dimensional hetero-cellular model to analyse the electric interaction between fibroblasts and human cardiomyocytes in vitro using selective optogenetic de- or hyperpolarization of fibroblasts.
NIH3T3 cell lines expressing the light-sensitive ion channel Channelrhodopsin2 or the light-induced proton pump Archaerhodopsin were generated for optogenetic depolarization or hyperpolarization, respectively, and characterized by patch clamp. Cardiac bodies consisting of 50% fibroblasts and 50% human pluripotent stem cell-derived cardiomyocytes were analysed by video microscopy and membrane potential was measured with sharp electrodes. Myofibroblast activation in cardiac bodies was enhanced by transforming growth factor-β1 (TGF-β1)-stimulation. Connexin-43 expression was analysed by qPCR and fluorescence recovery after photobleaching. Illumination of Channelrhodopsin2 or Archaerhodopsin expressing fibroblasts induced inward currents and depolarization or outward currents and hyperpolarization. Transforming growth factor-β1-stimulation elevated connexin-43 expression and increased cell–cell coupling between fibroblasts as well as increased basal beating frequency and cardiomyocyte resting membrane potential in cardiac bodies. Illumination of cardiac bodies generated with Channelrhodopsin2 fibroblasts accelerated spontaneous beating, especially after TGF-β1-stimulation. Illumination of cardiac bodies prepared with Archaerhodopsin expressing fibroblasts led to hyperpolarization of cardiomyocytes and complete block of spontaneous beating after TGF-β1-stimulation. Effects of light were significantly smaller without TGF-β1-stimulation.
Transforming growth factor-β1-stimulation leads to increased hetero-cellular coupling and optogenetic hyperpolarization of fibroblasts reduces TGF-β1 induced effects on cardiomyocyte spontaneous activity. Optogenetic membrane potential manipulation selectively in fibroblasts in a new hetero-cellular cardiac body model allows direct quantification of fibroblast–cardiomyocyte coupling in vitro.
A novel hetero-cellular cardiac tissue model was established, which allows quantification of electric interaction between fibroblasts and human cardiomyocytes in vitro using cell type specific optogenetic manipulation of membrane potential.
Activation of fibroblasts by transforming growth factor-β1 (TGF-β1)-stimulation enhanced cellular coupling leading to depolarization and accelerated spontaneous beating of cardiomyocytes in the tissue model.
Two fibroblast cell lines expressing either the light-sensitive ion channel Channelrhodopsin2 or the light-induced proton pump Archaerhodopsin were generated and showed light-induced inward currents with depolarization or outward currents with strong hyperpolarization.
After TGF-β1-stimulation, selective optogenetic depolarization or hyperpolarization of fibroblasts in the tissue model directly modulated cardiomyocytes membrane potential and accelerated or blocked spontaneous beating, respectively. Without TGF-β1-stimulation, fibroblasts membrane potential alterations had minor effects on cardiomyocytes.
Introduction
Cardiac fibrosis is characterized by excessive proliferation of cardiac fibroblasts within the myocardium of the ageing heart or after cardiac pathologies such as pressure overload, myocardial infarction, and heart failure. Under these circumstances, a local immune response with increased levels of transforming growth factor-β1 (TGF-β1) and other pro-inflammatory signalling molecules triggers fibroblasts to proliferate and to be transformed to a state termed ‘activated myofibroblasts’.1 In contrast to cardiac fibroblasts at rest, activated myofibroblasts express α-smooth-muscle-actinin, produce large amounts of extracellular matrix, and have increased expression levels of the gap junctional protein connexin-43.1–3 Importantly, the resulting structural changes of cardiac fibrosis are not only the hallmark but can also cause and worsen the outcome of cardiac pathologies. For example, accompanying stiffening of the myocardium impairs diastolic relaxation and the appearance of activated myofibroblasts is associated with higher risk for cardiac arrhythmias.4 This can be explained by decreased conduction velocity and elevated resting membrane potential (RMP) of the cardiomyocytes.5 Therefore, the fibrotic myocardium is prone to initializing and maintaining potential lethal arrhythmias such as ventricular tachycardia and fibrillation.
In principle, two different mechanisms could cause the electrophysiological changes within the myocardium during cardiac fibrosis: (i) effects on cardiomyocytes could be indirect through the electrical isolation through excessive extracellular matrix deposition, higher numbers of non-excitable cells, or paracrine effects affecting the electrophysiological properties of the cardiomyocytes. (ii) Myofibroblasts could also directly affect the electrical properties of cardiomyocytes through electrical coupling via gap junctions. Compared to cardiomyocytes, myofibroblasts are considered to have elevated membrane potentials6,7 although this was yet not proven in the heart in vivo.
Thus a hetero-cellular coupling would directly depolarize cardiomyocytes resulting in inactivation of Na+ channels and slower conduction, which could add to the pro-arrhythmic effects of fibrosis. In fact, several studies could convincingly demonstrate high dynamic electrotonic coupling between fibroblasts and cardiomyocytes in vitro and the resulting direct influence on cardiomyocytes function.7–10
These studies have measured the direct coupling in cell models by the patch-clamp technique7 or by quantitative dye transfer,10 or have performed voltage imaging and measurement of conduction velocity in vitro.7 Importantly, most reports are based on two-dimensional cultures on monolayers neglecting the potentially higher effect of three-dimensionality in cardiac tissue. In addition, the described models require laborious experimental setups which are not transferable into in vivo or whole organ settings.11
Recently, fibroblast specific expression of a voltage indicator was used to estimate the membrane potential changes of fibroblasts within the intact mouse heart. Thereby Quinn et al. could show that the cardiomyocytes action potential leads to passive membrane potential changes within a fibrotic scar tissue after myocardial infarction.12 Despite this general proof for hetero-cellular coupling in infarcted hearts in vivo showing the effects of cardiomyocytes on the membrane potential of fibroblasts, the applied imaging tools are not suited to quantify the level of direct electrical influence of fibroblasts on cardiomyocytes in myocardial tissue and intact hearts.11 However, quantification of the impact of hetero-cellular coupling on cardiomyocytes within a functional syncytium is essential for mechanistic understanding and to be able to screen for treatment options for interstitial fibrosis which is the highly pro-arrhythmogenic surrogate in end stage heart failure and atrial fibrillation.4
In contrast to electrical or pharmacological stimulation, optogenetics allows the cell type selective de- and hyperpolarization in hetero-cellular environments either by choosing specific promoters or by establishing transgenic cell lines and co-culture with non-transgenic cells. This approach was elegantly applied for indirect pacing or electrical silencing of cardiomyocytes within a monolayer in co-culture with fibroblasts13 expressing the light-gated channel channelrhodopsin 2 (ChR2) for depolarization or the light-driven proton pump ArchT for hyperpolarization.
In this report, we demonstrate a new approach to prove and quantify the direct influence of fibroblasts on the electrical behaviour of cardiomyocytes in three-dimensional cardiac tissue generated in vitro. Taking advantage of fibroblast specific manipulation of the membrane potential by optogenetic stimulation and analysing the influence on cardiomyocytes, we are able to quantify the effect of fibroblast–cardiomyocyte coupling on spontaneous activity as a surrogate parameter of ectopic activity triggering arrhythmia. In addition this system allows straight forward investigation of modulators of fibroblast–cardiomyocyte coupling, which we could show by application of TGF-β1, known to up-regulate connexin-43 expression in myofibroblasts.7
Methods
Generation of ChR2-mCherry and ArchT-eYFP expressing vectors
To express ChR2 in fusion to mCherry in fibroblasts under control of the β-chicken actinin (CAG) promoter, the CMV promoter in the pcDNA3.1/hChR2(H134R)-mCherry vector14 (gift from Karl Deisseroth, Addgene plasmid #20938) was excised by NdeI-SacI and replaced with the CAG promoter (chicken β-actin promoter with CMV enhancer; 1.7 kbp SpeI-SacI fragment) from the pCIG2 plasmid (provided by C. Schuurmans, University of Calgary). The CAG ArchT/eYFP Plasmid was obtained by inserting the BamHI/EcoRI ArchT-eYFP fragment from pAAV-CaMKIIa-eArch 3.0-eYFP15 (gift from Karl Deisseroth, Addgene plasmid #35516) into a plasmid containing the CAG promoter, and a neomycin resistance cassette as described earlier.16 Cloning was verified by sequencing. Before transfection, ChR2-mCherry plasmids and ArchT-eYFP plasmids were linearized with PvuI.
Transgenic NIH3T3 cell line generation and cell culture
NIH3T3 fibroblasts were cultured in 3T3 medium comprising Dulbecco’s modified eagle medium (DMEM, Thermo Fischer) with 10% foetal calf serum (Promega), 0.1 mM non-essential amino acids (Invitrogen), 50 μg/mL penicillin and streptomycin (Invitrogen), 0.1 mM β-mercaptoethanol (Sigma) in T25 cell culture flasks (Falcon) at 37° and 5% CO2. Dissociation of cells was performed with 1 mL of 0.05% Trypsin-EDTA (Gibco life technologies) for 3–5 min. To express the optogenetic proteins, fibroblasts were lipofected using FuGene® (Promega) and transfected cells were selected with 900 µg/mL neomycin (Gibco life technologies) for 7 days (medium changed daily) and 600 µg/mL for maintenance. Additional purification was achieved by fluorescence assisted cell sorting (FACS) for mCherry- or eYFP-signals with a CyFlow Space FACS (Partec GmbH, Görlitz, Germany) equipped with a 561 nm laser and 590 ± 50 nm emission filter for mCherry and a 488 nm laser and 536 ± 20 nm emission filter for eYFP. Gating setting for selection of mCherry or eYFP positive cells were determined with wild-type cells. The sorting process was repeated with intermitting culture steps until purity ≥ 80% was achieved. TGF-β1 stimulation of single fibroblasts for patch-clamp analysis, quantitative polymerase chain reaction (qPCR) or fluorescence recovery after photobleaching (FRAP) experiments was performed with 4 ng/mL human TGF-β1 (PeproTech) added to the medium 3 days before experiments while experiments have been performed in TGF-β1 free solution.
Fluorescence recovery after photobleaching
ArchT-eYFP expressing fibroblasts were plated on 0.1% gelatine-coated glass cover slips and cultured for 3 days to achieve ∼80% confluence in a 2D monolayer. Cells were loaded with the gap junction permeable fluorescence dye Calcein-AM Red-Orange (0.38 µM, Invitrogen) for 20 min at 37°C and measurements were performed in external solution (see below) at room temperature. FRAP analysis was performed with an Eclipse Ti confocal microscope (Nikon) with a 40× objective (CFI Apo Lambda S LWD 40XWI, NA 1.25). Cell borders were visualized by eYFP signals and single cells were defined for bleaching. Pictures were captured before bleaching for basal fluorescence intensity. Bleaching was performed by a 561 nm laser for 5 s at 2.5 mW, fluorescence intensity of selected cells were measured every 15 s for 1000 s and converted to values between 1 (intensity before bleaching) and 0 (intensity directly after bleaching).
Patch-clamp experiments
Twenty-four hours before dissociation, medium was changed to 3T3 medium without neomycin. After dissociation 2 × 10⁴ fibroblasts were plated on 22 × 22 mm glass coverslips coated with 0.1% gelatin. Patch-clamp experiments were performed 4–36 h after plating at 37° C using an EPC10 amplifier (Heka), an external solution containing 140 mM NaCl, 5.4 mM KCl, 1.8 mM CaCl2, 2 mM MgCl2, 10 mM glucose, and 10 mM Hepes (pH 7.4, NaOH) and an internal solution comprising 12 mM NaCl, 20 mM KCl, 110 mM K-aspartate, 1 mM CaCl2, 1 mM MgCl2, 2 mM K2ATP, 10 mM EGTA, and 10 mM HEPES (pH 7.2, KOH). The RMP was measured in current clamp mode without current injection and corrected for calculated liquid junction potential (JPCalc within pClamp 10.2, Axon Laboratory). Light-induced currents were measured at a holding potential of −53 mV and analysed by averaging the amplitudes during the last 975 ms of a 1.5 s light pulse and subtracting average currents 500 ms before illumination. Analysis of light-induced depolarization by ChR2 was performed at a membrane potential set to −43 mV using current injection with the low frequency voltage clamp method (Patchmaster software, Heka) because RMP of isolated fibroblasts was close to the reversal potential of ChR2. ArchT-induced hyperpolarization was measured without current injection. Membrane potential change was quantified by calculating the difference of average membrane potential before illumination and during the last 650 ms of a 1 s light pulse. Data were analysed offline using the Fitmaster Software (Heka).
Light application
Precise light application was achieved with temperature-controlled light-emitting diode modules (LEDMOD LAB 470 nm for ChR2-experiments/LEDMOD LAB 535 nm for ArchT experiments, Omicron Laserage), coupled via optical fibres (2 mm diameter, NA: 0.5) and a dual port condenser (Till Photonics) into an Axiovert 200 microscope (Zeiss). Light was focused on the samples through a 20× Fluar objective (numerical aperture: 0.75, Zeiss) for patch-clamp experiments and 10× Fluar objective (numerical aperture: 0.5, Zeiss) for frequency recordings and sharp electrode measurements. Light pulses were controlled by the patch-clamp amplifier or an isolated pulse stimulator (Model 2100, A-M Systems). Light sensitivity was determined using 21–25 increasing light steps for ChR2 from 0 to 8 mW/mm2 and for ArchT from 0 to 14 mW/mm2. Light intensity was calibrated by measuring the light power at the focal plane (PM100 powermeter and S130A sensor, Thorlabs) divided by the size of the illuminated field.
Inhibition of fibroblast proliferation
Proliferation of fibroblasts was inhibited 24 h before cardiac body generation by incubating cells with 1.2 µg/mL mitomycin c (Sigma Aldrich) for 2 h and subsequent three washing steps with PBS. Successful inhibition was tested by plating 105 cells per well of a 24 well plate with or without 4 ng/ml human TGF-β1 and cell counting after 7 days using Trypsin dissociation and a Neubauer chamber. Medium was changed every second day.
Establishment of three-dimensional cardiomyocyte-fibroblast co-culture
The commercial human cardiomyocytes used in the study (Cor.4U©, NCardia/Axiogenesis AG) were believed to be derived from human induced pluripotent stem cells during the studies. After the studies had been completed, short tandem repeat testing by NCardia determined that Cor.4U© cardiomyocytes were derived from the human embryonic stem cell line RUES2. The different provenience of these well-characterized cardiomyocytes does neither change our findings nor the interpretation of our data.
Cor.4U© cardiomyocytes were delivered non-frozen in T25-flasks containing Cor.4U© medium and were dissociated as described earlier17 and according to the manufacture’s protocol. For cardiac body generation, proliferation-inhibited fibroblasts were dissociated with Trypsin, resuspended in Cor.4U© medium and mixed with dissociated Cor4U© cells at a ratio of 1:1. From this suspension, hanging drops were generated by pipetting 20 µL drops containing a total number of 4000 cells on a 10 cm plastic dish with subsequent incubation upside down at 37°C and 5% CO2. After 3 days, cardiac bodies were washed, individually plated on fibronectin (10 µg/mL, Sigma) coated glass cover slips and incubated in Cor4U© medium for 3–8 days after plating. For TGF-β1 stimulated cardiac bodies, 4 ng/mL human TGF-β1 (PeproTech) was added to hanging drops and to plated cardiac bodies for at least 6 days before the experiments.
Frequency recordings
Spontaneous beating frequency was measured by infrared video microscopy as described earlier16 in Tyrode solution (140 mM NaCl, 4.4 mM KCl, 1.8 mM CaCl2, 2 mM MgCl2, 10 mM glucose, and 10 mM Hepes, pH 7.4 with NaOH) at 37°C. Beating areas were recorded with a CCD camera (Basler piA640-210gm) and analysed online with custom-written software (Labview 8.1 and IMAQ, National Instruments) using changes in pixel-intensity to determine contraction events.16 Optogenetic stimulation of cardiac bodies was performed with alternating increasing or decreasing light intensities (20 steps from 0 to 4 mW/mm2 for ChR2 and from 0 to 10 mW/mm2 for ArchT) for 20 s every 50 s. Normalized frequency was calculated by averaging the frequency during the first 10 s of illumination divided by the average frequency 10 s before illumination. If there was no beat during illumination (e.g. strong effect of ArchT-induced hyperpolarization, see Figure 6), the frequency was set to 0.
Sharp electrode measurement
The membrane potential of cardiomyocytes within cardiac bodies was measured in Tyrode solution with high resistance (60–120 MΩ filled with 3 M KCl) sharp microelectrodes (1B100F-4, World Precision Instruments), pulled with a P1000 puller (Sutter Instruments) and impaled with 5–10 μm steps at ∼100 mm/s piezo speed by a DC3001 micromanipulator with a SYS-MPM10 piezo-translator (World Precision Instruments). After amplification with a bridge amplifier BA-03X (npi electronics) membrane potentials were digitized with an EPC10 amplifier (Heka). Cardiomyocytes were identified by having a RMP lower than −30 mV. Optogenetic stimulation was performed by illumination for 20 s with different light intensities every 50 s. Resting membrane potential was analysed using LabChart 7 (ADInstruments).
Quantitative PCR and immunohistochemistry
For gene expression analysis, mRNA was isolated with the RNeasy® micro kit (Quiagen) and analysed by a Bioanalyzer 2100 (Agilent Technologies). Only samples with a RNA integrity number higher than 8.5 have been included in further experiments to ensure high quality mRNA. Quantitative PCR has been performed on a Rotor-Gene© 6000 quantitative PCR cycler (Corbett Life Science) using TaqMan© Gene Expression Assays (Mm01179639_s1 for connexin-43/GJA1 and Mm99999915_g1 for GAPDH, Thermo Fischer). Expression relative to GAPDH housekeeping was calculated using the 2-ΔCT method and normalization to average values of non-stimulated fibroblasts.
For immunohistochemistry, cells and cardiac bodies were washed with PBS, fixated with 4% formaldehyde (ITW Reagents) for 20 min at room temperature and permeabilized in 0.25% Triton X in PBS. Unspecific binding sites were blocked by 5% donkey serum for 1 h at room temperature and staining was performed over night at 4°C using primary antibodies against α-actinin (1:400, Sigma-Aldrich) and α-smooth-muscle-actin (1:800, Sigma). Appropriate Cy3- and Cy5-conjugated secondary antibodies (1:400, Jackson ImmunoResearch) were applied for 1 h at room temperature. Nuclear staining was performed with Hoechst 33342 dye (Sigma Aldrich, 1 mg/mL). Pictures were taken with an inverted fluorescence microscope (Axio Imager with ApoTome optical sectioning module; Zeiss) with a 20×, 40×, or 63× objective, AxioCam MRm camera, AxioVision (Zeiss) and Hoechst 33342 dye (F36-500), eYFP (D64-002), TRITC (F36-503), mCherry (F46-008), or Cy5 (F36-523) filter sets (all from AHF Analysentechnik).
Statistics
Statistical analysis was performed with Graphpad Prism 5 (GraphPad Software Inc.). Individual groups were compared using unpaired, two-sided Student’s t-test to analyse the effects of TGF-β1 treatments and paired two-sided Student’s t-test was used to compare effects before and during illumination. Frequency alteration in ArchT-expressing cardiac bodies (Figure 6D) was analysed by a Mann–Whitney test with Gaussian approximation because of the non-normal distribution of data. Membrane potential change upon illumination was analysed by paired one-sided Student’s t-test (Figure 7D). A P-value of ≤0.05 was considered significant. All graphs show individual data points and mean lines with error bars representing S.E.M.
Results
Establishment of three-dimensional cardiomyocyte-fibroblast co-cultures
To create a three-dimensional model of cardiac tissue with interstitial fibrosis, we established cardiac bodies by co-culture of fibroblasts and cardiomyocytes in a 1:1 ratio using the hanging drop method. Fibroblasts were activated with TGF-ß1 known to trigger cardiac fibrosis in vivo18 and to induce the myofibroblasts phenotype in vitro.7 To exclude effects by cell proliferation affecting hetero-cellular ratio, the fibroblasts were treated with mitomycin c (Figure 1A) prior to cardiac body generation. Fibroblasts and cardiomyocytes formed compact cardiac bodies (Figure 1B) within 3 days and immunohistochemical staining revealed connexin-43 expression in both cell types and suggested hetero-cellular gap junction formation at the fibroblast–cardiomyocyte interface (Figure 1C).
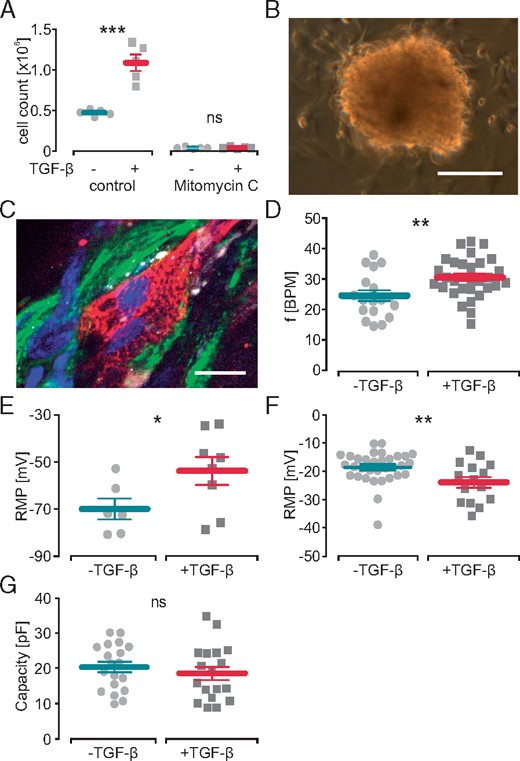
Effect of TGF-β1 on cardiomyocytes in hetero-cellular cardiac bodies and on isolated fibroblasts. (A) Cell numbers of control and mitomycin c treated fibroblasts analysed by cell counting after 7 days of incubation with TGF-β1 (n = 5, P = 0.0004 control, P = 0.78 mitomycin c). (B) Image of a hetero-cellular cardiac body 3 days after plating (scale bar 200 µm). (C) Immunohistochemical staining of a cardiac body against connexin-43 (white) showing gap junction formation at the interface between transgenic ArchT-eYFP fibroblasts (green) and α-actinin (red) positive cardiomyocytes (nuclear staining in blue, scale bar 20 µm). (D, E) Effect of TGF-β1 on the spontaneous beating rate (D, n = 30, P = 0.006) and cardiomyocyte RMP (E, n = 6 control, n = 8 TGF-β1, P = 0.032) of cardiac bodies. Effect of TGF-β1 on isolated fibroblasts RMP (F, n = 33 control, n = 15 TGF-β1, P = 0.007) and cell size indicated by membrane capacity (G, n = 19 control, n = 18 TGF-β1, P = 0.46). RMP, resting membrane potential; TGF-β1, transforming growth factor-β1.
Transforming growth factor-β1 increases spontaneous beating rate of cardiac bodies
Spontaneous beating rate of plated cardiac bodies was 24.6 ± 1.8 beats per minute (BPM) in controls and significantly increased to 30.5 ± 1.2 BPM after TGF-β1 stimulation (Figure 1D). To determine the underlying mechanism, we measured the RMP of cardiomyocytes within intact cardiac bodies by impaling sharp microelectrodes. TGF-β1 stimulation significantly elevated the RMP in cardiomyocytes by 16.2 mV compared to non-stimulated controls (Figure 1E). Patch-clamp analysis of isolated 3T3 fibroblasts showed that TGF-β1 stimulation significantly reduced the RMP compared to non-treated controls (Figure 1F) and did not alter cellular capacitance indicating similar cell size (Figure 1G). Thus the isolated effects of TGF-ß1 on fibroblasts would not lead to the observed increase in RMP and beating frequency of the cardiomyocytes within cardiac bodies.
Transforming growth factor-β1 increases functional coupling between fibroblasts
Because it is known that TGF-β1 enhances cellular coupling between fibroblasts and cardiomyocytes,7 we next measured the effect on connexin-43 expression and function in 3T3 fibroblasts. Incubation with TGF-β1 led to ∼3 times elevated levels of connexin-43 mRNA (Figure 2A). Functional consequence on cell–cell coupling was analysed by fluorescence recovery after photobleaching experiments on two-dimensional monolayers of fibroblasts (Figure 2B–D). In line with higher connexin-43 expression, incubation with TGF-β1, accelerated fluorescence recovery after bleaching compared to untreated controls (Figure 2D). Thus the observed RMP elevation and faster beating of cardiomyocytes within cardiac bodies could be explained by enhanced hetero-cellular coupling of the relatively depolarized fibroblasts to cardiomyocytes. However, indirect and longer lasting paracrine effects of the fibroblasts on the cardiomyocytes as well as direct effect of TGF-β1 on the cardiomyocytes cannot be excluded at this stage.
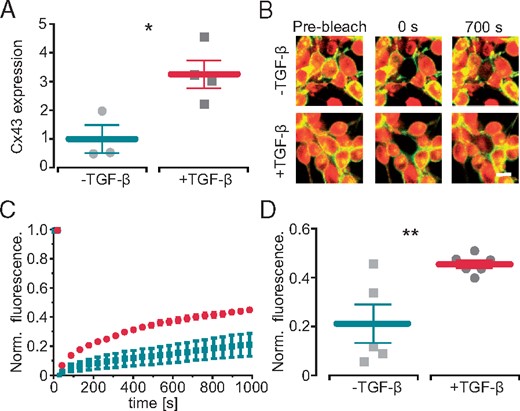
TGF-β1 increases functional coupling between fibroblasts. (A) Effect of TGF-β1 on relative connexin-43 (Cx43) expression in fibroblasts (n = 3 control, n = 4 TGF-β1, P = 0.02). (B) Representative example of a fluorescence recovery after photobleaching experiment in ArchT-eYFP fibroblasts without (top) and with (lower) TGF-β1 (central cell was bleached, yellow eYFP, red Calcein AM, scale bar 10 µm). (C) Recovery of fluorescence signals in control (turquoise) and TGF-β1 treated (red) fibroblasts over time. (D) Statistical analysis of fluorescence recovery 1000 s after bleaching (n = 5 control, n = 6 TGF-β1, P = 0.009). TGF-β1, transforming growth factor-β1.
Establishment of optogenetic control of fibroblast membrane potential
To directly prove a primary effect of fibroblasts membrane potential on cardiomyocytes’ RMP by hetero-cellular coupling, we established selective optogenetic control of membrane potential in fibroblasts within the three-dimensional cardiac bodies. Fibroblast specific depolarization by light was achieved by generating a transgenic 3T3 cell line overexpressing ChR2, a blue light-gated cation channel19 in fusion to mCherry under the control of the CAG promoter (Figure 3A). Because liposome-based transfection and subsequent selection with neomycin resulted only in <25% ChR2-mCherry positive cells, we performed additional rounds of purification by fluorescence assisted cell sorting (FACS) resulting in 81.3% positive cells (Figure3B and C). For light-induced hyperpolarization, we expressed ArchaerhodopsinT3.0 (ArchT), a green light-driven outward directed proton pump15 in fusion to eYFP in 3T3 cells and FACS-purified them to 96.9% positive cells (Figure 3D–F). To validate function of the optogenetic proteins, light-induced currents and RMP changes were measured in single fibroblasts by patch-clamp experiments. ChR2-mCherry expressing fibroblasts responded to blue illumination (470 nm) with inward currents and depolarization (Figure4A and B) with a maximal steady state current density of −1.71 ± 0.31 pA/pF and maximal depolarization of 18.5 ± 3.1 mV at 8.0 mW/mm2. ArchT-eYFP expressing fibroblasts responded to green illumination (535 nm) with outward currents and hyperpolarization (Figure4C and D) with a maximal current density of +1.60 ± 0.26 pA/pF and maximal hyperpolarization of −28.9 ± 5.8 mV at 14 mW/mm2. Importantly, light-induced depolarization and hyperpolarization could be precisely controlled by gradually changing the light intensity. For the ChR2-mCherry cell line, the dose–response analysis resulted in a half maximal effective light intensity (eLi50) of 0.79 ± 0.12 mW/mm2 and 0.87 ± 0.23 mW/mm2 for inward current and depolarization, respectively. Because ArchT is a non-saturating proton pump, increasing light intensities did not lead to a plateau (Figure4C and D) making eLi50 calculations impossible. Important to the subsequent optogenetic analysis of TGF-β1 effects, we found that neither ChR2-induced inward current and depolarization, nor ArchT-induced outward current and hyperpolarization in 3T3 fibroblasts were affected by TGF-β1 incubation (Figure 4E–H).
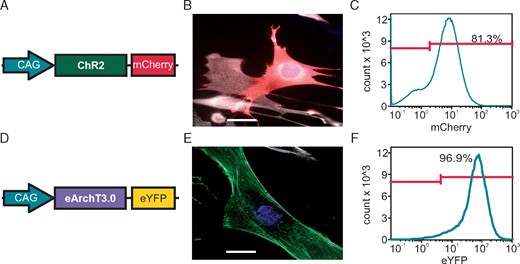
Generation of transgenic NIH 3T3 fibroblast cell lines for selective optogenetic stimulation. (A) Scheme of the plasmid for expression of ChR2 in fusion to mCherry under the control of the CAG promoter. (B) ChR2-mCherry signals (red) in a transfected fibroblast (α-smooth-muscle-actin: white, scale bar 10 µm). (C) FACS profile with percentage of ChR2-mCherry positive cells. (D) Scheme of the plasmid for expression of ArchT in fusion to eYFP under the control of the CAG promoter. (E) ArchT eYFP signals (green) in a transfected fibroblast (α-smooth-muscle-actin: white; scale bar: 10 µm). (F) FACS profile with percentage of ArchT-eYFP positive cells. FACS, fluorescence assisted cell sorting.
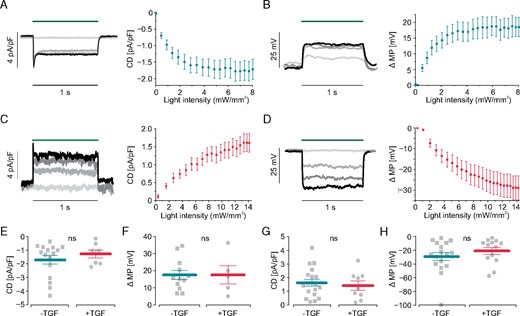
Electrophysiological characterization of transgenic fibroblast cell lines. (A–D) Light-induced current densities (CD) and membrane potential change (ΔMP). Representative traces with increasing light intensities in colors (blue - dark green - red - light green) on the left. Statistical analysis on the right. In ChR2 fibroblasts illumination with blue light (470 nm, green bar) induces inward currents (A, original traces for: 0.01, 2.1, 4.4, 8.0 mW/mm2, n = 16) and (B) depolarization (original traces for: 0.54, 2.1, 3.7, 6.6 mW/mm2, n = 10). In ArchT-expressing fibroblasts green light (535 nm, green bar) induces outward current (C, original traces for: 0.4, 4.6, 9.2, 13 mW/mm2, n = 18) and hyperpolarization (D, original traces for 0.30, 4.4, 8.2, 11 mW/mm2, n = 13). (E–H) Influence of TGF-β1 stimulation on light-induced currents and membrane potential change. Maximal current densities of inward currents (E, n = 16 control, n = 7 TGF-β1, P = 0.40) and depolarization (F, n = 10 control, n = 5 TGF-β1, P = 0.88) in ChR2 mCherry fibroblasts. Maximal current densities (G, n = 18 control, n = 9 TGF-β1, P = 0.64) and hyperpolarization (H, n = 14 control, n = 13 TGF-β1, P = 0.32) in ArchT eYFP fibroblasts. TGF-β1, transforming growth factor-β1.
Light-induced fibroblast depolarization increases cardiac body beating frequency
The direct electrophysiological influence of fibroblast depolarization on cardiomyocytes was analysed in cardiac bodies generated with non-transgenic cardiomyocytes and transgenic ChR2-mCherry fibroblasts. These cardiac bodies showed bright mCherry signals (Figure 5A) and illumination (470 nm, 4 mW/mm2) increased their spontaneous beating rate instantaneously, which returned to basal levels after termination of illumination (Figure 5B). The rate increasing effect was depending on the applied light intensity with an eLi50 of 1.3 ± 0.7 mW/mm2 (n = 5, Figure 5C). Importantly, cardiac bodies treated with TGF-β1 showed a significantly higher maximal effect (normalized rate: 1.75 ± 0.13) than untreated controls (1.30 ± 0.09, Figure 5D) while eLi50 was similar (0.8 ± 0.5 mW/mm2, n = 7, Figure 5C). The fact that these eLi50 values were in the range of the eLi50 of the fibroblast’s ChR2 current suggests a neglectable effect of light attenuation in the cardiac body. Importantly, illumination of control cardiac bodies generated with non-transgenic fibroblasts did not affect beating rate, which proves the lack of a thermal effect (Figure 5E).
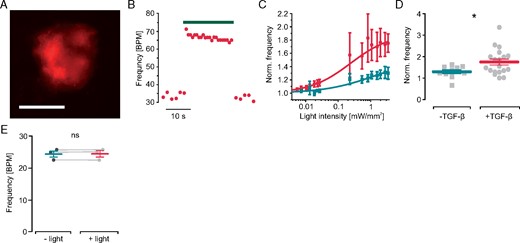
Effect of light-induced fibroblast depolarization on cardiac body beating frequency. (A) mCherry fluorescence (red) within a cardiac body generated with ChR2-mCherry fibroblasts (scale bar 200 µm). (B) Representative trace of spontaneous beating rate with illumination (green bar, 4.0 mW/mm2, TGF-β1 stimulated). (C) Normalized beating frequency after illumination with increasing light intensities in control cardiac bodies (green , n = 10) and after TGF-β1 stimulation (red, n = 16). (D) Maximal light-induced frequency increase in control (n = 10) and TGF-β1 treated cardiac bodies (n = 16, P = 0.03). (E) Light effect (470 nm, 4.0 mW/mm2) on spontaneous beating frequency in control cardiac bodies generated with wild-type fibroblasts (n = 3, P = 0.98). TGF-β1, transforming growth factor-β1.
Light-induced fibroblast hyperpolarization stops spontaneous activity of cardiac bodies
To investigate the effect of fibroblast hyperpolarization in a three-dimensional heart organoid, we generated cardiac bodies containing non-transgenic cardiomyocytes and ArchT-eYFP expressing fibroblasts (Figure 6A). Illumination with green light led to an immediate deceleration of spontaneous beating in a dose-dependent manner, which returned to basal levels after illumination (Figure6B,C). Overall the effect of green light was smaller without TGF-β1 treatment (Figure 6C), while all cardiac bodies treated with TGF-β1 stopped spontaneous beating completely upon illumination with high light intensities (Figure 6D).
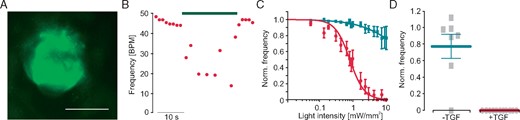
Effect of light-induced fibroblast hyperpolarization on cardiac body beating frequency. (A) eYFP fluorescence (green) within a cardiac body generated with ArchT-eYFP fibroblasts (scale bar 200 µm). (B) Representative trace of spontaneous beating rate with low intensity illumination (green bar, 0.4 mW/mm2, TGF-β1 stimulated). (C) Normalized beating frequency after illumination with increasing light intensities in control cardiac bodies (green, n = 10) and after TGF-β1 stimulation (red, n = 16). (D) Maximal light-induced frequency reduction in control (n = 10) and TGF-β1 treated cardiac bodies (n = 16, P = 0.03). TGF-β1, transforming growth factor-β1.
To directly show that fibroblast hyperpolarization would reduce the depolarizing effect of fibroblasts (Figure 1E) on cardiomyocytes, we measured action potentials in cardiac bodies with sharp microelectrodes during light-induced hyperpolarization of fibroblasts. Low intensity illumination of TGF-β1 treated cardiac bodies induced hyperpolarization within the cardiomyocytes slowing the spontaneous diastolic depolarization and decreasing the spontaneous beating frequency in a dose-dependent manner (Figure7A,B) similar to the effect on beating frequency observed by video microscopy (Figure 6C).
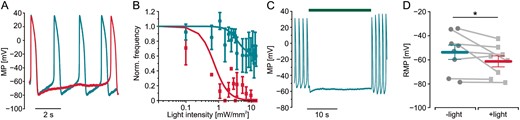
Modulation of cardiomyocyte membrane potential by hyperpolarization of fibroblasts in TGF-β1 stimulated cardiac bodies. (A) Membrane potential (MP) and overlay of action potentials of a cardiomyocyte within a TGF-β1 treated cardiac body generated with ArchT-eYFP fibroblasts before (green trace) and during low intensity illumination (red trace, 535 nm, 0.8 mW/mm2). (B) Normalized action potential frequency after illumination with increasing light intensities in control cardiac bodies (green, n = 1–6) and after TGF-β1 stimulation (red, n = 1–8). (C) Representative trace of cardiomyocyte MP in the same preparation with high intensity illumination (green bar, 10 mW/mm2). (C) Statistical analysis of experiments shown in (B) with RMP before and during illumination (n = 8, P = 0.049, 10 mW/mm2). RMP, resting membrane potential; TGF-β1, transforming growth factor-β1.
Higher light intensities (10 mW/mm2) completely blocked spontaneous beating (Figure 7C). Statistical analysis of the cardiomyocytes’ RMP in TGF-β1 stimulated cardiac bodies showed a significant reduction of 7.54 ± 9.35 mV (Figure 7D). Thus, fibroblast-specific hyperpolarization was able to partly counteract the TGF-β1—induced depolarization (Figure 1E) of cardiomyocytes within the cardiac bodies. This proves the direct electrophysiological influence of fibroblasts on cardiomyocytes which becomes even more important when fibroblasts are in a myofibroblast-activated state.
Discussion
In this report, we established a new method to quantify the electrical coupling between fibroblasts and cardiomyocytes in a three-dimensional cardiac tissue model of interstitial fibrosis in vitro. The selective optogenetic stimulation of fibroblasts within cardiac bodies with fine grain control of membrane potential using calibrated light intensities was able to prove enhanced functional hetero-cellular coupling between fibroblasts and cardiomyocytes by TGF-β1 treatment.
In contrast to an earlier report7 showing that TGF-β1 leads to enhanced currents and depolarization in cultured neonatal rat ventricular myofibroblasts, we did not observe such effects in fibroblasts from the NIH 3T3 cell line which rather showed a slight hyperpolarization by TGF-β1 (Figure 1F) despite TGF-β1 duration and concentration was similar (4 ng/mL for 3 days in our experiments, 2.5 ng/mL for 1–2 days in Salvarani et al.7). This could be due to the different cell source, altered myofibroblast-like pre-activation or the four-fold difference in size (cellular capacitance ∼80 pF in rat ventricular myofibroblasts,7 ∼20 pF in NIH 3T3 fibroblasts, Figure 1G). Interestingly, TGF-β1 stimulation led to a similar increase of connexin-43 expression levels in rat ventricular myofibroblasts (1.77-fold)7 and NIH 3T3 fibroblasts (3.25-fold, Figure 2A). In accordance to the earlier reported ∼20 mV cardiomyocyte depolarization by TGF-β1-stimulated myofibroblasts in cell pairs,7 we found depolarization of 16 mV of cardiomyocytes in TGF-β1 stimulated cardiac bodies (Figure 1D).
Since we did not perform detailed histological 3D reconstructions we cannot claim that our hetero-cellular tissue model fully represents the complex micro-architecture of the intact heart. However, we consider the three-dimensionality of cardiac bodies superior to previously used cell pairs or monolayers for investigation of fibroblast–cardiomyocyte coupling in vitro because they are better mimicking the situation of interstitial fibrosis of the heart in which fibroblasts are interspaced between different layers of cardiomyocytes.9 Thus, our study extends previous reports to a three-dimensional hetero-cellular tissue model and confirms that enhanced hetero-cellular coupling gains importance after TGF-β1 stimulation. Translating the observed increase of cardiomyocyte membrane potential and spontaneous activity in vitro to the intact heart in vivo, would increase spontaneous activity within the working myocardium of the heart, which triggers extrasystolic beating and can initiate potential lethal tachyarrhythmia.6 In addition, subthreshold depolarization of cardiomyocytes would reduce Na+ channel availability with subsequent slower conduction of electrical activity, which stabilizes and prolongs arrhythmia episodes.20 Therefore, fibroblast-induced RMP elevation of ventricular cardiomyocytes is discussed to be one cause for the highly pro-arrhythmic effect of interstitial fibrosis.
Selective pharmacological manipulation of fibroblast membrane potential was elegantly shown for sphingolipid sphingosine-1-phosphate, which depolarized fibroblasts by opening a fibroblast-specific ion channel. Through hetero-cellular coupling, this effect depolarized cardiomyocytes.21 Identification of a hyperpolarizing K+ or Cl− channel expressed only in (myo-)fibroblasts and developing a specific activator to selectively hyperpolarize fibroblasts would be an intriguing new therapeutic option to prevent their depolarizing effect on the cardiomyocytes. Using optogenetic hyperpolarization of ArchT-expressing fibroblasts, we have observed that this strategy should have only a minor effect on cardiomyocyte electrophysiology in a non-TGF-β1 stimulated situation (Figure 6D) most likely because hetero-cellular coupling is low or because of lower diastolic input resistance compared to TGF-β1-depolarized cardiomyocytes.21 Thus if such principle holds for the intact heart in vivo, pharmacological myofibroblast hyperpolarization would have minor side effects in healthy regions of a diseased heart and will mainly act on regions with myofibroblasts and enhanced hetero-cellular coupling.
Our approach to measure fibroblast–cardiomyocyte coupling by recording spontaneous beating of cardiac bodies is technically simple and scalable. Analysis can be done by video microscopy as shown in this article but also by scalable field potential measurements using multi-well systems, which have been successfully combined with optogenetic stimulation.17 Analysing the effect of optogenetic fibroblast depolarization and hyperpolarization might be able to discriminate between drugs affecting hetero-cellular coupling, which will alter both ChR2 and ArchT effects similarly and drugs leading to fibroblast hyperpolarization, which would decrease the spontaneous beating rate and enhance the efficacy of ChR2-induced fibroblast depolarization. Side effects on cardiomyocyte function could be detected by effects on basal beating rate in non-TGF-β1 stimulated cardiac bodies. Thus our approach presents an easy-to-use and scalable screening approach for new substances targeting specifically the electrical properties of fibroblasts or the hetero-cellular coupling to cardiomyocytes in a three-dimensional model of myocardial fibrosis. This is a clear advantage compared to currently available methods such as dual cell patch clamp, gap-FRAP or dye injection which require laborious experimental setups and are not scalable for high throughput screening assays.11
In the future, the herein presented optogenetic approach could provide the intriguing possibility to investigate the effects of hetero-cellular coupling between native fibroblasts and cardiomyocytes in the intact heart in vivo. Unfortunately, specific expression of the optogenetic actuators within fibroblasts requires promoters with activity only in fibroblasts. Even taking advantages of Cre/LoxP systems has been shown to be insufficient yet to obtain fibroblast specific expression of optogenetic actuators or result in expression of fluorescence reporters in low numbers and/or a specific subset of fibroblasts.9 However, this report proves the concept and the experimental strength of fibroblast specific optogenetic de- and hyperpolarization which can eventually be adapted to animal models in vivo.
Conclusion
In conclusion, we herein report a new three-dimensional hetero-cellular co-culture model to quantify the influence of fibroblasts on the electric properties of cardiomyocytes. Thereby we could show that TGF-β1 stimulation enhances hetero-cellular coupling, leading to depolarized cardiomyocytes and thus increased their spontaneous activity. Importantly, light-induced depolarization of the fibroblasts furthermore increased this pro-arrhythmogenic effect whereas light-induced hyperpolarization of the fibroblasts blocked spontaneous beating in the case of enhanced hetero-cellular coupling by TGF-β1. This new approach is simple and scalable in input and readout and thus could be applied to screen for substances affecting functional electrical coupling between fibroblasts and cardiomyocytes in vitro. In future, this approach could also be suited to quantify the effect of fibroblast membrane potential on cardiomyocyte function in vivo.
Acknowledgements
We thank Frank Holst for technical assistance as well as K. Deisseroth, Stanford University and C. Schuurmans, University of Calgary for providing plasmids.
Conflict of interest: none declared.
Funding
German Research Foundation [315402240/SA1785/8–1, 313904155/SA1785/7–1, 380524518/SA1785/9–1, 214362475/GRK1873/2, and SPP 1926 Young Investigator Program], the BONFOR Program, Medical Faculty, University of Bonn and by the German Federal Ministry of Education and Research, funding program Photonics Research Germany, project BioPACE (13N14087). The DZHK (German Centre for Cardiovascular Research) supported T.B.
Data availability
The data underlying this article will be shared on reasonable request to the corresponding author.
References
Author notes
Maximilian Funken, Tobias Bruegmann contributed equally to the study.
