


Abstract
Outcome data on ventricular tachycardia (VT) ablation has been limited to few experienced centres. We sought to identify complication rates, predictors, and create a risk score model for predicting complications in patients from real-world data.
A total of 25 451 patients undergoing VT ablation from year 2006 to 2013 were identified from the National Inpatient Sample (NIS) database. The whole cohort was randomly divided into derivation cohort to derive the model and validation cohort to validate the model. Multivariate predictors of any complication were identified using regression model. Each predictor was assigned a risk score and each patient was assigned to one of the four groups (risk score in parenthesis) based on total combined risk score: Group 0 (0), Group 1 (1–5), Group 2 (6–10), and Group 3 (>11). The rate of ‘any complication’ and ‘in-hospital mortality’ in whole cohort was 14.7% and 2.8%, respectively. The predictors of any complication include chronic kidney disease, coagulopathy, chronic liver disease, stroke (cerebrovascular accident), emergency procedure, age ≥ 65 years, coronary artery disease, peripheral vascular disease, and female gender. There was a significant increase in complication rate in a linear fashion as the risk score increased. The incidence of any complications increased from 2.7% in Group 0 to 31% in Group 3. The risk score model performed well in predicting complications associated with VT ablation.
Patients with higher risk scores have significant increase in any complication and in-hospital mortality from VT ablation. The simple risk score model can help to risk stratify patients prior to VT ablation.
The rate of ‘any complication’ and ‘in-hospital mortality’ in patients undergoing radiofrequency ablation for ventricular tachycardia from randomly selected U.S. community hospitals and academic medical centres was 14.7% and 2.8%, respectively.
Age ≥65 years, female gender, emergency admission, coronary artery disease, coagulopathy, chronic liver disease, chronic kidney disease, cerebrovascular accident, and peripheral vascular disease were the predictors of any complication in patients undergoing VT ablation on multivariate analysis.
Patients with more comorbidities had significantly increased rates of vascular, cardiac, pulmonary, neurological complications, and in-hospital mortality compared with patients with less comorbidities.
Introduction
Over the last decade, radiofrequency ablation has emerged as an important therapy in addition to anti-arrhythmic and implantable cardioverter-defibrillator (ICD) therapy for patients with ventricular tachycardia (VT).1 Significant improvements in technology and emergence of strategies that include ablation of abnormal myocardial substrate in haemodynamically unstable VT, have augmented the procedural safety in patients undergoing VT ablation. In a single-centre study by Peichl et al.,2 the incidence of major complications and mortality rate was 6.2% and 0%, respectively. In a study by Dinov et al., the incidence of major complications from VT ablation was 11.1% with mortality of 4.8% in non-ischaemic and 3.7% in ischaemic patients.3,4 Yu et al.5 reported a high mortality rate of 9% in their cohort. These divergent rates are most likely due to small sample size. Additionally, the rates of complications reported by large centres cannot be extrapolated to all centres performing VT ablation.6
Individual predictors of complications associated with VT ablation have been reported, which include older age, chronic kidney disease (CKD), reduced left ventricular ejection fraction (EF), haemodynamically unstable VT, and inducibility after ablation.7,8 Additionally, patients undergoing emergency VT ablation for VT storm are at a higher risk for complications compared with patient undergoing an elective approach.2,8,9
A systematic approach to identify patients at risk for complications and mortality from VT ablation pre-procedurally will not only help operators risk stratify but also to prepare for anticipated complications. However, currently, there are no tools available to accurately risk stratify an individual patient who may have multiple comorbidities prior to VT ablation. We sought to identify the incidence and predictors of complications including mortality in a sample of patients undergoing VT ablation from a large administrative database and formulate a ‘simple risk score model’ for risk stratification.
Methods
National Inpatient Sample database
The National Inpatient Sample (NIS) is the largest inpatient, all-payer inclusive and publicly available database in the United States and is sponsored by the Agency for Healthcare Research and Quality in collaboration with Healthcare Cost and Utilization Project (HCUP). The database includes a randomly selected, 20% stratified sample of discharges representing 95% of all the U.S. community hospitals and academic medical centres excluding long-term, acute care hospitals, and rehabilitation centres. The database contains de-identified patient data from approximately 35 million hospital stays each year from 1988 to 2013 and is comprised of more than 250 variables including patient demographics, primary and secondary diagnoses, procedures, complications, discharge status, length of hospital stay, and insurance information. The diagnoses and procedures are coded in the dataset based on International Classification of Diseases, Ninth Revision, Clinical Modification (ICD-9-CM). No personal or identifiable data has been collected or used for the study. This study was approved by the Agency for Healthcare Research and Quality in collaboration with Healthcare Cost and Utilization Project (HCUP).
Study population
Using the NIS database, we identified patients who underwent VT ablation between the years 2006 and 2013 by searching for discharges with a principal diagnosis of VT (ICD-9-CM code: 427.1) and concurrent catheter based ablation procedure (ICD-9-CM code: 37.34) during the index admission, as VT ablation by itself has no specific ICD-9-CM code. Patients who had ‘emergency admission’ (provided by the NIS) with primary diagnosis of VT and had catheter ablation during the index admission were considered as ‘emergency VT ablation’. Patients who had secondary diagnostic codes for arrhythmias such as paroxysmal supraventricular tachycardia, atrioventricular nodal tachycardia, atrial flutter, atrial fibrillation, Wolff–Parkinson–White syndrome, and premature ventricular beats were excluded (see Supplementary material online, Table S1). The ‘whole sample’ (data from 2006 to 2013) was randomly divided into ‘derivation cohort’ used for the derivation of risk score model and ‘validation cohort’ used for validation of the risk score model. The definitions of the variables are provided in the Supplementary material online, Table S1.
Study outcomes
The primary outcome was the occurrence of ‘any complication’ following VT ablation. ‘Any complication’ was defined as the procedure related occurrence of either vascular complications (post-operative haemorrhage, post-operative haemorrhage requiring transfusion, other vascular complications, and vascular complications requiring surgery) or cardiac complications (iatrogenic cardiac complications, hemopericardium, cardiac tamponade, myocardial infarction, and cardiac complications requiring open heart surgery) or pulmonary complications (iatrogenic pneumothorax and other iatrogenic pulmonary complications) or neurological complications (transient ischaemic attack and stroke). In-hospital mortality was defined as death occurring during the index hospitalization. As the database captures information only during an index admission, late complications after hospital discharge could not be analysed. The secondary diagnostic codes during the admission for index VT ablation were used to identify the procedural complications and are listed along with their ICD-9-CM codes in Supplementary material online, S2.
Statistical analysis
As recommended by Healthcare Cost and Utilization Project (HCUP), appropriate discharge weights were applied to the NIS database to get the national estimates. Continuous variables are expressed as mean ± standard deviation. Categorical variables are presented as proportions (%) and analysed using χ2 test and/or Fisher’s exact test whenever appropriate. Normality was tested by using the histograms and Kolmogorov–Smirnov test. Normally distributed continuous variables were analysed using independent sample t-test. All variables that were predictors of any complication on univariate analysis were entered into binary logistic regression analysis model using the ‘enter method’ to identify the multivariate predictors which constituted the ‘risk score model’.
Finally, based on the beta coefficient from the regression model, each variable was given a numeric ‘risk score’ calculated with a simple mathematic formula by identifying the beta coefficient and dividing the value with the lowest of all beta coefficients and rounded to the nearest integer.10,11 The ‘total risk score’ for each patient was calculated by summing each individual risk score assigned to the predictors and ranged from 0 to 27. The total risk score was divided into four groups for easy clinical application (risk score in parenthesis): Group 0 (0), Group 1 (1–5), Group 2 (6–10), and Group 3 (>11). Rates of ‘any complication’ were calculated for each risk group in the whole cohort, derivation cohort and validation cohort. The predictive accuracy of the risk score model was examined by calculating the area under the curve (AUC) for derivation and validation cohorts. A P-value of ≤0.05 was considered as statistically significant. All statistics were performed using IBM SPSS Statistics for Windows, Version 24.0 (IBM Corp., Armonk, NY, USA).
Results
A total of 25 451 (whole cohort) patients who underwent VT ablation were identified from the NIS database. The whole cohort was randomly divided into a ‘derivation cohort’ (N = 12 761) and a ‘validation cohort’ (N = 12 690). The mean age of the patients was 60 ± 16 years; 43% of the patients were older than 65 years, 71% males and 78% Caucasian. An emergency admission and ablation was needed in 64% of patients. Baseline characteristics are shown in Table 1. The most common comorbidities include hypertension (HTN) (51%), coronary artery disease (CAD) (49%), congestive heart failure (CHF) (33%), CKD (23%), diabetes (22%), and chronic obstructive pulmonary disease (COPD) (17%).
Comparison of demographics of patients undergoing ventricular tachycardia ablation between derivation and validation cohorts
| Variables | Whole cohort | Derivation cohort | Validation cohort |
|---|---|---|---|
| (N = 25 451) | (N = 12 761) | (N = 12 690) | |
| Unweighted sample | 5112 | 2560 | 2552 |
| Age (years), mean ± standard deviation | 60 ± 16 | 60 ± 16 | 60 ± 16 |
| Age >65 years (%) | 10 978 (43) | 5638 (44) | 5340 (42) |
| Non-elective admission (%) | 16 313 (64) | 8164 (64) | 8149 (64) |
| Males (%) | 18 081 (71) | 9189 (72) | 8892 (70) |
| Race (%) | |||
| Whites | 16 635 (65) | 8475 (67) | 8160 (64) |
| Blacks | 2202 (10) | 1071 (10) | 1131 (11) |
| Others | 6613 (25) | 3214 (23) | 3399 (25) |
| Obesity (%) | 2448 (10) | 1213 (10) | 1235 (10) |
| Hypertension (%) | 12 967 (51) | 6464 (51) | 6503 (51) |
| Diabetes (%) | 5611 (22) | 2958 (23) | 2653 (21) |
| Coronary artery disease (%) | 12 587 (49) | 6290 (49) | 6297 (50) |
| Congestive heart failure (%) | 8463 (33) | 4306 (34) | 4157 (33) |
| Chronic pulmonary disease (%) | 4246 (17) | 2083 (16) | 2163 (17) |
| Chronic liver disease (%) | 288 (1) | 123 (1) | 165 (1.3) |
| Coagulopathy (%) | 1085 (4) | 555 (4) | 530 (4) |
| Cerebrovascular accident (%) | 162 (0.6) | 108 (1) | 55 (0.4) |
| Peripheral vascular disease (%) | 2045 (8) | 1094 (9) | 951 (8) |
| Chronic kidney disease (%) | 5829 (23) | 2951 (23) | 2878 (23) |
There were no significant differences in the incidence of vascular complications (8.8% vs. 8.9%), cardiac complications (6.7% vs. 6.4%), pulmonary complications (0.4% vs. 0.4%), and any complication (14.5% vs. 14.9%) between the derivation and validation cohorts, respectively. However, the incidence of neurological complications (0.7% vs. 1%) and in-hospital mortality (2.6% vs. 3%) were higher in the validation cohort compared with the derivation cohort, respectively (Table 2).
Comparison of complication rates in patients undergoing ventricular tachycardia ablation between derivation and validation cohorts
| Variables | Whole cohort | Derivation cohort | Validation cohort | P-value |
|---|---|---|---|---|
| (N = 25 451) | (N = 12 761) | (N = 12 690) | ||
| All vascular complications (%) | 2247 (8.8) | 1118 (8.8) | 1129 (8.9) | 0.7 |
| Post-procedural haemorrhage (%) | 957 (3.8) | 456 (3.6) | 501 (3.9) | 0.11 |
| Post-procedural haemorrhage requiring transfusion (%) | 1228 (4.8) | 629 (4.9) | 599 (4.7) | 0.43 |
| Other vascular complications (%) | 335 (1.3) | 178 (1.4) | 157 (1.2) | 0.26 |
| Vascular complications requiring surgery (%) | 151 (0.6) | 70 (0.5) | 81 (0.6) | 0.35 |
| All cardiac complications (%) | 1677 (6.6) | 860 (6.7) | 817 (6.4) | 0.33 |
| Hemopericardium (%) | 72 (0.3) | 42 (0.3) | 30 (0.2) | 0.16 |
| Cardiac tamponade (%) | 259 (1) | 125 (1) | 134 (1.1) | 0.54 |
| Myocardial infarction (%) | 990 (3.9) | 529 (4.1) | 461 (3.6) | 0.03 |
| Iatrogenic cardiac complications (%) | 542 (2.1) | 261 (2) | 281 (2.2) | 0.35 |
| Cardiac complications requiring open heart surgery (%) | 308 (1.2) | 169 (1.3) | 139 (1.1) | 0.09 |
| All respiratory complications (%) | 97 (0.4) | 49 (0.4) | 48 (0.4) | 0.94 |
| Iatrogenic pneumothorax (%) | 63 (0.2) | 28 (0.2) | 35 (0.3) | 0.36 |
| Iatrogenic other respiratory complications (%) | 38 (0.1) | 25 (0.2) | 13 (0.1) | 0.05 |
| All neurological complications (%) | 228 (0.9) | 95 (0.7) | 133 (1) | 0.01 |
| In-hospital mortality (%) | 702 (2.8) | 327 (2.6) | 375 (3) | 0.05 |
| Any complication (%) | 3734 (14.7) | 1886 (14.5) | 1888 (14.9) | 0.35 |
Predictors of any complication in derivation cohort and the proposed risk score model
On univariate analysis, the predictors of any complication include age ≥ 65 years, female gender, emergency VT ablation, obesity, HTN, diabetes, CAD, COPD, CHF, chronic liver disease (CLD), coagulopathy, peripheral vascular disease (PVD), cerebrovascular accident (CVA), and CKD.
On multivariate logistic regression analysis, predictors of any complication in derivation cohort include age ≥65 years, female gender, emergency admission, CAD, coagulopathy, CLD, CKD, CVA, and PVD, which constituted our ‘risk score model’ (see Table 3). Hypertension, diabetes, obesity, CHF, and COPD were significant predictors on univariate, but not on multivariate analysis. The assigned risk score (in parenthesis) for each of these multivariate predictors in the descending order of significance include CKD (5), coagulopathy (5), CLD (5), CVA (3), emergency procedure (3), age ≥ 65 years (2), CAD (2), PVD (1), and female gender (1) with a combined total score of 27. The whole cohort was divided into four groups based on the combined total score: Group 0 with the risk score of 0, Group 1 with risk score from 1 to 5, Group 2 with risk score from 6 to 10, and Group 3 with risk score from 11 to 27. Group 3 includes wider range of scores from 11 to 27 due to the progressively fewer number of patients at higher risk scores. The comparison of complication rates by risk score groups in whole sample were depicted in Table 4 and Figure 1 and in validation cohort were depicted in Supplementary material online, Appendix (Table 7, Figures 3 and 4).
Predictors of ‘any complications’ with assigned risk score
| Risk score | Predictors | Beta coefficient | Odds ratio | 95% confidence interval | P-value |
|---|---|---|---|---|---|
| 5 | Coagulopathy | 1.07 | 2.9 | 2.40–3.51 | <0.001 |
| 5 | Chronic liver disease | 0.93 | 2.52 | 1.69–3.75 | <0.001 |
| 5 | Chronic kidney disease and electrolyte abnormalities | 0.96 | 2.62 | 2.35–2.92 | <0.001 |
| 3 | Emergency admission | 0.38 | 1.46 | 1.29–1.64 | <0.001 |
| 3 | Cerebrovascular accident | 0.7 | 2 | 1.27–3.15 | 0.003 |
| 2 | Age>65 years | 0.34 | 1.4 | 1.25–1.57 | <0.001 |
| 2 | Coronary artery disease | 0.34 | 1.41 | 1.25–1.58 | <0.001 |
| 1 | Peripheral vascular disease | 0.2 | 1.25 | 1.1–1.46 | 0.007 |
| 1 | Female sex | 0.23 | 1.26 | 1.11–1.42 | <0.001 |
| 27 | Total risk score |
Comparison of complication rates between different risk score groups in whole sample
| Variables | Risk group (risk score range) | P-value | |||
|---|---|---|---|---|---|
| 0 (0) | 1 (1–5) | 2 (6–10) | 3 (11–27) | ||
| (N = 1728) | (N = 14 202) | (N = 6742) | (N = 2757) | ||
| All vascular complications (%) | 37 (2.1) | 784 (5.5) | 841 (12.5) | 586 (21) | <0.01 |
| Post-procedural haemorrhage (%) | 27 (1.5) | 422 (3.0) | 321 (4.8) | 187 (6.8) | <0.01 |
| Post-procedural haemorrhage requiring transfusions (%) | 10 (0.6) | 327 (2.3) | 489 (7.3) | 403 (15) | <0.01 |
| Iatrogenic vascular injury (%) | 10 (0.6) | 130 (0.9) | 127 (1.9) | 67 (2.4) | <0.01 |
| Vascular injury requiring surgery (%) | 0 | 40 (0.3) | 76 (1.1) | 34 (1.2) | <0.01 |
| All cardiac complications (%) | 15 (0.9) | 739 (5.2) | 594 (8.8) | 329 (12) | <0.01 |
| Hemopericardium (%) | 0 | 29 (0.2) | 26 (0.4) | 16 (0.6) | <0.01 |
| Cardiac tamponade (%) | 10 (0.6) | 134 (0.9) | 81 (1.2) | 35 (1.3) | 0.01 |
| Myocardial infarction (%) | 5 (0.3) | 382 (2.7) | 354 (5.3) | 248 (9) | <0.01 |
| Iatrogenic cardiac complications (%) | 0 | 277 (2) | 204 (3) | 60 (2.2) | <0.01 |
| Cardiac complications requiring surgery (%) | 5 (0.3) | 95 (0.7) | 137 (2) | 71 (2.6) | <0.01 |
| All pulmonary complications (%) | 5 (0.3) | 39 (0.3) | 32 (0.5) | 21 (0.8) | 0.08 |
| Cerebrovascular accident (%) | 5 (0.3) | 66 (0.5) | 112 (1.7) | 46 (1.7) | <0.01 |
| Shock (%) | 0 | 10 (0.1) | 20 (0.3) | 22 (0.8) | <0.01 |
| Septicaemia (%) | 0 | 53 (0.4) | 88 (1.3) | 65 (2.4) | <0.01 |
| In-hospital mortality (%) | 0 | 124 (0.9) | 295 (4.4) | 282 (10) | <0.01 |
| Any complications (%) | 47 (2.7) | 1451 (10.2) | 1388 (21) | 849 (31) | <0.01 |
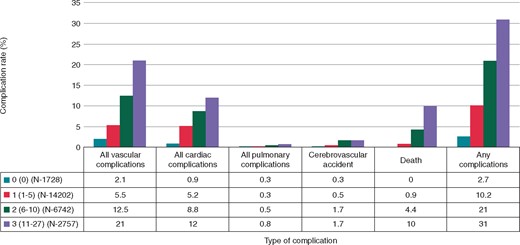
Complication rates by different risk score groups in whole sample.
There was a significant increase in the complication rates as the risk score increased from Group 0 to Group 3. In the whole sample, the incidence of any complication increased from 2.7% in Group 0, to 10.2% in Group 1, to 21% in Group 2, and to 31% in Group 3. When the risk score was plotted as a continuous score, there was almost a linear increase in any complication rate with increase in risk score (Figure 2). The incidence of in-hospital mortality also increased from 0 in Group 0, to 0.9% in Group 1, to 4.4% in Group 2, and to 10% in Group 3.
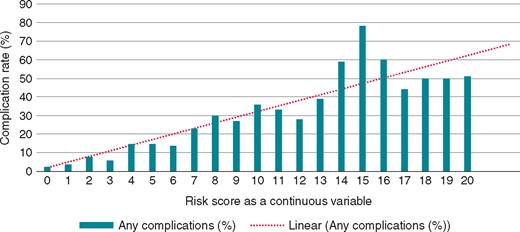
Rate of any complications based on risk score as a continuous variable in whole sample.
Validation of risk score model using receiver operative characteristics curve
The AUC for predicting ‘any complication’ using the proposed risk score model for derivation and validation cohorts were 0.71 and 0.68, respectively. The AUC for predicting ‘in-hospital mortality’ from the procedure for derivation cohort and validation cohorts were 0.81 and 0.78, respectively.
Comparison of older (age ≥ 75 years) vs. younger (age < 75 years) patients undergoing ventricular tachycardia ablation
Patients who were older than 75 years of age had higher prevalence of HTN (64% vs. 48%), CAD (73% vs. 45%), CHF (41% vs. 31%), coagulopathy (6.3% vs. 3.8%), and CKD (36% vs. 20%) compared with patients who are <75 years, respectively. The incidence of vascular complications (14% vs. 7.8%), cardiac complications (9% vs. 6%), any complications (24% vs. 14.5%), and mortality (4.5% vs. 2.4%) was significantly higher in older vs. younger patients, respectively (Table 5).
Comparison of demographics and complication rates between elderly vs. younger patients undergoing ventricular tachycardia ablation
| Variables | Age ≥ 75 years | Age < 75 years | P-value |
|---|---|---|---|
| Weighted sample (N) | 4330 | 21 090 | |
| Females (%) | 840 (19.4) | 6504 (31) | <0.0001 |
| Race-Whites (%) | 3166 (73) | 13470 (64) | <0.0001 |
| Obesity | 220 (5) | 2229 (10.6) | <0.0001 |
| Hypertension (%) | 2764 (64) | 10 198 (48) | <0.0001 |
| Diabetes with complications (%) | 95 (2.2) | 451 (2.1) | 0.81 |
| Coronary artery disease (%) | 3148 (73) | 9434 (45) | <0.0001 |
| Congestive heart failure (%) | 1974 (41) | 6489 (31) | <0.0001 |
| Chronic pulmonary disease (%) | 790 (18) | 3456 (16) | <0.003 |
| Coagulopathy (%) | 274 (6.3) | 811 (3.8) | <0.0001 |
| Cerebrovascular accident (%) | 29 (0.7) | 133 (0.6) | 0.76 |
| Peripheral vascular disease (%) | 560 (13) | 1485 (7) | <0.0001 |
| Chronic kidney disease (%) | 1566 (36) | 4263 (20) | <0.0001 |
| Complications | |||
| All vascular complications | 609 (14) | 1638 (7.8) | <0.0001 |
| Post-operative haemorrhage (%) | 277 (6.4) | 681 (3.2) | <0.0001 |
| Post-operative haemorrhage requiring transfusion (%) | 335 (7.7) | 893 (4.2) | <0.0001 |
| Iatrogenic vascular injury (%) | 609 (14) | 1638 (8) | <0.0001 |
| Vascular complications requiring surgery (%) | 54 (1.2) | 97 (0.5) | <0.001 |
| All cardiac complications (%) | 380 (9) | 1297 (6) | <0.0001 |
| Hemopericardium (%) | 26 (0.6) | 46 (0.2) | <0.001 |
| Cardiac tamponade (%) | 50 (1.2) | 209 (1) | 0.32 |
| Myocardial infarction (%) | 252 (6) | 738 (3.5) | <0.0001 |
| Cardiac complications requiring open heart surgery (%) | 54 (1.2) | 254 (1.2) | 0.8 |
| Any respiratory complications (%) | 19 (0.4) | 78 (0.4) | 0.5 |
| Cerebrovascular accident (%) | 25 (0.6) | 202 (1) | 0.01 |
| In-hospital mortality (%) | 194 (4.5) | 508 (2.4) | <0.001 |
| Any complications (%) | 1021 (24) | 3056 (14.5) | <0.0001 |
Comparison of patients admitted for emergency vs. elective ventricular tachycardia ablation
In patients who were admitted emergently, the mean time for the ablation was 3.4 ± 4.5 days compared with 0.9 ± 3.2 days for patients who were admitted electively. Similarly, the length of stay for patients admitted emergently was 7.3 ± 8.9 days compared with 3.5 ± 7.9 days for patients who were admitted electively. In comparison to patients who were admitted electively for VT ablation, patients admitted emergently had significantly higher incidence of vascular complications (7 vs. 9.9%), cardiac complications (4.5 vs. 7.7%), neurological complications (0.7 vs. 1%), any complication (11.3 vs. 18.7%), and in-hospital mortality (1.1% vs. 3.7%), respectively. On logistic regression analysis, emergency VT ablation increased the incidence of any complication rate by 38% compared with elective VT ablation (Table 6).
Comparison of demographics and complication rates in patients undergoing emergency vs. elective ventricular tachycardia ablation
| Variables | Elective admission | Emergent admission | P-value |
|---|---|---|---|
| (N = 9072) | (N = 16304) | ||
| All vascular complications (%) | 637 (7) | 1610 (9.9) | <0.001 |
| Post-procedural haemorrhage (%) | 336 (3.7) | 622 (3.8) | 0.66 |
| Post-procedural haemorrhage requiring transfusions (%) | 305 (3.4) | 923 (5.7) | <0.001 |
| Iatrogenic vascular injury (%) | 92 (1) | 244 (1.5) | 0.001 |
| Vascular injury requiring surgery (%) | 40 (0.4) | 111 (0.7) | 0.017 |
| All cardiac complications (%) | 411 (4.5) | 1261 (7.7) | <0.001 |
| Hemopericardium (%) | 15 (0.2) | 52 (0.3) | 0.022 |
| Cardiac tamponade (%) | 119 (1.3) | 136 (0.8) | <0.001 |
| Myocardial infarction (%) | 95 (1) | 895 (5.5) | <0.001 |
| Iatrogenic cardiac complications (%) | 222 (2.4) | 320 (2) | 0.01 |
| Cardiac complications requiring surgery (%) | 108 (1.2) | 200 (1.2) | 0.8 |
| All pulmonary complications (%) | 39 (0.4) | 58 (0.4) | 0.35 |
| Cerebrovascular accident (%) | 60 (0.7) | 168 (1) | 0.003 |
| Septicaemia (%) | 31 (0.3) | 175 (1.1) | <0.001 |
| In-hospital mortality (%) | 97 (1.1) | 600 (3.7) | <0.001 |
| Any complications (%) | 1021 (11.3) | 3046 (18.7) | <0.001 |
Discussion
Our study is the largest study to date reporting complication rates in a ‘real world’ sample of patients undergoing VT ablation and to our knowledge, is the first one to derive a pre-operative risk score using a database of patients who underwent VT ablation across all types of hospitals and operator volumes. The following are the major findings of our study:
The rate of ‘any complication’ and ‘in-hospital mortality’ from randomly selected U.S. community hospitals and academic medical centres was 14.7% and 2.8%, respectively.
Age ≥65 years, female gender, emergency admission, CAD, coagulopathy, CLD, CKD, CVA, and PVD were the predictors of any complication in patients undergoing VT ablation on multivariate analysis.
Patients with higher risk scores had significantly increased rates of vascular, cardiac, pulmonary, neurological complications, and in-hospital mortality compared with patients with lower risk scores. When these patients are stratified into different risk groups based on the risk score, there is a significant increase in complication rate from 2.7% in lowest risk score group to 31% in the highest risk score group. Similarly, the mortality also increased from 0% in lowest risk score group to 10% in the highest risk score groups.
The risk score model we developed, had a good discrimination on receiver operating characteristics (ROC) with a AUC of 0.71 and 0.68 for predicting any complication, and 0.81 and 0.78 for predicting mortality associated with VT ablation in the derivation and validation cohorts, respectively.
Post-procedural complication rates in patients undergoing ventricular tachycardia ablation
In a study by Palaniswamy et al.1 using the NIS data base that included a total of 4653 patients undergoing post-infarct VT ablation, the rate of all complications (11.24% vs. 14.7%), mortality (1.6% vs. 2.8%), vascular complications (6.9% vs. 8.8%), and cardiac complications (4.5% vs. 6.6%) were lower compared with our study. The differences in complication rates could be related to different study design. They enrolled patients from 2002 to 2011 with post-infarct VT only, whereas, in our study, patients with different aetiologies of VT from 2006 to 2013 were included. The increasing complication rates in recent years could be related to increase in the number of patients with complex comorbidities undergoing VT ablation and could also be due to multiple low-volume operators and centres performing VT ablation.3 In a study by Tung et al., enrolling patients with VT from structural heart disease, the incidence of total complication rate and mortality were 6% and 0.1%, respectively. This low incidence in complication rates in their centres could be attributed to their high volume and expertise in performing these procedures.12 In a study by Katz et al., using the administrative hospitalization data from 1994 to 2011 from limited states in USA, 9699 patients undergoing VT ablation were identified. The in-hospital complication rate was 8.5% with a mortality rate of 1.1%. However, when patients undergoing VT ablation secondary to structural heart disease were analysed, the complication rate was 14.5%.8 This difference in complication rates between other studies compared with our study could be related to higher percentage of patients admitted emergently for VT ablation in our study (64% vs. 41.2%). Also, NIS database constitutes randomly selected patient data across 49 states in the United States compared with specific states in their study which could have contributed to selection bias and random sampling error.8 Yu et al. analysed complication rates in 148 patients undergoing ablation for scar mediated VT. Their intra-procedural and post-procedural complication rates were 11% and 25% with a mortality of 9%.5 This study reported various complications including pneumonia, atrioventricular block, wound infection, and thromboembolism from intra-aortic balloon pump, which were different from the complications reported in our study.5 The study by Peichl et al.2 was a single-centre experience, which could have contributed to skewed results as the mortality rate was 0.
Similar to previous reports, elderly patients had higher rates of post-procedural complications and mortality, likely due to associated multiple comorbidities.2,5 Being admitted emergently and have undergone ablation on the same admission (‘emergent ablation’ group) carry higher risk for complications and mortality compared with patients who were admitted electively for the procedure (‘elective group’). Patients who were admitted emergently, had longer time to the procedure and longer length of stay probably because they were much sicker, had multiple comorbidities including heart failure and still underwent the procedure on the same admission, which is relatively emergent. Patients who were admitted electively, probably just for the procedure purpose had ablation close to the admission day (which is relatively elective as the procedure probably was scheduled long before the admission) and discharged early as they were less sick and had less comorbidities to manage before ablation. We believe that the necessity of the procedure is not predicated by the urgency with which it is performed. However, due to prior published studies on clustering of VT events, patients undergoing emergency ablation might have suffered multiorgan dysfunction due to electrical storm.13 In a study by Aldhoon et al., all-cause mortality over a period of 3 years was 41% vs. 32% in patients with VT ablation for electrical storm compared with non-electrical storm patients, respectively. However, this is a single-centre study with high proportion of ischaemic cardiomyopathy patients (77%) which could have influenced the results.9
We believe that the complication rates reported in our study better reflect real-world outcomes of VT ablation in the United Sates and the data includes patients from referral centres as well as community hospitals with varied operator volumes.
Predictors of complications and risk score
In our study, the predictors of any complication in descending order of assigned risk score include CKD, coagulopathy, CLD, CVA, emergency procedure, age ≥ 65 years, CAD, PVD, and female gender. Prior studies have reported the predictors of in-hospital mortality,1 perioperative and post-operative complications,2,7 and incidence of acute haemodynamic decompensation in patients undergoing VT ablation. A distillation of these study results shows that diabetes mellitus, CKD and PVD, age > 60 years, male gender, emergency transfer for procedure, CAD and structural heart disease, VT storm, and COPD are significant risk factors. These risk factors for procedural complications are well known and impact the outcomes of VT ablation, but they were drawn either from small sample sizes or from highly experienced centres. The risk factors in our study were from a randomly selected sample of 25 451 patients across all hospitals and the risk score model fared well in derivation and validation cohorts with AUC of 0.71 and 0.68 on ROC curves, respectively. When the risk score was plotted as a continuous variable, the complication rates increased in a linear fashion. This underscores the influence of each risk factor in predicting the complications. Congestive heart failure was the predictor of any complication on univariate, but not on multivariate analysis. The compensation of CHF by other comorbid conditions on multivariate analysis underscores the effect of end organ damage on complications. Moreover, NIS database does not have the EF to analyse whether, patients with heart failure with reduced EF have had higher complications compared with patients with heart failure with preserved EF.
Clinical application of our proposed score model
This risk score model could guide clinicians in a priori risk stratification to high risk vs. low risk for procedural complications and mortality in patients undergoing VT ablation. This knowledge may help in allocating appropriate resources for high risk patients. Perhaps, patients with the highest risk score should be monitored more closely in the intensive care units with multiple consultative services, and patients with low risk score in the inpatient telemetry units. On the basis of the risk score model, patients with coagulopathy, CKD and CLD have the highest complication rates followed by CVA and emergency VT ablation compared with patients with other predictors. These predictors highlight the importance of comorbid conditions and optimization of these conditions (example: correction of coagulopathy) may possibly decrease the complication rate and improve the success of VT ablation. Our risk score model does not include intra-procedural and post-procedural variables that influence the complication rates. Our endeavour was to formulate a simple risk score model that can be easily calculated and be uniformly applicable, to predict the complication rate in an individual patient based on their comorbid conditions and make shared decisions with the patients or their families. Prophylactic ablation of VT could potentially be beneficial in patients, as can be evidenced by higher complication rates of VT ablation in an emergency setting, most often during electrical storm and before end organ damage ensues.14,15
Given that this is a retrospective large-scale analysis, we propose that this ‘risk score model’ needs to be tested in high- and low-volume centres and prospectively validated to assure its effectiveness and to reflect the study findings in varied settings. Careful analysis of various clinical parameters, including pre-procedure EF and use of mechanical circulatory support during ablation needs to be prospectively evaluated and the efficacy of this risk score could be tested in future prospective analyses.
Limitations
Our study has the limitations that are inherent to a retrospective study using a large administrative database. There is no specific ICD-9-CM procedure code for VT ablation. We combined diagnosis codes for VT with the procedural code for catheter ablation to identify the procedure of interest, which was the similar strategy used in multiple previous publications that have used the NIS database.16–19 Information on type of VT, ablation strategy utilized, pre-procedural and post-procedural drug therapy (e.g. anti-arrhythmic drugs, anti-coagulant drugs) were not included in the database. Data regarding EF was not provided by NIS, which could have impacted the complication rates and the risk score model. The effect of annual operator volume or hospital volume on any complication rates or in-hospital mortality was not assessed, as it was not available for all the years. Nevertheless, our scoring system risk stratification is based on patient characteristics and hence could be applicable regardless of operator experience or hospital setting. Late complications were not assessed, as the database did not capture the follow-up data. Despite the above limitations, the broad participation of hospitals in the NIS database makes the results of our study applicable to real world VT population undergoing ablation procedure.
Conclusion
The rate of ‘any complication’ and ‘in-hospital mortality’ in patients undergoing VT ablation from randomly selected U.S. community hospitals and academic medical centres excluding long-term acute care hospitals and rehabilitation centres was 14.7% and 2.8%, respectively. The predictors of any complication were age ≥65 years, female gender, emergency admission, CAD, coagulopathy, CLD, CKD, CVA, and PVD all of which constitute the proposed risk score model. As the risk score increased, there was a significant increase in any complication and in-hospital mortality in a linear fashion. The risk score model can be used to risk stratify patients prior to VT ablation and as a guide to take appropriate measures to decrease the complication rates.
Acknowledgements
We thank Agency for Healthcare Research and Quality (AHRQ) for providing the NIS database.
Conflict of interest: J.N.K. received honoraria, education and research support from Atricure, Biosense Webster, Medtronic, Boston Scientific, and St. Jude Medical. K.A.E. received honoraria and research support from Atricure, Biosense Webster, Medtronic, Boston Scientific, and St. Jude Medical. All other authors declared no conflict of interest.
