Abstract
Over the last decades, substrate-based approaches to ventricular tachycardia (VT) ablation have evolved into an important therapeutic option for patients with various structural heart diseases (SHD) and unmappable VT. The well-recognized limitations of conventional electroanatomical mapping (EAM) to delineate the complex 3D architecture of scar, and the potential capability of advanced cardiac imaging technologies to provide adjunctive information, have stimulated electrophysiologists to evaluate the role of imaging to improve safety and efficacy of catheter ablation. In this review, we summarize the histological differences between SHD aetiologies related to monomorphic sustained VT and the currently available data on the histological validation of cardiac imaging modalities and EAM to delineate scar and the arrhythmogenic substrate. We review the current evidence of the value provided by cardiac imaging to facilitate VT ablation and to ultimately improve outcome.
Introduction
Over the last decades interventional treatment for monomorphic sustained ventricular tachycardia (MSVT) has evolved into an important therapeutic option for patients with structural heart disease (SHD) and scar-related VT.1 Various image modalities, including cardiac magnetic resonance (CMR), computed tomography (CT), nuclear imaging and intracardiac echocardiography (ICE) have been used to facilitate catheter ablation in conjunction with electroanatomical mapping (EAM). Cardiac imaging has the potential advantage to non-invasively delineate the arrhythmogenic substrate with a higher degree of precision than EAM. Real-time imaging and accurate image integration may pave the way for the precise application of new energy sources and non-invasive ablative radiation. Real-time imaging may also allow for monitoring of lesion formation to optimize acute procedural endpoints. However, to further improve and to responsibly use cardiac imaging in substrate-based ablation, knowledge of the substrate for MSVT in various SHD, and the capability of image modalities to visualize this substrate, is crucial.
This review will summarize the histological differences between SHD aetiologies related to MSVT and evaluate the histological validation of cardiac imaging modalities and EAM to delineate both scar and the arrhythmogenic substrate. To this end, we use ‘scar’ to refer to any pathological fibrosis and ‘substrate’ to refer to specific areas related to MSVT. We review the current evidence of the value provided by imaging and discuss possible future uses of cardiac imaging in the interventional treatment of MSVT. We performed a systematic search in medical databases using multiple complex search terms, reviewed all cross-references to relevant articles, and reviewed all published literature from research groups who contribute to the field. However, due to the complexity of the subject material, our approach did not fulfil the systematic review criteria as outlined by PRISMA.2
The histology of scar in structural heart disease associated with monomorphic sustained ventricular tachycardia
Monomorphic sustained ventricular tachycardia occur in SHD patients of varying aetiologies, including, but not limited to, ischaemic cardiomyopathy (ICM), arrhythmogenic right ventricular cardiomyopathy (ARVC), hypertrophic cardiomyopathy (HCM), and dilated cardiomyopathy (DCM).1 The latter encompasses a wide range of aetiologies including inflammatory diseases (e.g. cardiac sarcoidosis and post-myocarditis), and various genetic causes (Lamin A/C (LMNA) mutation being the most widely recognized).3 Different genetic and acquired insults may result in different degrees of cell injury, different repair mechanisms and different amounts, patterns, and architectures of fibrosis (Figures 1 and 2). As shown, the histological characteristics of scar vary significantly depending upon the aetiology. These variations may impact on both the resulting substrate and the ability of cardiac imaging to delineate it.
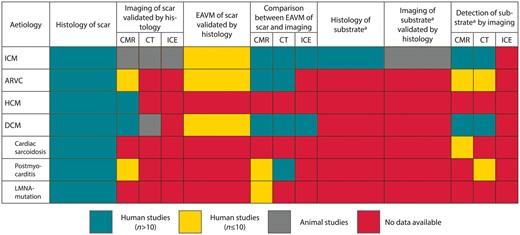
Figure 1
Overview of the available evidence on invasive and non-invasive methods of scar delineation in different aetiologies related to monomorphic sustained tachycardia. aAs determined by conventional methods (e.g. activation mapping, entrainment mapping, termination sites). ARVC, arrhythmogenic right ventricular cardiomyopathy; CMR, cardiac magnetic resonance; CT, computed tomography; DCM, dilated cardiomyopathy; EAVM, electroanatomical voltage mapping; HCM, hypertrophic cardiomyopathy; ICE, intracardiac echocardiography; ICM, ischaemic cardiomyopathy.
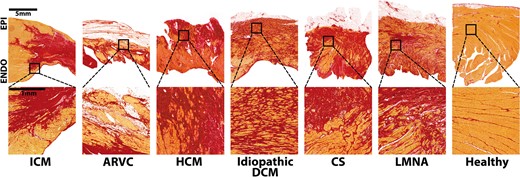
Figure 2
Examples of scar pattern in different aetiologies of structural heart disease. Stained with sirius red (fibrosis stains red, viable myocardium yellow). Ischaemic cardiomyopathy (ICM): compact scar extending from the subendocardium to the epicardium with sparing of the endocardial rim. Along the border, viable myocardium is interspersed by fibrous tissue.4–10 Arrhythmogenic right ventricular cardiomyopathy (ARVC): genetic disease,11,12 characterized by fibrofatty replacement of myocytes starting at the subepicardium,13–16 most frequently affecting the right ventricle with biventricular disease in approximately half of the cases, whilst the septum is rarely involved.13,17 Hypertrophic cardiomyopathy (HCM): autosomal dominant inherited disease,18,19 characterized by myocyte hypertrophy and disarray, starting at the subendocardium19–21 with interstitial collagen expansion, leading to interstitial fibrosis, preferentially involving the septum, followed by the lateral and apical left ventricular wall.19,21 Small vessel involvement may cause myocardial ischaemia and replacement fibrosis.19 Idiopathic dilated cardiomyopathy (DCM): highly variable scar pattern, including subendocardial, subepicardial, mid-wall, and transmural patterns; patchy or diffuse architectures are most frequently seen.22–28 Here, an example of diffuse fibrosis extending transmurally is given. Cardiac sarcoidosis: demarcated areas of irregular non-necrotising granulomas leading to patchy fibrosis,29–32 mainly affecting the left ventricle and the septum, followed by the right ventricle.29–31 LMNA-mutation: one example of a patient with dominant, but not exclusively, mid-myocardial (predominantly interstitial) fibrosis, primarily involving the basal septum, the conduction system, and the posterior left ventricular wall.33–36 Healthy control: minimal interstitial fibrosis between bundles of myocardium. Post-myocarditis (not shown): heterogeneous disease,37 histologically defined by an inflammatory infiltrate with necrosis, leading to fibrosis.38
Cardiac imaging to delineate scar and their validation using histology as the gold standard
Late gadolinium-enhanced (LGE)-CMR has become the preferred imaging technique to delineate scar. Binary approaches categorize tissue into scar vs. normal myocardium based on either the maximal signal intensity (SI) of affected regions or on the SI of healthy remote myocardium.39,40 Methods using three categories (dense fibrosis/scar core, moderate fibrosis/scar border zone, and healthy myocardium) based on two SI thresholds, are referred to as ternary methods.41–43 Importantly, there is no agreement on the optimal method and the optimal thresholds to quantify scar core and border zone, and different methods and thresholds will significantly affect the diagnostic yield of LGE-CMR (Figure 3). Cardiac T1 mapping, T2 mapping, and diffusion-weighted imaging (DWI) are other promising techniques allowing assessment of the extracellular volume fraction as a potential measure of diffuse fibrosis, myocardial oedema and fibre orientation, respectively.44,45
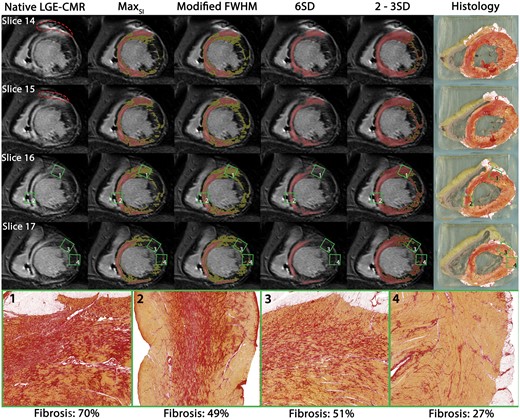
Figure 3
Reprinted with permission from EHJ.22 Different scar delineation techniques applied in dilated cardiomyopathy: different LGE-CMR scar delineation methods applied to one patient with DCM with corresponding histology. Red dotted line: ICD artefact. Red: scar core. Yellow: scar border zone according to different methods. Green squares: locations of high-resolution histology inserts from non-ablation locations. Areas of dense mid-septal fibrosis surrounded by viable myocardium corresponded well with areas of LGE on CMR (insert 2). Despite high quantity, less well delineated fibrosis (insert 1) was only identified as core scar when using the 2–3SD method; as border zone when using the SImax or modified full width at half maximum method. Despite comprising more than 50% fibrosis, a diffuse pattern was not detected on LGE-CMR irrespective of method used (insert 3). CMR, cardiac magnetic resonance; FWHM, full width at half maximum; LGE, late gadolinium enhancement; SD, standard deviation.
Computed tomography has a significantly higher spatial resolution, even if compared to modern isotropic 3D LGE-CMR. However, a drawback is the unfavourable signal-to-noise ratio with suboptimal results, particularly for chronic scars. Furthermore, the doses of highly concentrated iodine-based contrast agents used in animals to achieve acceptable results are much higher than those used in clinical practice.46
Nuclear imaging, including positron emission tomography (PET) and single-photon emission tomography (SPECT) can distinguish non-viable scar, viable hibernating scar, and healthy myocardium by changes in metabolism and/or perfusion, but are hampered by a poor resolution.47
Intracardiac echocardiography has been used to delineate scar based on wall-thinning, wall motion abnormalities,48 and occasionally the heterogeneity in SI.49
Although widely used, different cardiac image modalities have not been histologically validated for most aetiologies, as summarized in Table 1 and visualized in Figure 1. Briefly, in ICM LGE-CMR (both binary and ternary methods),4,39,40,50,51 contrast-enhanced CT,53–55 nuclear imaging,40,56–58,113 and ICE59 have been histologically validated to identify compact scar in animal models—and occasionally in small human cohorts.56–58 However, although less compact architectures of fibrosis are detectable in humans in vivo in non-ischaemic aetiologies, their accurate delineation is still limited, and data comparing imaging with full heart histology are sparse, hampered by the lack of animal models. In ARVC and post-myocarditis, histological validation of CMR is based solely on three explanted or post-mortem hearts.76,77,107–109 In HCM, the total amount of fibrosis in human septal myectomy specimens correlated to LGE on CMR, using a binary method.89
Table 1Histological validation of imaginga and electroanatomical voltage mapping and comparison between imaging and electroanatomical voltage mapping to delineate scar in different aetiologies related to monomorphic sustained ventricular tachycardia
| Aetiologya
. | Imaging of scar validated by histology
. | EAVM of scar histology validated by histology
. | Comparison between EAVM of scar and imaging
. |
|---|
| ICM | CMR—animal studies: LGE (binary): Good correlation between LGE areas and large histological scars (n = 24, 18, 10, 12)39,40,50,51 LGE (binary): 100% of scars with >25% transmurality were detected by LGE-CMR, compared to 88% of smaller, subendocardial scars (n = 12)40 LGE (ternary): Good correlation between both ex vivo LGE and histological SC and BZ (n = 5)4 Post-contrast T1 (ternary): Good correlation between ex vivo T1 mapping and histological SC and BZ (n = 5)52 DWI (ternary): Good correlation between ex vivo DWI and histological SC and BZ (n = 5)4
| Animal studies: Low bipolar voltage areas (<1.5 or <1 mV) correlate well with histological scar at gross pathology both endocardially and epicardially (n = 7, 22, 13)59–61 An inverse relationship existed between average BV amplitude and extent of scar transmurality (n = 13)62 All fractionated electrograms are located within areas of scar (n = 7)59
| CMR—animal studies: LGE (binary): No significant difference between scar volume on CMR vs. BV < 1.5 mV irrespective of catheter used (n = 11)65 LGE (ternary, MCLE): SC on CMR correlates well with areas of BV < 0.5 mV. BZ on CMR correlates well with BV 0.5–1.5 mV (n = 5)66 DWI (ternary): Good correlation between percentage SC area delineated by CMR and EAVM (n = 6)67
|
|
CT—animal studies: Contrast (binary): Good correlation between scar size on CT and histology (n = 17, 15, 8)53–55 Contrast (ternary): CT underestimated scar compared to LGE-CMR, CT overestimated scar compared to pathology (n = 15)54
| Human studies: Scar on EAVM (<0.5 mV) correlated well with post-mortem gross pathology (n = 1)63 BV < 0.5 mV corresponded to >80% fibrosis, whilst BV > 1.5 mV corresponded to <20% fibrosis at post-mortem histology (n = 1)64
| CMR—human studies: LGE (binary): BV < 1.5 mV overlap with areas of LGE on endocardial surface in two studies (91 ± 8% and 69 ± 17%, respectively) (n = 3, 26)68,69 and with areas of LGE on epicardial surface (73 ± 7%) (n = 26)69 LGE (ternary): 60% of SImax yielded the highest correlation between EAVM (SC < 0.5 mV, BZ: 0.5–1.5 mV) and LGE-CMR (n = 10)70 LGE (ternary): Dense (SI ≥ 50% of SImax), transmural, thin walled scars correlates well with BV < 1.5 mV. BV < 1.5 mV cannot accurately detect non-transmural, small subepicardial scar or infarct gray-zone (BZ = SI 35%–50% of SImax) (n = 15).43
|
|
Nuclear imaging—human studies: PET-CT: both PET-perfusion (13N-ammonia) and PET-metabolism (18FDG) correlated well with gross pathology in transplanted hearts (n = 3)56 PET-CT: perfusion/metabolism mismatched areas contained viable cells, whereas areas with reduced perfusion and metabolism showed extensive fibrosis in transmural biopsies (n = 33)57 SPECT: 99mTc-sestamibi correlated well with histological myocardial fibrosis in transplanted hearts (n = 15)58
| | Contrast-enhanced CT—animal studies: |
| ICE—animal studies: | | Contrast-enhanced CT—human studies: Contrast (binary): Low voltage (BV < 1.5 mV and UV < 8.0 mV) could be identified by delayed enhancement with a sensitivity of 78% and specificity of 86% (n = 23)71 Wall-thinning (<5 mm): BV < 1.5 mV is moderately correlated to wall-thinning,68,69,72 with agreement 66±14% on endocardium and 60 ± 13% on epicardium in largest cohort (n = 59)69
|
| | Nuclear imaging—human studies: PET-CT: BV < 0.5 mV can be predicted by PET with 89% sensitivity using a threshold of 50% metabolic activity (n = 14)73 PET-CT: Surface area of BV < 0.9 mV correlated best with PET-defined scar (uptake <50%) (n = 19)74 PET-CT: PET revealed metabolically active channels within EAM-scar (BV < 0.5 mV) (n = 10)73 SPECT: area of BV < 0.5 mV was 2.5 times smaller than 123I-MIBG-denervated areas, whereas BV 0.5–1.5 mV was similar to the 123I-MIBG transition zone (n = 15)75
|
| | | | ICE—animal studies: |
| | | | ICE—human studies: BV<1.5mV correlated with akinesia and wall-thinning on ICE in 87% of segments (n = 15)48 Low-voltage areas (BV<0.5mV) have higher SI on ICE than BZ voltages (0.5–1.5mV) Normal voltage areas (>1.5mV) have lower SI than BZ voltages (10 ICM, 12 DCM)49
|
|
| ARVC | CMR—human studies: | Human studies: BV < 1.5 mV correlates well with grooves pathological abnormalities if scar transmurality exceeds >60% of the wall thickness (n = 1)79 Fibrofatty replacement on EMB and BV are well correlated,80–82 although transmurality and size of scar was not quantified in EMB81,82 EMB taken from areas with UV < 5.5 mV and BV > 1.5 mV showed fibrofatty replacement on histology (n = 3)83
| CMR—human studies: Native CMR: Good side-to-side correlation between low voltage (<1.5 mV) and dyskinesia (n = 1, 17). Intramyocardial fat was poorly associated with low voltage (n = 17)84,85 LGE (binary): LGE underestimates scar compared to EAVM, especially when scar involves <20% of the RV area (n = 18 and n = 23)80,86 LGE (binary): strong correlation between LGE and low-voltage areas85
|
|
| | CT: | | Contrast-enhanced CT: Intramyocardial fat: High agreement between low voltage and fat (HU < −10) with endocardial unipolar (<5.5 mV) or epicardial BV (<1.0 mV87 or <1. 5 mV69,88) or endocardial UV <5.5 mV87,88 in the RV (n = 1487, n = 16,88 and n = 1969) Intramyocardial fat: Lower agreement between endocardial bipolar low voltage (<1.5 mV) and fat (HU < −10) (n = 16,88,n = 14,87 and n = 1969)
|
|
| HCM | CMR—human studies: LGE (binary): LGE reflects the total amount of fibrosis in myectomy specimen (n = 29)89 LGE (binary): If the degree of collagen increases, the likelihood of LGE also increases, especially if there is >15% collagen in a segment (n = 1)90
| Unknown | Unknown |
|
| DCM | CMR—animal studies: | Human studies: | CMR—human studies: LGE (binary, FWHM): LGE generated cut-off value to detect scar of BV < 1.55 mV and UV < 6.78 mV (n = 11 DCM, 4 cardiac sarcoidosis)100 LGE (binary, 6SD): LGE generated a cut-off value of BV < 1.78 mV and UV < 5.64 mV (n = 10 DCM, 5 cardiac sarcoidosis)101 LGE (binary): Epicardial cut-offs of BV < 1.81 mV and UV < 7.95 mV correspond to LGE (SI ≥ 35% of SImax) in areas devoid of fat (n = 10)102 LGE (ternary): 59% overlap between BV < 1.5 mV and areas of LGE on endocardial surface (n = 1).68 The agreement between epicardial BV < 1.5 mV and LGE was 32 ± 12% (n = 9)69 LGE (ternary): Endocardial cut-off values of BV < 2.04 mV and UV < 8.01 mV correspond to areas of LGE (SI ≥ 35% of SImax) (n = 19)103
|
|
| | CMR—human studies (whole heart histology): LGE (binary): Mid-wall LGE on CMR is confirmed as mid-wall fibrosis on histology (n = 7)92 LGE (binary): LGE (6SD) correlated to the total amount of fibrosis in transplanted hearts (n = 11)93 LGE (binary and ternary): different scar delineation methods resulted in markedly different estimates of scar location and size. No method was able to delineate diffuse fibrosis (n = 1)22 LGE has good side-to-side correlation with fibrosis in an explanted heart (n = 1)94 Post-contrast T1: Excellent agreement between T1 and diffuse fibrosis (n = 11)93
| Animal studies: | Contrast-enhanced CT: Wall thinning: agreement between BV < 1.5 mV and wall thinning (<5 mm) was 40% on the endocardium and 38% on the epicardium (n = 4)104 Wall thinning: BV < 1.5 mV agreed with wall-thinning (<5 mm) in 13 ± 16% on endocardium and 23 ± 21% on epicardium (n = 22)69 Wall thinning: BV < 1.5 mV matched with wall-thinning (<5 mm) with overlap of 63 ± 21% (n = 3)68 Contrast (binary): Low-voltage areas (BV < 1.5 mV, UV < 8.0 mV) can be predicted by delayed enhancement with a sensitivity of 78% and specificity of 91% (n = 19)71
|
|
| CMR—human studies (EMB): LGE (binary): LGE is poorly related to collagen volume fraction (n = 22)95 (n = 14)96 Post-contrast T1: extracellular volume on T1 mapping has a moderate (n = 36)96 to strong (n = 24)97 correlation with collagen volume fraction DWI: Correlation exists between diffusivity and percentage of fibrosis on histology in LVAD core biopsies (n = 14)98
| | ICE: |
| CT: Unknown | | |
| ICE: Unknown | | |
| Inflammatory Cardiac sarcoidosis | | Unknown | Unknown | Nuclear imaging: |
| Post-myocarditis | | CMR—human studies (whole heart histology): | Unknown | CMR—human studies: LGE: epicardial BV < 1.5 mV had an overlap of 76–83% with subepicardial LGE (n = 7,110,n = 2,68 and n = 19111)
|
| | | Contrast-enhanced CT—human studies: The agreement between BV < 1.5 mV and wall-thinning (5 mm) was 29% for the endocardium and 80% for the epicardium (n = 11)104 Overlap between wall-thinning (<5 mm) and epicardial low voltage (BV < 1.5 mV) was 55% (n = 7)110
|
|
| Inherited LMNA-mutation | | Unknown | Unknown | CMR—human studies: |
In a mixed cohort of DCM patients a higher cut-off value (6SD instead of the commonly used 2SD) has been proposed to delineate scar on LGE-CMR.93 However, in a patient with DCM and a more complex scar pattern, we could demonstrate that the application of different LGE scar delineation methods (both binary and ternary) resulted in markedly different estimates of scar location and size, and none of the methods were able to delineate diffuse fibrosis as identified on histology (Figure 3). Other techniques, such as T1 mapping93 and DWI98 may be able to identify diffuse interstitial fibrosis, a pattern which is more frequently observed in DCM. In cardiac sarcoidosis and LMNA-mutated patients, imaging has not been validated by histology.
In conclusion, imaging is able to delineate compact scar, but currently applied binary or ternary methods to quantify and delineate fibrosis may not reflect the complex architecture of fibrosis as observed in different aetiologies.
Validation of electroanatomical voltage mapping to delineate scar using histology as the gold standard
Electroanatomical voltage mapping (EAVM) is considered the gold standard in electrophysiology for invasive scar identification. Areas of low bipolar voltages (BV) <1.5 mV recorded with large tip electrodes (3.5–4.0 mm) are usually considered scar. However, bipolar electrogram amplitudes depend on electrode size and spacing, orientation of the catheter, and wavefront propagation. Therefore, new technologies, such as multielectrode mapping with small electrodes and omnipolar electrogram recordings may improve near field resolution and may allow orientation independent voltage mapping.65,114 Endocardial unipolar voltages (UV) <8.27 mV may be able to detect intramural or epicardial scar.115 It should be pointed out, however, that these cut-off values have not been validated against histology in all aetiologies. Most of the data are extrapolated from patients with ICM (Table 1 and Figure 1). In animal models of ICM areas of BV < 1 mV59 or BV < 1.5 mV correlated well with areas of scar as identified by gross pathology, both endocardially and epicardially.60,61 In dogs, an inverse relation existed between average BV amplitude and extent of scar transmurality.62 A case study of a patient with MSVT showed a good correlation between the area of scar on EAVM (<0.5 mV) and post-mortem scar size.63 In another case report, areas with BV < 0.5 mV on EAVM corresponded to areas with >80% fibrosis, whilst regions with BV > 1.5 mV corresponded to <20% fibrosis in post-mortem biopsies.64
In an ARVC patient, a correlation was found between low endocardial BV (<1.5 mV) areas and gross pathological abnormalities in the explanted heart if scar transmurality exceeded 60%.79 Others reported a good correlation between low endocardial BV areas and fibrofatty replacement identified on endomyocardial biopsy, although the transmurality and size of scar was not quantified in the biopsy.80–82 In a small series of three ARVC patients, endomyocardial biopsies taken from areas with UV < 5.5 mV and BV > 1.5 mV showed fibrofatty replacement on histology; implying that endocardial UV amplitudes may be more sensitive to scar in ARVC than endocardial BV amplitudes.83
Recently, post-mortem and post-transplant whole human heart histology from patients with DCM was used to validate EAVM. A linear relationship between the amount of viable myocardium and both BV and UV could be demonstrated, but no singular voltage cut-off value, which identifies pathological amounts of fibrosis, could be found.22 In a doxorubicin cardiomyopathy sheep model dividing the left ventricle into nine segments, a cut-off of 7.5 mV for UV and 2.7 mV for endocardial BV mapping was proposed to distinguish between segments containing <5% fibrosis and >10% fibrosis, with modest sensitivity and specificity.99 Electroanatomical voltage mapping has not been histologically validated in HCM, cardiac sarcoidosis, post-myocarditis, or LMNA-mutated patients.
Although EAVM is frequently used as the gold standard to delineate scar, it is poorly validated against the true gold standard (histology) in most aetiologies. Similar to the imaging modalities, currently applied binary or ternary voltage cut-off values to delineate (heterogeneous) scars are unlikely to reflect the complex histology.
Comparison between cardiac imaging and electroanatomical voltage mapping to delineate scar
As human histological data to validate either EAVM or imaging are sparse, the two indirect methods for scar delineation are frequently used to ‘validate’ each other (Table 1and Figure 1).
In ICM, LGE-CMR scar delineation methods have been compared to EAVM data. In animal infarct studies, LGE-CMR scar core correlated well with BV < 0.5 mV and scar core and border zone together corresponded to BV < 1.5 mV, when using the 3SD methods for scar delineation.116 In humans, 60% of SImax on LGE-CMR yielded the highest correlation to distinguish scar core (<0.5 mV) and border zone (0.5–1.5 mV) on EAVM.70 Dense (SI ≥ 50% of SImax), transmural scars corresponded well with BV < 1.5 mV; however, this cut-off could not accurately detect non-transmural, small subepicardial scar, nor transmural border zone (SI 35–50% of SImax).43 Several studies have shown a moderate correlation between areas of wall-thinning (<5 mm) on contrast-enhanced CT and low voltages (BV < 1.5 mV).68,69,71,72 A few studies have compared nuclear imaging to EAVM in ICM. BV < 0.5 mV could be predicted by PET with 89% sensitivity using a threshold of 50% metabolic activity to define scar.73 When PET-CT data were integrated with EAVM, the surface area of BV < 0.9 mV correlated best with the PET-defined scar (uptake <50%).74 Of interest, integrating FDG-PET-CT with EAVM revealed metabolically active channels within EAVM scar (BV < 0.5 mV).73 Electroanatomical voltage mapping findings have also been compared to areas of cardiac denervation using 123I-MIBG-SPECT. The area of EAVM scar (BV < 0.5 mV) was 2.5 times smaller than 123I-MIBG-denervated areas, whereas the EAVM border zone (BV 0.5–1.5 mV) was similar to the 123I-MIBG transition zone.75
Akinetic and thinned areas on ICE corresponded with electroanatomical low BV areas in a pig infarct model (<2 mV)59 and in a series of 15 patients after myocardial infarction (<1.5 mV).48 Of interest, in a mixed cohort of 22 patients (10 ICM, 12 DCM), 83 myocardial segments were analysed by ICE and EAVM. Low BV areas (<0.5 mV) showed significantly higher ICE derived SI (mean pixel SI unit) compared to areas with border zone voltages (0.5–1.5 mV) and normal myocardium areas, whereas EAVM border zone areas showed higher SI heterogeneity on ICE (SD of SI).49
In ARVC, both wall motion abnormalities and LGE on CMR have been compared with EAVM data. A good correlation between dyskinetic regions on CMR and low BV areas (<1.5 mV) has been reported.84,85 However, reports on the association between LGE-CMR and EAVM in ARVC are conflicting. Two studies report a poor association, with an underestimation of scar size on LGE-CMR compared to areas of BV < 1.5 mV, especially when low BV areas comprised <20% of the right ventricle.80,86 Another study reported a strong correlation between LGE-CMR and low voltage areas.85 Intramyocardial right ventricular fat infiltration derived from CMR was poorly associated with low voltage areas.85 In contrast, CT-derived intramyocardial fat and EAVM showed a good association in ARVC. A high agreement between right ventricular fat on CT (<−10 HU) and epicardial BV <1.0 mV87 or <1.5 mV69,88 or endocardial UV <5.5 mV has been reported.87,88 The association was weaker for endocardial BVs,69,87,88 probably due to the dominant subepicardial involvement in ARVC.13,83
In HCM, comparison between EAVM and imaging data has not been reported.
In DCM different BV and UV EAVM cut-off values to detect LGE-CMR derived scar have been suggested, likely due to differently applied algorithms in heterogeneous and small patient populations. The best endocardial cut-off values to detect LGE-CMR derived scar defined as SI ≥ 30% of SImax were BV < 2.04 mV and UV < 8.01 mV, respectively.103 Using the same CMR method, epicardial voltage mapping with cut-offs of BV < 1.81 mV and UV < 7.95 mV could delineate LGE-CMR derived scar in areas devoid of epicardial fat.102 In a heterogeneous group of patients (10 DCM and 5 cardiac sarcoidosis), endocardial BV < 1.78 mV and UV < 5.64 mV were able to identify areas of LGE (>6SD above remote myocardium).101 In another heterogeneous series (11 DCM and 4 cardiac sarcoidosis), endocardial cut-off values of BV < 1.55 mV and UV < 6.78 mV were reported to identify scar on LGE-CMR (full width at half maximum method).100 There is little data on contrast-enhanced CT findings in DCM with contradictory reports regarding the relationship between (rarely observed) wall thinning (<5 mm) and low voltage areas.68,69,71,104 One study reported a poor (13%) agreement between wall-thinning and endocardial BV < 1.5 mV,69 whilst another reported an agreement of 63%.68,104 Delayed enhancement on CT could predict low voltage areas (BV < 1.5 mV and UV < 8.0 mV) with a sensitivity of 78% in a heterogeneous series of 19 patients with DCM.71 There is sparse data comparing ICE and EAVM in DCM. In a small and pre-selected series of 18 patients with DCM and increased echogenicity of the mid/subepicardial lateral wall on ICE, echogenic areas corresponded to epicardial BV areas < 1.0 mV.105
With regard to the more specific DCM-aetiologies, one cardiac sarcoidosis report suggested a good correlation between areas of active inflammation by PET-CT and low voltage zones.106 In patients with presumed post-myocarditis subepicardial LGE on CMR showed a reasonable overlap of 76–83% with epicardial BV < 1.5 mV areas.68,110,111 Using CT data, the agreement between wall-thinning (<5 mm) and BV < 1.5 mV was 29% for the endocardium, but 80% for the epicardium in 11 patients, likely due to the dominant subepicardial involvement in post-myocarditis.104 In a LMNA patient, a case report showed good correlation between EAVM and LGE-CMR.112
Although most reports showed a good correlation between EAVM-derived scar delineation based on BV and cardiac imaging for transmural post-infarct scars, there are inconsistent data concerning non-transmural and non-ischaemic scars. LGE-CMR seems to be superior to EAVM in detecting localized fibrosis in humans with DCM, at least if a single voltage cut-off value is applied, regardless of the variation in wall thickness.22 In contrast, in ARVC, EAVM seems to be currently superior to any image modality in detecting right ventricular involvement (Table 1). Whether functional image modalities provide supplementary information to EAVM that might be important for interventional VT treatment, requires further studies.
The arrhythmogenic substrate for monomorphic sustained ventricular tachycardia
Scar in SHD is not the same as the substrate for MSVT. The presumed dominant mechanism for MSVT in patients with SHD is myocardial re-entry facilitated by slow conduction and areas of fixed or functional conduction block. The only human histological data on MSVT isthmuses come from activation mapping and histological examination of the diastolic pathway in infarcted, explanted, Langendorff-perfused hearts from patients who underwent heart transplantation.5,6 Branching and merging surviving myocardial bundles, with a range in diameter from that of a single cell to a few millimetres, separated by collagenous septa, provided the histological substrate for slow conduction during VT, typically located in the subendocardium. The smallest described widths of a diastolic pathway of fast VT with a short diastolic interval traversing the infarct, was ∼250 μm.5 There are no human or animal model data on the specific histological characteristics of the arrhythmogenic substrate for MSVT in non-ischaemic aetiologies (Figure 1).
Activation mapping has evolved as the current clinical gold standard to identify the underlying mechanism and to localize the isthmus of macro-reentrant VT. It aims to localize low amplitude diastolic electrograms of surviving bundles. Although left ventricular assist devices may allow for activation mapping of poorly tolerated VT, detailed human data on entire re-entry circuits, particularly for non-ischaemic aetiologies, are meagre. In addition, focal MSVT mechanism have been reported in both ischaemic and non-ischaemic aetiologies.23
Accordingly, substrate mapping has become an important strategy which relies on scar delineation based on voltages and, additionally, on the identification of electrograms potentially consistent with (delayed) activation of ‘channels of surviving bundles’ during stable rhythm. Poorly coupled, fractionated, split, and late potentials are considered as surrogate for VT substrate. Fractionated electrograms have been recorded from areas of scar (defined by histology) in animal infarct models.59 In DCM, fragmented electrograms were related to fibrotic barriers in human explanted papillary muscles.117 Notably, the architecture of fibrosis was more important than its density to generate conduction disturbances.6,118
More recently, broader definitions of abnormal electrograms [local abnormal ventricular activities (LAVA)] have been suggested.119 Local abnormal ventricular activities corresponded to areas of scar (on LGE-CMR and CT) in ICM68,69,72 and intramyocardial fat (on CT) in ARVC.69,88 The correlation between LAVA and scar in DCM is less favourable and inconsistent (overlap 29–72% on CT and 37–88% on LGE-CMR),68,69,104 and there is a paucity of data on the underlying tissue architecture and specificity and sensitivity of LAVAs for the critical VT substrate.
Of importance, high-resolution mapping data of VT circuits in a chronic anterior infarct animal model could demonstrate that the isthmus of infarct-related circuits was formed by functional rather than fixed lines of block. Critical isthmus sites may therefore not be evident during sinus rhythm (SR) as they depend on pacing rate, coupling intervals, and vector of wavefront propagation.120
Capability of cardiac imaging to detect the substrate of ventricular tachycardia
Human data comparing the histology of VT substrate with cardiac imaging are difficult to obtain (Figure 1). Therefore, most human studies have validated the ability of imaging to detect sites related to VT re-entry circuits against EAM data. The VT-related sites were usually identified by pacemapping during SR (electrophysiological surrogate for VT-related sites) and less frequently by the gold standard activation mapping, entrainment mapping, or VT-termination (Supplementary material online, Table S1). In some reports, the VT-related sites were defined using LAVAs as surrogates for potential VT substrate.68,69,72,121
In three pig (ICM models) and 17 human studies, imaging was used to investigate myocardial tissue characteristics at sites with confirmed VT re-entry circuits or at sites with assumed VT substrate (Supplementary material online, Table S1). These studies included in total 274 ICM, 124 DCM, and 19 ARVC patients. However, the individual study populations were generally small (only five of the human studies comprised >20 patients69,71,122–124), heterogeneous, and some patients were likely included in multiple reports from the same group.
Although several imaging modalities were evaluated, most studies used LGE-CMR (Supplementary material online, Table S1). The studies mainly employed 2D LGE-CMR with good in-plane resolution but 5–8 mm slice thickness. High-resolution isotropic 3D LGE-CMR was performed in humans by two research groups.68–70,122,123
In general, the studies evaluated the spatial relationship between binary-defined scar on imaging and VT isthmuses (or surrogates thereof).43,47,68,69,71,72,101,102,116,125–127 A minority of the studies aimed to identify the more complex characterization of scar, such as delineation of scar core and border zone124,128–130 or provided data on scar pattern and transmurality.101,124,131 The locations of scar (on imaging) and VT-related sites (on EAM) were either evaluated by image integration43,101,125,127–129,131 or by side-by-side comparison per cardiac segment.47,71,128 Moreover, different groups used different methods and thresholds to define scar (Supplementary material online, Table S1), making comparisons between the studies difficult.
Despite the limitations, the studies have consistently shown that, regardless of the aetiology and imaging modality used, virtually all VT-related sites, electrophysiological surrogates for VT sites (e.g. pacemapping) or surrogates for potential VT substrate (e.g. LAVAs) were located within the scar or close to its border (Supplementary material online, Table S1).
Conflicting results have been reported regarding more specific scar characteristics at the VT-related sites as derived from LGE-CMR. While some authors found 71–100% of VT-related sites or surrogates in areas of dense scar (defined by >3SD or >50% of SImax, respectively),128,130 others have observed clustering of VT-related sites (or their surrogates) around the border of the scar.47,72
In contrast, two research groups have reported that 74–100% of VT-related sites were located in LGE derived border zone channels within dense scar.122,132 In both studies, LGE-derived border zone channels were first compared to channels with intermediate BV within low-voltage areas, referred to as conducting channels. Voltage channels were determined either by individually adapting the upper and lower voltage threshold for scar132 or by using standard, fixed BV thresholds.122 The LGE-CMR border zone channels were detected either on raw LGE-CMR images in two layers70,132 or on projected SI maps in five concentric layers (10%, 25%, 50%, 75%, and 90% of the wall thickness),122,123 with border zone defined as 40–60% and scar core as >60% SI of the SImax.70,122,123 However, users were allowed, at their discretion, to adjust the SI thresholds by ±5%.122,123 In this context, it is important to realize that even a minimal change in the definition of scar core and border zone can generate a different number and orientation of channels within a layer (Figure 4).

Figure 4
Impact of changes in scar delineation methods on LGE-CMR defined channels: a patient with anterior infarction. All images in modified superior view. Left: channels calculated by an automated algorithm.133 The percentages represent arbitrary threshold definitions of scar border zone and scar core, respectively (as % of SImax). A 1% change in the threshold definition resulted in a change of the number of channels (±1) and their orientation within a layer, although the change in the extent of scar was visually almost indiscernible. Therefore, it is important to visualize the channels also in a 3D-reconstruction from multiple layers and to use electrogram data during ablation. Right: endocardial bipolar voltage map of the same patient. White spheres mark exits of two clinical VTs (identified by pacemapping and confirmed by non-inducibility of the VTs after ablation at these sites). It should be highlighted that this figure demonstrates only one case; the within-patient reproducibility and diagnostic accuracy of this promising technique for identification of VT substrate needs to be determined by a systematic study. CMR, cardiac magnetic resonance; EAM, electroanatomical mapping; LGE, late gadolinium enhancement; VT, ventricular tachycardia.
Despite the different SI methods and EAVM thresholds, the majority (81–100%) of EAVM conducting channels had a matching SI channel in orientation and involved left ventricular segment.70,122,123,132 However, not all matching channels were VT related and EAVM seemed to be still superior to LGE-CMR as 23 of 23 VT isthmus sites were related to EAVM conducting channels compared to 17 of 23 sites to border zone channel on CMR.122
There are limited studies that report on VT-related sites and LGE-CMR scar characteristics in DCM patients. Including VT isthmuses identified by activation mapping, entrainment and VT termination as the gold standard, we could demonstrate that all concealed entrainment sites, and 77% of VT termination sites were located in areas with ≥75% scar transmurality and in areas of transition from scar core (SI ≥ 50% of SImax) to border zone (SI 35–50% of SImax).124 These results were comparable between DCM and ICM patients. In contrast, in a heterogeneous group of DCM patients (5 cardiac sarcoidosis and 10 idiopathic DCM), 15 of 18 VT-related sites, identified mostly by pacemapping, occurred in scar (defined as SI >6 SD above the mean SI of remote myocardium) with 25–75% transmurality. Only one of the 18 VT-related sites occurred in transmural scar.101 These inconsistent results may be due to differently applied SI algorithm for scar delineation.
Functional imaging can provide additional information on metabolism, perfusion and innervation. Using 82Rb-PET, 50% of VT exits were found in extensions of viable hibernating myocardium.134 Of interest, 123I-MIBG–SPECT showed that 36% of all ablation sites were in areas that had normal BV but abnormal sympathetic innervation.75 Whether nuclear imaging provides complementary information on the arrhythmogenic substrate requires further studies.
In conclusion, there is unambiguous evidence that most VT-related sites arise from scar as detected by imaging. In this regard, LGE-CMR appears to be the superior and most studied modality. However, currently available in vivo imaging techniques seem to be insufficient to precisely delineate parts of the scar that are required to sustain MSVT.
Impact of cardiac imaging on outcome of ablation
The impact of pre-procedural imaging and/or real-time image integration on the outcome of VT ablation has not been evaluated in randomized trials. Nevertheless, small non-randomized studies suggest that imaging may have a valuable adjunctive role to conventional EAM-guided ablation (Supplementary material online, Table S2).
One group could demonstrate that pre-procedural evaluation of scar transmurality in ICM patients may affect the choice of the most effective approach to ablation. Patients with a transmural scar [which was detected by LGE-CMR (56%), transthoracic echocardiography (51%), CT (28%), or SPECT (8%)] had fewer VT recurrences after ablation if they underwent first-line combined endo-epicardial ablation compared to endocardial ablation only.135
Pre-procedural evaluation of scar may be even more valuable in DCM patients with a wide range of scar patterns and locations. In a retrospective analysis, a better acute outcome of VT ablation could be observed in DCM patients who underwent pre-procedural LGE-CMR and intraprocedural integration of the segmented scar, compared to patients without imaging.136 In fact, the use of pre-procedural LGE-CMR was the only independent determinant of procedural success. The clinical benefit was attributed to the fact that knowledge of the location and pattern of the scar (which was intramural in 71% of the cases) resulted in a more effective ablation strategy. The authors reported that imaging helped to reveal intramural scars in areas with normal BV and allowed for adaption of the ablation strategy accordingly; e.g. an epicardial approach for epicardial and free-wall intramural scars, a biventricular approach for septal intramural scars, and longer radiofrequency applications at higher power for intramural scars. However, neither a more frequent epicardial approach, nor differences in radiofrequency applications or mapping density were reported in the imaging group.136
Two retrospective studies, which included predominantly ICM patients, reported an independent association between real-time integration of LGE-CMR and/or wall-thinning and long-term procedural success.121,133 In the first study, the strategy was to eliminate all LAVAs,121 in the second the strategy was to target slow conduction channels detected by EAM.133 While image integration helped to identify areas of interest and facilitated substrate mapping, EAM characteristics were ultimately used to identify ablation targets.
In a recent report, long-term VT recurrence was compared between 11 ICM/DCM patients who underwent LGE-CMR image integration and 11 non-randomized controls without pre-procedural imaging.137 In the imaging group, all low-voltage areas and all areas of LGE-CMR derived scar were targeted by ablation. The authors found, by Cox regression, significant association between the use of image integration and VT recurrence [HR 0.12 (95% CI 0.02–0.75) adjusted for five covariates], even though the rate of VT recurrence did not differ between the imaging and non-imaging group (7/11 vs. 9/11, P = 0.4). Details on the regression analysis were not provided.
To assess the true impact of cardiac imaging on procedural safety and efficacy, a prospective randomized trial is needed. Such a trial should include a comprehensive description of how cardiac imaging is implemented in the workflow of mapping and ablation and, additionally, time efficiency and cost effectiveness should be evaluated.138,139 Despite a lack of randomized, prospective data, there is increasing evidence that multimodal imaging plays an important role in patients undergoing VT ablation.
Pre-procedural and intraprocedural multimodal imaging: practical considerations
Pre-procedural transthoracic echocardiography is recommended to evaluate cardiac and valvular function, and to exclude mobile intracavitary thrombi, although in this regard, CMR may be more accurate.1,140 Pre-procedural LGE-CMR and PET-CT can provide important insights in the potential underlying aetiology and disease activity (e.g. cardiac sarcoidosis), which may impact type and timing of intervention.141–143
The most important information gained from pre-procedural LGE-CMR is the location and pattern of scar (Figures 5 and 6). Presence of a subepicardial, free-wall intramural, transmural, or inferolateral scar may justify a first-line endo-epicardial approach.87,102,131,135,144,145 Absence of such scar distribution may help prevent unnecessary epicardial access, thus avoiding an additional 4–7% risk of associated major complications.146,147
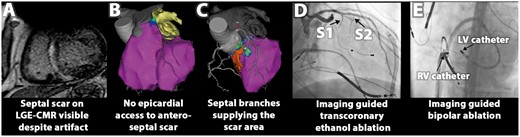
Figure 5
Example of multimodal image integration to facilitate bailout treatment strategies: (A) pre-procedural LGE-CMR shows septal scar, extending to left ventricular (LV) summit. (B) Integrated biventricular endocardial mapping (right ventricular (RV) and LV bipolar voltage maps, purple indicates normal bipolar voltage) confirms that the scar is not accessible through epicardial approach. (C) LV unipolar voltage mapping (purple indicates normal voltages) could not delineate the entire segmented scar (shown in orange), which was supplied by two septal branches (S1 and S2) as evident from CT/CMR image integration, allowing for transcoronary ethanol ablation (D) and imaging guided bipolar ablation between two ablation catheters located at the RV and LV site of the segmented scar (E). Bailout strategies reduced VT burden in this patient; after surgical resection patient has been entirely VT free. CMR, cardiac magnetic resonance; LGE, late gadolinium enhancement.

Figure 6
Use of multimodal image integration to facilitate epicardial ablation: (A) inferior-lateral intramural/subepicardial scar with localized ≥75% scar transmurality identified on LGE-CMR pre-procedurally. (B) Multimodal image integration: left: no coronary arteries extending over area of interest nor significant epicardial fat layer (epicardial shell colour coded for fat thickness according to bar). Right: transition between scar core (orange) and border zone (yellow) and higher scar transmurality shown with grey overlay. (C) High density mapping of area of interest (core—border zone transition, ≥75% scar transmurality), all VT-related sites were located in or near the area of interest. CL, cycle length; VT, ventricular tachycardia.
Likewise, scar located in the recess of the mitral valve may be more easily reached by a retrograde rather than transseptal approach.148 On the other hand, involvement of the interventricular septum may require a biventricular approach and additional ablation from the aortic root.69,102,136
Real-time integration of imaging-derived scar at the beginning of the ablation procedure enables one to focus high-resolution EAM on scar areas harbouring potential VT substrate, which likely reduces procedure time (Figure 6).133 Visualization of scar may also help to identify VT substrate in regions with ‘normal’ voltage,43,75 or reveal falsely low voltage due to poor catheter contact.43 Intramural scar may require longer and more powerful radiofrequency applications or alternative technologies [e.g. bipolar ablation, transcoronary ethanol ablation (Figure 5), coil embolization, needle catheter, half saline irrigation, or gadolinium-facilitated radiofrequency ablation].136,149,150 Real-time integration of CT may be particularly helpful for epicardial VT ablation.102 Visualization of epicardial fat may help in interpretation of epicardial low voltage during mapping and in adaptation of radiofrequency energy during ablation (Figure 7). It has been shown that a layer of >2.8 mm of fat significantly attenuates BV102,152 and a layer of 7–10 mm of fat may prevent effective ablation by conventional techniques.152,153 Of note, a >4 mm thick layer of fat covers about 25% of epicardial surface, mainly located at the base of the ventricles, acute margin, and interventricular grooves—locations which are often targeted by ablation in patients with DCM.153
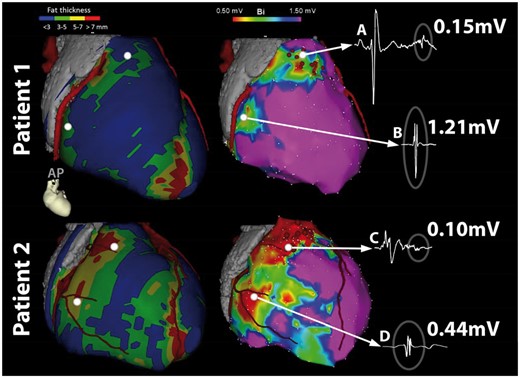
Figure 7
Modified from JACC, reprinted with permission.151 CT-Image integration used to visualize epicardial fat thickness for interpretation of epicardial BV: two endurance athletes with isolated epicardial scar in the anterior right ventricular outflow tract. Left: epicardial contours colour-coded for epicardial fat thickness according to bar, together with coronary arteries in a modified right anterior oblique view, right: epicardial bipolar voltage maps from the same two patients. Integration of epicardial fat images together with abnormal electrogram characteristics allows for classification of electograms; (A) low-voltage electrogram with late potential in area without fat is due to scar (B) low voltage due to fat (C) low voltage, fragmented electrogram due to scar potentially attenuated due to fat (D) very low-voltage electrogram due to fat.
Another virtue of CT is the ability to accurately visualize the coronary arteries and in 74–85% of the patients also the course of the left-sided phrenic nerve.153–155 Imaging and accurate integration of the coronary artery tree (Figure 8) can minimize coronary injections during epicardial mapping/ablation, without concerns for coronary injury.153 Whether visualization of the phrenic nerve by CT is sufficient to prevent nerve injury without confirming its position by high-output pacing has not yet been evaluated.
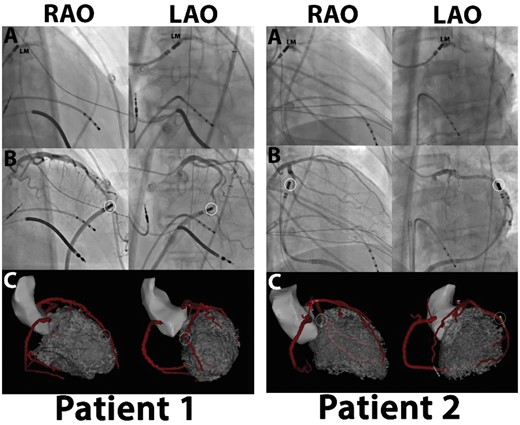
Figure 8
Evaluation of the image integration accuracy using the left main as single landmark: (A) left main (LM) position confirmed by contrast injection through irrigation port of ablation catheter. LM position tagged and used to align images. (B, C) Unique anatomical features used to confirm accuracy of integration. Catheter located epicardially next to curvature (Patient 1) or bifurcation (Patient 2), as seen on coronary angiography. Location of catheter as visualized on CARTO-software confirms location at same anatomical location relative to coronary anatomy without additional automatic or manual adaption after single-landmark image integration. LAO, left anterior oblique; RAO, right anterior oblique.
Intraprocedural guidance by ICE may be particularly helpful for ablating intracavitary structures with complex anatomy such as papillary muscles.156 Intracardiac echocardiography may also be used to verify catheter contact and for real-time monitoring of lesion formation.157
Workflow of image integration
Although there are many ways to integrate images with EAM data, there are basic principles common to all (Figure 9).75,101,121,124,130,133,134,137 The first step is extracting anatomical structures (e.g. chamber of interest with endocardial and epicardial contours, coronary arteries, venous structures, epicardial fat thickness, phrenic nerve) and tissue characteristics of interest (e.g. scar core, border zone, SI channel) by manual and semiautomated segmentation techniques. Segmentation of scar and specific tissue characteristics from LGE-CMR requires single SI thresholds. As outlined above, there is no consensus on the SI algorithm that should be used and small changes in scar definition impact segmentation results (Figures 3 and 4).
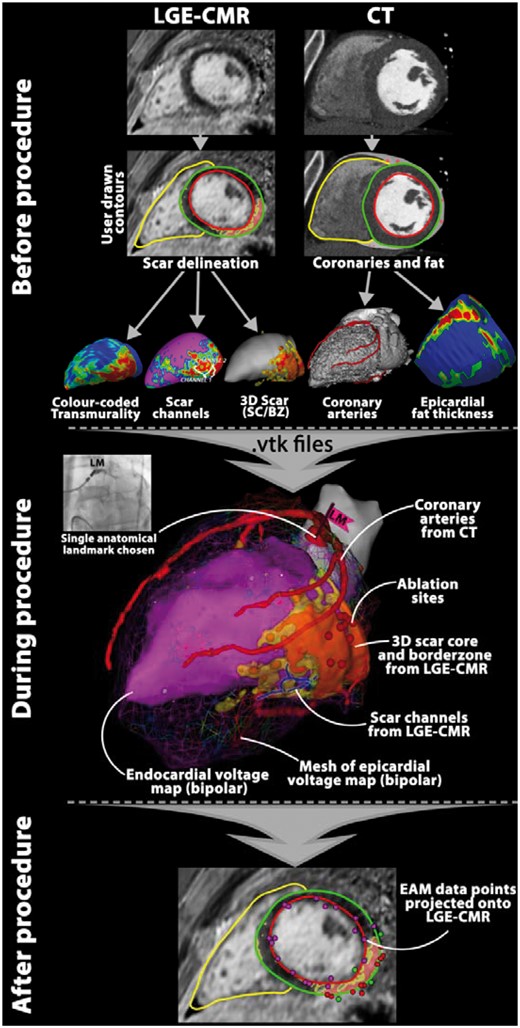
Figure 9
Example of workflow for image integration using CARTO® 3: see text for additional explanation. BZ, border zone; CMR, cardiac magnetic resonance; CT, computed tomography; EAM, electroanatomical mapping; LGE, late gadolinium enhancement; SC, scar core.
In the next step, the segmented structures are reconstructed and exported as 3D meshes (most commonly as .vtk files). Various quantitative and qualitative tissue characteristics—such as scar transmurality, wall thickness, or averaged SI—can be colour-coded and projected on the surface of a 3D shell of the ventricles (Figure 9).43 The term SI map refers to a 3D shell, colour-coded for SI of all voxels at a particular layer of the myocardium.133 Registration of the image-derived 3D models (.vtk files) with EAM is usually done by landmark registration, which is followed by an automatic registration algorithm, and occasionally by manual correction. The technical aspects of the image registration and the achieved accuracies are described in detail elsewhere.158 Typical reported registration error (the mean distance between the image mesh/surface and the EAM surface) is 2.0–4.8 mm.158 However, a small registration error does not necessarily imply good registration accuracy, especially if an automated registration algorithm permits rotation.159
We prefer a single-landmark registration, using the ostium of the left main coronary artery. The ostium can be readily visualized by injecting contrast dye through an open-irrigation tip ablation catheter (Figures 8 and 9). The 3D images are then usually only translated to the correct position, without the need for rotation. The accuracy of the registration during epicardial mapping can be verified by placing the tip of an ablation catheter on a distinct epicardial anatomical landmark which can be directly visualized by angiography. An example of such validation landmark is the bifurcation of a major branch of the left coronary artery (Figure 8).
After the procedure, the registration matrix used for the real-time image integration can be utilized to project exported EAM points on the original raw images (Figure 9). Such an approach provides a particularly productive framework for investigating the relationship between VT and complex scar characteristics.
Future perspectives
Image integration is routinely performed in only a few electrophysiology labs in the world. One of the reasons is the lack of a universal, user-friendly, yet user-adjustable software platform that would streamline the laborious process. Development of such a platform should be co-ordinated by a multicentre consensus. Moreover, to generate reproducible results, there is a need for standardization of definitions of tissue characteristics, such as scar core and border zone, which would ideally be histologically validated for ischaemic and non-ischaemic aetiologies.
Until recently, the presence of an implantable cardioverter-defibrillator (ICD) was considered to be a contraindication for CMR, thus excluding most patients undergoing VT ablation. However, emerging evidence indicated that CMR could be safely performed in most patients with current generation ICD.160,161 In addition, promising CMR techniques, such as wideband LGE-CMR, are evolving which minimize imaging artefacts caused by devices.162
To overcome the limitations of performing CMR in patients with ICDs, there has also been rising interest in the detection of scar using CT. Promising CT techniques are being developed that will hopefully enable reliable delineation of myocardial scar. These techniques include delayed-enhancement CT and virtual monochromatic imaging.46 Future CT scanners with dual energy sources will also likely reduce contrast load.46
To improve imaging of the arrhythmogenic substrate there is a need for scanners with better spatial resolution. Current state-of-the-art navigator gated 3D LGE-CMR at 3T can generate continuous in vivo images with voxel resolution of 1.4 × 1.4 × 1.4 mm.133 Such resolution may be sufficient for quantification of a compact scar, but it is suboptimal for accurate visualization of the intricate architecture of fibrosis.5 Advanced cardiac T1 mapping techniques and accelerated diffusion-weighted CMR acquisition sequences together with improved post-processing techniques may allow detailed imaging of the diseased myocardium. Although DWI may provide unique information on structure and integrity of the myocardium, current acquisition times, and motion sensitivity require further improvements before being used in clinical practice.45
One of the inherent limitations of integrating pre-acquired LGE images, are the potential changes that may occur between the image acquisition and ablation (e.g. due to change in volume load or heart rhythm). This limitation can be overcome by performing CMR directly in the electrophysiology lab. Real-time CMR enables direct tracking of catheters, avoids registration error, and provides feedback on lesion formation.163,164 Promising results from animal studies indicate that such real-time visualization of ablation lesions could be used in the future for titrating radiofrequency energy.165
There are several other evolving technologies that might help in the future in personalized VT ablation, including body surface mapping and image-based arrhythmia modelling. A detailed description of these techniques is beyond the scope of this review, and we therefore refer to recent review articles.166,167
Finally, for further development of imaging modalities for non-invasive identification of arrhythmogenic substrate, it is essential to improve our understanding of its complex ultrastructural and functional components. This will require close co-operation of basic research scientists, clinical electrophysiologists, and cardiovascular imaging specialists. It is also important to critically re-evaluate the capability of currently used imaging techniques. Concepts such as binary or ternary division of scar based on arbitrary cut-offs may be clinically appealing, but oversimplified.
Funding
The Department of Cardiology (Leiden University Medical Centre) receives unrestricted grant from Edwards Lifesciences, Medtronik, Biotronik, and Boston Scientific. M.S. was supported by the Research Fellowship of the European Society of Cardiology (2017/2018).
Conflict of interest: none declared.
References
1Priori
SG
, Blomstrom-Lundqvist
C
, Mazzanti
A
, Blom
N
, Borggrefe
M
, Camm
J
et al.
2015 ESC Guidelines for the management of patients with ventricular arrhythmias and the prevention of sudden cardiac death
.
Europace
2015
;
17
:
1601
–
87
.
2Moher
D
, Liberati
A
, Tetzlaff
J
, Altman
DG.
Preferred reporting items for systematic reviews and meta-analyses: the PRISMA statement
.
PLoS Med
2009
;
6
:
e1000097.
3Pinto
YM
, Elliott
PM
, Arbustini
E
, Adler
Y
, Anastasakis
A
, Bohm
M
et al.
Proposal for a revised definition of dilated cardiomyopathy, hypokinetic non-dilated cardiomyopathy, and its implications for clinical practice: a position statement of the ESC working group on myocardial and pericardial diseases
.
Eur Heart J
2016
;
37
:
1850
–
8
.
4Pop
M
, Ghugre
NR
, Ramanan
V
, Morikawa
L
, Stanisz
G
, Dick
AJ
et al.
Quantification of fibrosis in infarcted swine hearts by ex vivo late gadolinium-enhancement and diffusion-weighted MRI methods
.
Phys Med Biol
2013
;
58
:
5009
–
28
.
5de Baker
JMT
, Coronel
R
, Tasseron
S
, Wilde
AAM
, Opthof
T
, Janse
MJ
et al.
Ventricular tachycardia in the infarcted, Langendorff-perfused human heart: role of the arrangement of surviving cardiac fibers
.
J Am Coll Cardiol
1990
;
15
:
1594
–
607
.
6de Bakker
JM
, van Capelle
FJ
, Janse
MJ
, Tasseron
S
, Vermeulen
JT
, de Jonge
N
et al.
Slow conduction in the infarcted human heart. ′Zigzag′ course of activation
.
Circulation
1993
;
88
:
915
–
26
.
7de Bakker
JM
, van Capelle
FJ
, Janse
MJ
, Wilde
AA
, Coronel
R
, Becker
AE
et al.
Reentry as a cause of ventricular tachycardia in patients with chronic ischemic heart disease: electrophysiologic and anatomic correlation
.
Circulation
1988
;
77
:
589
–
606
.
8Beltrami
CA
, Finato
N
, Rocco
M
, Feruglio
GA
, Puricelli
C
, Cigola
E
et al.
Structural basis of end-stage failure in ischemic cardiomyopathy in humans
.
Circulation
1994
;
89
:
151
–
63
.
9Bolick
DR
, Hackel
DB
, Reimer
KA
, Ideker
RE.
Quantitative analysis of myocardial infarct structure in patients with ventricular tachycardia
.
Circulation
1986
;
74
:
1266
–
79
.
10Dillon
SM
, Allessie
MA
, Ursell
PC
, Wit
AL.
Influences of anisotropic tissue structure on reentrant circuits in the epicardial border zone of subacute canine infarcts
.
Circ Res
1988
;
63
:
182
–
206
.
11Corrado
D
, Basso
C
, Judge
DP.
Arrhythmogenic cardiomyopathy
.
Circ Res
2017
;
121
:
784
–
802
.
12Marcus
FI
, Edson
S
, Towbin
JA.
Genetics of arrhythmogenic right ventricular cardiomyopathy: a practical guide for physicians
.
J Am Coll Cardiol
2013
;
61
:
1945
–
8
.
13Basso
C
, Thiene
G
, Corrado
D
, Angelini
A
, Nava
A
, Valente
M.
Arrhythmogenic right ventricular cardiomyopathy. Dysplasia, dystrophy, or myocarditis?
Circulation
1996
;
94
:
983
–
91
.
14Lombardi
R
, Dong
J
, Rodriguez
G
, Bell
A
, Leung
TK
, Schwartz
RJ
et al.
Genetic fate mapping identifies second heart field progenitor cells as a source of adipocytes in arrhythmogenic right ventricular cardiomyopathy
.
Circ Res
2009
;
104
:
1076
–
84
.
15Fletcher
A
, Ho
SY
, McCarthy
KP
, Sheppard
MN.
Spectrum of pathological changes in both ventricles of patients dying suddenly with arrhythmogenic right ventricular dysplasia. Relation of changes to age
.
Histopathology
2006
;
48
:
445
–
52
.
16Tabib
A
, Loire
R
, Chalabreysse
L
, Meyronnet
D
, Miras
A
, Malicier
D
et al.
Circumstances of death and gross and microscopic observations in a series of 200 cases of sudden death associated with arrhythmogenic right ventricular cardiomyopathy and/or dysplasia
.
Circulation
2003
;
108
:
3000
–
5
.
17Thiene
G.
The research venture in arrhythmogenic right ventricular cardiomyopathy: a paradigm of translational medicine
.
Eur Heart J
2015
;
36
:
837
–
46
.
18Elliott
PM
, Anastasakis
A
, Borger
MA
, Borggrefe
M
, Cecchi
F
, Charron
P
et al.
2014 ESC Guidelines on diagnosis and management of hypertrophic cardiomyopathy: the Task Force for the Diagnosis and Management of Hypertrophic Cardiomyopathy of the European Society of Cardiology (ESC)
.
Eur Heart J
2014
;
35
:
2733
–
79
.
19Hughes
SE.
The pathology of hypertrophic cardiomyopathy
.
Histopathology
2004
;
44
:
412
–
27
.
20St John Sutton
MG
, Lie
JT
, Anderson
KR
, O’Brien
PC
, Frye
RL.
Histopathological specificity of hypertrophic obstructive cardiomyopathy. Myocardial fibre disarray and myocardial fibrosis
.
Br Heart J
1980
;
44
:
433
–
43
.
21Teare
D.
Asymmetrical hypertrophy of the heart in young adults
.
Br Heart J
1958
;
20
:
1
–
8
.
22Glashan
CA
, Androulakis
AFA
, Tao
Q
, Glashan
RN
, Wisse
LJ
, Ebert
M
et al.
Whole human heart histology to validatie electroanatomical voltage mapping in patients with non-ischaemic cardiomyopathy and ventricular tachycardia
.
Eur Heart J
2018
. doi:10.1093/eurheartj/ehy168 [Epub ahead of print].
23Pogwizd
SM
, McKenzie
JP
, Cain
ME.
Mechanisms underlying spontaneous and induced ventricular arrhythmias in patients with idiopathic dilated cardiomyopathy
.
Circulation
1998
;
98
:
2404
–
14
.
24Roberts
WC
, Siegel
RJ
, McManus
BM.
Idiopathic dilated cardiomyopathy: analysis of 152 necropsy patients
.
Am J Cardiol
1987
;
60
:
1340
–
55
.
25Unverferth
DV
, Baker
PB
, Swift
SE
, Chaffee
R
, Fetters
JK
, Uretsky
BF
et al.
Extent of myocardial fibrosis and cellular hypertrophy in dilated cardiomyopathy
.
Am J Cardiol
1986
;
57
:
816
–
20
.
26Leeuw
N
, Ruiter
DJ
, Balk
AHMM
, Jonge
N
, Galama
JMD
, Melchers
WJG.
Histopathologic findings in explanted heart tissue from patients with end-stage idiopathic dilated cardiomyopathy
.
Transpl Int
2001
;
14
:
299
–
306
.
27Almaas
VM
, Haugaa
KH
, Strøm
EH
, Scott
H
, Dahl
CP
, Leren
TP
et al.
Increased amount of interstitial fibrosis predicts ventricular arrhythmias, and is associated with reduced myocardial septal function in patients with obstructive hypertrophic cardiomyopathy
.
Europace
2013
;
15
:
1319
–
27
.
28Sugrue
DD
, Holmes
DR
Jr, Gersh
BJ
, Edwards
WD
, McLaran
CJ
, Wood
DL
et al.
Cardiac histologic findings in patients with life-threatening ventricular arrhythmias of unknown origin
.
J Am Coll Cardiol
1984
;
4
:
952
–
7
.
29Tavora
F
, Cresswell
N
, Li
L
, Ripple
M
, Solomon
C
, Burke
A.
Comparison of necropsy findings in patients with sarcoidosis dying suddenly from cardiac sarcoidosis versus dying suddenly from other causes
.
Am J Cardiol
2009
;
104
:
571
–
7
.
30Bagwan
IN
, Hooper
LV
, Sheppard
MN.
Cardiac sarcoidosis and sudden death. The heart may look normal or mimic other cardiomyopathies
.
Virchows Arch
2011
;
458
:
671
–
8
.
31Roberts
WC
, McAllister
HA
Jr, Ferrans
VJ.
Sarcoidosis of the heart. A clinicopathologic study of 35 necropsy patients (group I) and review of 78 previously described necropsy patients (group II)
.
Am J Med
1977
;
63
:
86
–
108
.
32Silverman
KJ
, Hutchins
GM
, Bulkley
BH.
Cardiac sarcoid: a clinicopathologic study of 84 unselected patients with systemic sarcoidosis
.
Circulation
1978
;
58
:
1204
–
11
.
33Captur
G
, Arbustini
E
, Bonne
G
, Syrris
P
, Mills
K
, Wahbi
K
et al.
Lamin and the heart
.
Heart
2018
;
104
:
468
–
79
.
34Sepehrkhouy
S
, Gho
J
, van Es
R
, Harakalova
M
, de Jonge
N
, Dooijes
D
et al.
Distinct fibrosis pattern in desmosomal and phospholamban mutation carriers in hereditary cardiomyopathies
.
Heart Rhythm
2017
;
14
:
1024
–
32
.
35Raman
SV
, Sparks
EA
, Baker
PM
, McCarthy
B
, Wooley
CF.
Mid-myocardial fibrosis by cardiac magnetic resonance in patients with lamin A/C cardiomyopathy: possible substrate for diastolic dysfunction
.
Jo Cardiovasc Magn Reson
2007
;
9
:
907
–
13
.
36Hookana
E
, Junttila
MJ
, Sarkioja
T
, Sormunen
R
, Niemela
M
, Raatikainen
MJ
et al.
Cardiac arrest and left ventricular fibrosis in a Finnish family with the lamin A/C mutation
.
J Cardiovasc Electrophysiol
2008
;
19
:
743
–
7
.
37Caforio
AL
, Pankuweit
S
, Arbustini
E
, Basso
C
, Gimeno-Blanes
J
, Felix
SB
et al.
Current state of knowledge on aetiology, diagnosis, management, and therapy of myocarditis: a position statement of the European Society of Cardiology Working Group on Myocardial and Pericardial Diseases
.
Eur Heart J
2013
;
34
:
2636
–
48
.
38Aretz
H
, Billingham
ME
, Edwards
W
, Factor
S
, Fallon
J
Jr, Fenoglio
JJ
et al.
Myocarditis. A histopathologic definition and classification
.
Am J Cardiovasc Pathol
1987
;
1
:
3
–
14
.
39Stoffers
RH
, Madden
M
, Shahid
M
, Contijoch
F
, Solomon
J
, Pilla
JJ
et al.
Assessment of myocardial injury after reperfused infarction by T1rho cardiovascular magnetic resonance
.
J Cardiovasc Magn Reson
2017
;
19
:
17.
40Wagner
A
, Mahrholdt
H
, Holly
TA
, Elliott
MD
, Regenfus
M
, Parker
M
et al.
Contrast-enhanced MRI and routine single photon emission computed tomography (SPECT) perfusion imaging for detection of subendocardial myocardial infarcts: an imaging study
.
Lancet
2003
;
361
:
374
–
9
.
41Yan
AT
, Shayne
AJ
, Brown
KA
, Gupta
SN
, Chan
CW
, Luu
TM
et al.
Characterization of the peri-infarct zone by contrast-enhanced cardiac magnetic resonance imaging is a powerful predictor of post-myocardial infarction mortality
.
Circulation
2006
;
114
:
32
–
9
.
42Schmidt
A
, Azevedo
CF
, Cheng
A
, Gupta
SN
, Bluemke
DA
, Foo
TK
et al.
Infarct tissue heterogeneity by magnetic resonance imaging identifies enhanced cardiac arrhythmia susceptibility in patients with left ventricular dysfunction
.
Circulation
2007
;
115
:
2006
–
14
.
43Wijnmaalen
AP
, van der Geest
RJ
, van Huls van Taxis
CF
, Siebelink
HM
, Kroft
LJ
, Bax
JJ
et al.
Head-to-head comparison of contrast-enhanced magnetic resonance imaging and electroanatomical voltage mapping to assess post-infarct scar characteristics in patients with ventricular tachycardias: real-time image integration and reversed registration
.
Eur Heart J
2011
;
32
:
104
–
14
.
44Schelbert
EB
, Messroghli
DR.
State of the art: clinical applications of cardiac T1 mapping
.
Radiology
2016
;
278
:
658
–
76
.
45Mekkaoui
C
, Reese
TG
, Jackowski
MP
, Bhat
H
, Sosnovik
DE.
Diffusion MRI in the heart
.
NMR Biomed
2017
;
30
:
e3426.
46Rodriguez-Granillo
GA.
Delayed enhancement cardiac computed tomography for the assessment of myocardial infarction: from bench to bedside
.
Cardiovasc Diagn Ther
2017
;
7
:
159
–
70
.
47Tian
J
, Smith
MF
, Ahmad
G
, Dilsizian
V
, Jimenez
A
, Dickfeld
T.
Integration of 3-dimensional scar models from SPECT to guide ventricular tachycardia ablation
.
J Nucl Med
2012
;
53
:
894
–
901
.
48Bunch
TJ
, Weiss
JP
, Crandall
BG
, Day
JD
, DiMarco
JP
, Ferguson
JD
et al.
Image integration using intracardiac ultrasound and 3D reconstruction for scar mapping and ablation of ventricular tachycardia
.
J Cardiovasc Electrophysiol
2010
;
21
:
678
–
84
.
49Hussein
A
, Jimenez
A
, Ahmad
G
, Mesubi
O
, Klein
T
, Gurm
G
et al.
Assessment of ventricular tachycardia scar substrate by intracardiac echocardiography
.
Pacing Clin Electrophysiol
2014
;
37
:
412
–
21
.
50Fieno
DS
, Kim
RJ
, Chen
EL
, Lomasney
JW
, Klocke
FJ
, Judd
RM.
Contrast-enhanced magnetic resonance imaging of myocardium at risk: distinction between reversible and irreversible injury throughout infarct healing
.
J Am Coll Cardiol
2000
;
36
:
1985
–
91
.
51Kim
RJ
, Fieno
DS
, Parrish
TB
, Harris
K
, Chen
EL
, Simonetti
O
et al.
Relationship of MRI delayed contrast enhancement to irreversible injury, infarct age, and contractile function
.
Circulation
1999
;
100
:
1992
–
2002
.
52Pop
M
, Ramanan
V
, Yang
F
, Zhang
L
, Newbigging
S
, Ghugre
NR
et al.
High-resolution 3-D T1*-mapping and quantitative image analysis of GRAY ZONE in chronic fibrosis
.
IEEE Trans Biomed Eng
2014
;
61
:
2930
–
8
.
53Lardo
AC
, Cordeiro
MA
, Silva
C
, Amado
LC
, George
RT
, Saliaris
AP
et al.
Contrast-enhanced multidetector computed tomography viability imaging after myocardial infarction: characterization of myocyte death, microvascular obstruction, and chronic scar
.
Circulation
2006
;
113
:
394
–
404
.
54Schuleri
KH
, Centola
M
, George
RT
, Amado
LC
, Evers
KS
, Kitagawa
K
et al.
Characterization of peri-infarct zone heterogeneity by contrast-enhanced multidetector computed tomography: a comparison with magnetic resonance imaging
.
J Am Coll Cardiol
2009
;
53
:
1699
–
707
.
55Truong
QA
, Thai
WE
, Wai
B
, Cordaro
K
, Cheng
T
, Beaudoin
J
et al.
Myocardial scar imaging by standard single-energy and dual-energy late enhancement CT: comparison with pathology and electroanatomic map in an experimental chronic infarct porcine model
.
J Cardiovasc Comput Tomogr
2015
;
9
:
313
–
20
.
56Berry
JJ
, Hoffman
JM
, Steenbergen
C
, Baker
JA
, Floyd
C
, Van Trigt
P
et al.
Human pathologic correlation with PET in ischemic and nonischemic cardiomyopathy
.
J Nucl Med
1993
;
34
:
39
–
47
.
57Maes
A
, Flameng
W
, Nuyts
J
, Borgers
M
, Shivalkar
B
, Ausma
J
et al.
Histological alterations in chronically hypoperfused myocardium. Correlation with PET findings
.
Circulation
1994
;
90
:
735
–
45
.
58Medrano
R
, Lowry
RW
, Young
JB
, Weilbaecher
DG
, Michael
LH
, Afridi
I
et al.
Assessment of myocardial viability with 99mTc sestamibi in patients undergoing cardiac transplantation. A scintigraphic/pathological study
.
Circulation
1996
;
94
:
1010
–
7
.
59Callans
DJ
, Ren
JF
, Michele
J
, Marchlinski
FE
, Dillon
SM.
Electroanatomic left ventricular mapping in the porcine model of healed anterior myocardial infarction. Correlation with intracardiac echocardiography and pathological analysis
.
Circulation
1999
;
100
:
1744
–
50
.
60Reddy
VY
, Wrobleski
D
, Houghtaling
C
, Josephson
ME
, Ruskin
JN.
Combined epicardial and endocardial electroanatomic mapping in a porcine model of healed myocardial infarction
.
Circulation
2003
;
107
:
3236
–
42
.
61Wrobleski
D
, Houghtaling
C
, Josephson
ME
, Ruskin
JN
, Reddy
VY.
Use of electrogram characteristics during sinus rhythm to delineate the endocardial scar in a porcine model of healed myocardial infarction
.
J Cardiovasc Electrophysiol
2003
;
14
:
524
–
9
.
62Wolf
T
, Gepstein
L
, Dror
U
, Hayam
G
, Shofti
R
, Zaretzky
A
et al.
Detailed endocardial mapping accurately predicts the transmural extent of myocardial infarction
.
J Am Coll Cardiol
2001
;
37
:
1590
–
7
.
63Koa-Wing
M
, Ho
SY
, Kojodjojo
P
, Peters
NS
, Davies
DW
, Kanagaratnam
P.
Radiofrequency ablation of infarct scar-related ventricular tachycardia: correlation of electroanatomical data with post-mortem histology
.
J Cardiovasc Electrophysiol
2007
;
18
:
1330
–
3
.
64Deneke
T
, Muller
KM
, Lemke
B
, Lawo
T
, Calcum
B
, Helwing
M
et al.
Human histopathology of electroanatomic mapping after cooled-tip radiofrequency ablation to treat ventricular tachycardia in remote myocardial infarction
.
J Cardiovasc Electrophysiol
2005
;
16
:
1246
–
51
.
65Tschabrunn
CM
, Roujol
S
, Dorman
NC
, Nezafat
R
, Josephson
ME
, Anter
E.
High-resolution mapping of ventricular scar: comparison between single and multielectrode catheters
.
Circ Arrhythm Electrophysiol
2016
;
9
:
e003841.
66Shokrollahi
E
, Pop
M
, Safri
M
, Yang
Y
, Radau
PE
, Barry
J
et al.
In-vivo MRI and in-vivo electro-anatomical voltage map characteristics of infarct heterogeneity in a swine model
.
Conf Proc IEEE Eng Med Biol Soc
2011
;
2011
:
2792
–
5
.
67Pop
M
, Sermesant
M
, Mansi
T
, Crystal
E
, Ghate
S
, Peyrat
JM
et al.
Correspondence between simple 3-D MRI-based computer models and in-vivo EP measurements in swine with chronic infarctions
.
IEEE Trans Biomed Eng
2011
;
58
:
3483
–
6
.
68Cochet
H
, Komatsu
Y
, Sacher
F
, Jadidi
AS
, Scherr
D
, Riffaud
M.
Integration of merged delayed-enhanced magnetic resonance imaging and multidetector computed tomography for the guidance of ventricular tachycardia ablation: a pilot study
.
J Cardiovasc Electrophysiol
2013
;
24
:
419
–
26
.
69Yamashita
S
, Sacher
F
, Mahida
S
, Berte
B
, Lim
HS
, Komatsu
Y
et al.
Image integration to guide catheter ablation in scar-related ventricular tachycardia
.
J Cardiovasc Electrophysiol
2016
;
27
:
699
–
708
.
70Andreu
D
, Berruezo
A
, Ortiz-Perez
JT
, Silva
E
, Mont
L
, Borras
R
et al.
Integration of 3D electroanatomic maps and magnetic resonance scar characterization into the navigation system to guide ventricular tachycardia ablation
.
Circ Arrhythm Electrophysiol
2011
;
4
:
674
–
83
.
71Esposito
A
, Palmisano
A
, Antunes
S
, Maccabelli
G
, Colantoni
C
, Rancoita
PMV
et al.
Cardiac CT with delayed enhancement in the characterization of ventricular tachycardia structural substrate: relationship between CT-segmented scar and electro-anatomic mapping
.
JACC Cardiovasc Imaging
2016
;
9
:
822
–
32
.
72Komatsu
Y
, Cochet
H
, Jadidi
A
, Sacher
F
, Shah
A
, Derval
N
et al.
Regional myocardial wall thinning at multidetector computed tomography correlates to arrhythmogenic substrate in postinfarction ventricular tachycardia: assessment of structural and electrical substrate
.
Circ Arrhythm Electrophysiol
2013
;
6
:
342
–
50
.
73Dickfeld
T
, Lei
P
, Dilsizian
V
, Jeudy
J
, Dong
J
, Voudouris
A
et al.
Integration of three-dimensional scar maps for ventricular tachycardia ablation with positron emission tomography-computed tomography
.
JACC Cardiovasc Imaging
2008
;
1
:
73
–
82
.
74Fahmy
TS
, Wazni
OM
, Jaber
WA
, Walimbe
V
, Di Biase
L
, Elayi
CS
et al.
Integration of positron emission tomography/computed tomography with electroanatomical mapping: a novel approach for ablation of scar-related ventricular tachycardia
.
Heart Rhythm
2008
;
5
:
1538
–
45
.
75Klein
T
, Abdulghani
M
, Smith
M
, Huang
R
, Asoglu
R
, Remo
BF
et al.
Three-dimensional 123I-meta-iodobenzylguanidine cardiac innervation maps to assess substrate and successful ablation sites for ventricular tachycardia: feasibility study for a novel paradigm of innervation imaging
.
Circ Arrhythm Electrophysiol
2015
;
8
:
583
–
91
.
76Ricci
C
, Longo
R
, Pagnan
L
, Dalla Palma
L
, Pinamonti
B
, Camerini
F
et al.
Magnetic resonance imaging in right ventricular dysplasia
.
Am J Cardiol
1992
;
70
:
1589
–
95
.
77Castillo
E
, Tandri
H
, Rodriguez
ER
, Nasir
K
, Rutberg
J
, Calkins
H
et al.
Arrhythmogenic right ventricular dysplasia: ex vivo and in vivo fat detection with black-blood MR imaging
.
Radiology
2004
;
232
:
38
–
48
.
78Puranik
R
, Gray
B
, Lackey
H
, Yeates
L
, Parker
G
, Duflou
J
et al.
Comparison of conventional autopsy and magnetic resonance imaging in determining the cause of sudden death in the young
.
J Cardiovasc Magn Reson
2014
;
16
:
44.
79Avella
A
, d’Amati
G
, Zachara
E
, Musumeci
F
, Tondo
C.
Comparison between electroanatomic and pathologic findings in a patient with arrhythmogenic right ventricular cardiomyopathy/dysplasia treated with orthotopic cardiac transplant
.
Heart Rhythm
2010
;
7
:
828
–
31
.
80Santangeli
P
, Hamilton-Craig
C
, Dello Russo
A
, Pieroni
M
, Casella
M
, Pelargonio
G
et al.
Imaging of scar in patients with ventricular arrhythmias of right ventricular origin: cardiac magnetic resonance versus electroanatomic mapping
.
J Cardiovasc Electrophysiol
2011
;
22
:
1359
–
66
.
81Corrado
D
, Basso
C
, Leoni
L
, Tokajuk
B
, Bauce
B
, Frigo
G
et al.
Three-dimensional electroanatomic voltage mapping increases accuracy of diagnosing arrhythmogenic right ventricular cardiomyopathy/dysplasia
.
Circulation
2005
;
111
:
3042
–
50
.
82Corrado
D
, Basso
C
, Leoni
L
, Tokajuk
B
, Turrini
P
, Bauce
B
et al.
Three-dimensional electroanatomical voltage mapping and histologic evaluation of myocardial substrate in right ventricular outflow tract tachycardia
.
J Am Coll Cardiol
2008
;
51
:
731
–
9
.
83Casella
M
, Pizzamiglio
F
, Dello Russo
A
, Carbucicchio
C
, Al-Mohani
G
, Russo
E
et al.
Feasibility of combined unipolar and bipolar voltage maps to improve sensitivity of endomyocardial biopsy
.
Circ Arrhythm Electrophysiol
2015
;
8
:
625
–
32
.
84Roux
JF
, Dubuc
M
, Pressacco
J
, Roy
D
, Thibault
B
, Talajic
M
et al.
Concordance between an electroanatomic mapping system and cardiac MRI in arrhythmogenic right ventricular cardiomyopathy
.
Pacing Clin Electrophysiol
2006
;
29
:
109
–
12
.
85Santangeli
P
, Pieroni
M
, Dello Russo
A
, Casella
M
, Pelargonio
G
, Macchione
A
et al.
Noninvasive diagnosis of electroanatomic abnormalities in arrhythmogenic right ventricular cardiomyopathy
.
Circ Arrhythm Electrophysiol
2010
;
3
:
632
–
8
.
86Marra
MP
, Leoni
L
, Bauce
B
, Corbetti
F
, Zorzi
A
, Migliore
F
et al.
Imaging study of ventricular scar in arrhythmogenic right ventricular cardiomyopathy: comparison of 3D standard electroanatomical voltage mapping and contrast-enhanced cardiac magnetic resonance
.
Circ Arrhythm Electrophysiol
2012
;
5
:
91
–
100
.
87Berte
B
, Denis
A
, Amraoui
S
, Yamashita
S
, Komatsu
Y
, Pillois
X
et al.
Characterization of the left-sided substrate in arrhythmogenic right ventricular cardiomyopathy
.
Circ Arrhythm Electrophysiol
2015
;
8
:
1403
–
12
.
88Komatsu
Y
, Jadidi
A
, Sacher
F
, Denis
A
, Daly
M
, Derval
N
et al.
Relationship between MDCT-imaged myocardial fat and ventricular tachycardia substrate in arrhythmogenic right ventricular cardiomyopathy
.
J Am Heart Assoc
2014
;
3
:
e000935.
89Moravsky
G
, Ofek
E
, Rakowski
H
, Butany
J
, Williams
L
, Ralph-Edwards
A
et al.
Myocardial fibrosis in hypertrophic cardiomyopathy: accurate reflection of histopathological findings by CMR
.
JACC Cardiovasc Imaging
2013
;
6
:
587
–
96
.
90Moon
JC
, Reed
E
, Sheppard
MN
, Elkington
AG
, Ho
SY
, Burke
M
et al.
The histologic basis of late gadolinium enhancement cardiovascular magnetic resonance in hypertrophic cardiomyopathy
.
J Am Coll Cardiol
2004
;
43
:
2260
–
4
.
91Hong
YJ
, Kim
TK
, Hong
D
, Park
CH
, Yoo
SJ
, Wickum
ME
et al.
Myocardial characterization using dual-energy CT in doxorubicin-induced DCM: comparison with CMR T1-mapping and histology in a rabbit model
.
JACC Cardiovasc Imaging
2016
;
9
:
836
–
45
.
92Gulati
A
, Ismail
TF
, Jabbour
A
, Ismail
NA
, Morarji
K
, Ali
A
et al.
Clinical utility and prognostic value of left atrial volume assessment by cardiovascular magnetic resonance in non-ischaemic dilated cardiomyopathy
.
Eur J Heart Fail
2013
;
15
:
660
–
70
.
93Iles
LM
, Ellims
AH
, Llewellyn
H
, Hare
JL
, Kaye
DM
, McLean
CA
et al.
Histological validation of cardiac magnetic resonance analysis of regional and diffuse interstitial myocardial fibrosis
.
Eur Heart J Cardiovasc Imaging
2015
;
16
:
14
–
22
.
94Cheng
S
, Wang
H
, Lu
M
, Cui
C
, Li
L
, Yin
G
et al.
The value of CMR for determination of heart failure etiology: an unusual case with histology validation
.
Int J Cardiol
2017
;
226
:
38
–
41
.
95Schalla
S
, Bekkers
SC
, Dennert
R
, van Suylen
RJ
, Waltenberger
J
, Leiner
T
et al.
Replacement and reactive myocardial fibrosis in idiopathic dilated cardiomyopathy: comparison of magnetic resonance imaging with right ventricular biopsy
.
Eur J Heart Fail
2010
;
12
:
227
–
31
.
96Nakamori
S
, Dohi
K
, Ishida
M
, Goto
Y
, Imanaka-Yoshida
K
, Omori
T
et al.
Native T1 mapping and extracellular volume mapping for the assessment of diffuse myocardial fibrosis in dilated cardiomyopathy
.
J Am Coll Cardiol Img
2018
;
11
:
48
–
59
.
97Aus Dem Siepen
F
, Buss
SJ
, Messroghli
D
, Andre
F
, Lossnitzer
D
, Seitz
S
et al.
T1 mapping in dilated cardiomyopathy with cardiac magnetic resonance: quantification of diffuse myocardial fibrosis and comparison with endomyocardial biopsy
.
Eur Heart J Cardiovasc Imaging
2015
;
16
:
210
–
6
.
98Abdullah
OM
, Drakos
SG
, Diakos
NA
, Wever-Pinzon
O
, Kfoury
AG
, Stehlik
J
et al.
Characterization of diffuse fibrosis in the failing human heart via diffusion tensor imaging and quantitative histological validation
.
NMR Biomed
2014
;
27
:
1378
–
86
.
99Psaltis
PJ
, Carbone
A
, Leong
DP
, Lau
DH
, Nelson
AJ
, Kuchel
T
et al.
Assessment of myocardial fibrosis by endoventricular electromechanical mapping in experimental nonischemic cardiomyopathy
.
Int J Cardiovasc Imaging
2011
;
27
:
25
–
37
.
100Desjardins
B
, Yokokawa
M
, Good
E
, Crawford
T
, Latchamsetty
R
, Jongnarangsin
K
et al.
Characteristics of intramural scar in patients with nonischemic cardiomyopathy and relation to intramural ventricular arrhythmias
.
Circ Arrhythm Electrophysiol
2013
;
6
:
891
–
7
.
101Sasaki
T
, Miller
CF
, Hansford
R
, Zipunnikov
V
, Zviman
MM
, Marine
JE
et al.
Impact of nonischemic scar features on local ventricular electrograms and scar-related ventricular tachycardia circuits in patients with nonischemic cardiomyopathy
.
Circ Arrhythm Electrophysiol
2013
;
6
:
1139
–
47
.
102Piers
SR
, van Huls van Taxis
CF
, Tao
Q
, van der Geest
RJ
, Askar
SF
, Siebelink
HM
et al.
Epicardial substrate mapping for ventricular tachycardia ablation in patients with non-ischaemic cardiomyopathy: a new algorithm to differentiate between scar and viable myocardium developed by simultaneous integration of computed tomography and contrast-enhanced magnetic resonance imaging
.
Eur Heart J
2013
;
34
:
586
–
96
.
103Piers
SR
, Tao
Q
, van Huls van Taxis
CF
, Schalij
MJ
, van der Geest
RJ
, Zeppenfeld
K.
Contrast-enhanced MRI-derived scar patterns and associated ventricular tachycardias in nonischemic cardiomyopathy: implications for the ablation strategy
.
Circ Arrhythm Electrophysiol
2013
;
6
:
875
–
83
.
104Yamashita
S
, Sacher
F
, Hooks
DA
, Berte
B
, Sellal
JM
, Frontera
A
et al.
Myocardial wall thinning predicts transmural substrate in patients with scar-related ventricular tachycardia
.
Heart Rhythm
2017
;
14
:
155
–
63
.
105Bala
R
, Ren
JF
, Hutchinson
MD
, Desjardins
B
, Tschabrunn
C
, Gerstenfeld
EP
et al.
Assessing epicardial substrate using intracardiac echocardiography during VT ablation
.
Circ Arrhythm Electrophysiol
2011
;
4
:
667
–
73
.
106Siddiqi
FK
, Paz
YE
, Olesnicky
L
, Bokhari
S
, Cheung
JW.
Correlation of inflammation due to cardiac sarcoidosis by positron emission tomography-computed tomography imaging and endocardial voltage mapping in a patient with recurrent ventricular tachycardia
.
Europace
2014
;
16
:
907.
107Baumann
S
, De Cecco
CN
, Schoepf
UJ
, Wince
WB
, Suranyi
P
, Spruill
LS
et al.
Correlation of cardiac magnetic resonance imaging and histopathology in eosinophilic endomyocarditis
.
Circ Cardiovasc Imaging
2014
;
8
:
e002501
.
108Sujino
Y
, Kimura
F
, Tanno
J
, Nakano
S
, Yamaguchi
E
, Shimizu
M
et al.
Cardiac magnetic resonance imaging in giant cell myocarditis: intriguing associations with clinical and pathological features
.
Circulation
2014
;
129
:
e467
–
9
.
109Babu-Narayan
SV
, McCarthy
KP
, Ho
SY
, Magee
AG
, Kilner
PJ
, Sheppard
MN.
Images in cardiovascular medicine. Myocarditis and sudden cardiac death in the young: extensive fibrosis suggested by cardiovascular magnetic resonance in vivo and confirmed post mortem
.
Circulation
2007
;
116
:
e122
–
5
.
110Berte
B
, Sacher
F
, Cochet
H
, Mahida
S
, Yamashita
S
, Lim
H
et al.
Postmyocarditis ventricular tachycardia in patients with epicardial-only scar: a specific entity requiring a specific approach
.
J Cardiovasc Electrophysiol
2015
;
26
:
42
–
50
.
111Maccabelli
G
, Tsiachris
D
, Silberbauer
J
, Esposito
A
, Bisceglia
C
, Baratto
F
et al.
Imaging and epicardial substrate ablation of ventricular tachycardia in patients late after myocarditis
.
Europace
2014
;
16
:
1363
–
72
.
112Nishi
T
, Takaoka
H
, Funabashi
N
, Nishimura
M
, Ohara
O
, Makiyama
T
et al.
Familial lamin A/C mutation cardiomyopathy with arrhythmia substrate detected by cardiac magnetic resonance imaging and electroanatomical mapping
.
Int J Cardiol
2016
;
209
:
248
–
52
.
113Greco
A
, Petretta
MP
, Larobina
M
, Gargiulo
S
, Panico
M
, Nekolla
SG
et al.
Reproducibility and accuracy of non-invasive measurement of infarct size in mice with high-resolution PET/CT
.
J Nucl Cardiol
2012
;
19
:
492
–
9
.
114Masse
S
, Magtibay
K
, Jackson
N
, Asta
J
, Kusha
M
, Zhang
B
et al.
Resolving myocardial activation with novel omnipolar electrograms
.
Circ Arrhythm Electrophysiol
2016
;
9
:
e004107.
115Hutchinson
MD
, Gerstenfeld
EP
, Desjardins
B
, Bala
R
, Riley
MP
, Garcia
FC
et al.
Endocardial unipolar voltage mapping to detect epicardial ventricular tachycardia substrate in patients with nonischemic left ventricular cardiomyopathy
.
Circ Arrhythm Electrophysiol
2011
;
4
:
49
–
55
.
116Tschabrunn
CM
, Roujol
S
, Nezafat
R
, Faulkner-Jones
B
, Buxton
AE
, Josephson
ME
et al.
A swine model of infarct-related reentrant ventricular tachycardia: electroanatomic, magnetic resonance, and histopathological characterization
.
Heart Rhythm
2016
;
13
:
262
–
73
.
117de Bakker
JM
, van Capelle
FJ
, Janse
MJ
, Tasseron
S
, Vermeulen
JT
, de Jonge
N
et al.
Fractionated electrograms in dilated cardiomyopathy: origin and relation to abnormal conduction
.
J Am Coll Cardiol
1996
;
27
:
1071
–
8
.
118Kawara
T
, Derksen
R
, de Groot
JR
, Coronel
R
, Tasseron
S
, Linnenbank
AC
et al.
Activation delay after premature stimulation in chronically diseased human myocardium relates to the architecture of interstitial fibrosis
.
Circulation
2001
;
104
:
3069
–
75
.
119Jais
P
, Maury
P
, Khairy
P
, Sacher
F
, Nault
I
, Komatsu
Y
et al.
Elimination of local abnormal ventricular activities: a new end point for substrate modification in patients with scar-related ventricular tachycardia
.
Circulation
2012
;
125
:
2184
–
96
.
120Anter
E
, McElderry
TH
, Contreras-Valdes
FM
, Li
J
, Tung
P
, Leshem
E
et al.
Evaluation of a novel high-resolution mapping technology for ablation of recurrent scar-related atrial tachycardias
.
Heart Rhythm
2016
;
13
:
2048
–
55
.
121Yamashita
S
, Cochet
H
, Sacher
F
, Mahida
S
, Berte
B
, Hooks
D
et al.
Impact of new technologies and approaches for post-myocardial infarction ventricular tachycardia ablation during long-term follow-up
.
Circ Arrhythm Electrophysiol
2016
;
9
:
e003901.
122Fernandez-Armenta
J
, Berruezo
A
, Andreu
D
, Camara
O
, Silva
E
, Serra
L
et al.
Three-dimensional architecture of scar and conducting channels based on high resolution ce-CMR: insights for ventricular tachycardia ablation
.
Circ Arrhythm Electrophysiol
2013
;
6
:
528
–
37
.
123Andreu
D
, Ortiz-Perez
JT
, Fernandez-Armenta
J
, Guiu
E
, Acosta
J
, Prat
GS
et al.
3D delayed-enhanced magnetic resonance sequences improve conducting channel delineation prior to ventricular tachycardia ablation
.
Europace
2015
;
17
:
938
–
45
.
124Piers
SR
, Tao
Q
, de Riva Silva
M
, Siebelink
HM
, Schalij
MJ
, van der Geest
RJ
et al.
CMR-based identification of critical isthmus sites of ischemic and nonischemic ventricular tachycardia
.
JACC Cardiovasc Imaging
2014
;
7
:
774
–
84
.
125Ashikaga
H
, Sasano
T
, Dong
J
, Zviman
MM
, Evers
R
, Hopenfeld
B
et al.
Magnetic resonance-based anatomical analysis of scar-related ventricular tachycardia: implications for catheter ablation
.
Circ Res
2007
;
101
:
939
–
47
.
126Tian
J
, Smith
MF
, Jeudy
J
, Dickfeld
T.
Multimodality fusion imaging using delayed-enhanced cardiac magnetic resonance imaging, computed tomography, positron emission tomography, and real-time intracardiac echocardiography to guide ventricular tachycardia ablation in implantable cardioverter-defibrillator patients
.
Heart Rhythm
2009
;
6
:
825
–
8
.
127Gupta
S
, Desjardins
B
, Baman
T
, Ilg
K
, Good
E
, Crawford
T
et al.
Delayed-enhanced MR scar imaging and intraprocedural registration into an electroanatomical mapping system in post-infarction patients
.
JACC Cardiovasc Imaging
2012
;
5
:
207
–
10
.
128Desjardins
B
, Crawford
T
, Good
E
, Oral
H
, Chugh
A
, Pelosi
F
et al.
Infarct architecture and characteristics on delayed enhanced magnetic resonance imaging and electroanatomic mapping in patients with postinfarction ventricular arrhythmia
.
Heart Rhythm
2009
;
6
:
644
–
51
.
129Estner
HL
, Zviman
MM
, Herzka
D
, Miller
F
, Castro
V
, Nazarian
S
et al.
The critical isthmus sites of ischemic ventricular tachycardia are in zones of tissue heterogeneity, visualized by magnetic resonance imaging
.
Heart Rhythm
2011
;
8
:
1942
–
9
.
130Njeim
M
, Yokokawa
M
, Frank
L
, Crawford
T
, Good
E
, Morady
F
et al.
Value of cardiac magnetic resonance imaging in patients with failed ablation procedures for ventricular tachycardia
.
J Cardiovasc Electrophysiol
2016
;
27
:
183
–
9
.
131Bogun
FM
, Desjardins
B
, Good
E
, Gupta
S
, Crawford
T
, Oral
H
et al.
Delayed-enhanced magnetic resonance imaging in nonischemic cardiomyopathy: utility for identifying the ventricular arrhythmia substrate
.
J Am Coll Cardiol
2009
;
53
:
1138
–
45
.
132Perez-David
E
, Arenal
A
, Rubio-Guivernau
JL
, del Castillo
R
, Atea
L
, Arbelo
E
et al.
Noninvasive identification of ventricular tachycardia-related conducting channels using contrast-enhanced magnetic resonance imaging in patients with chronic myocardial infarction: comparison of signal intensity scar mapping and endocardial voltage mapping
.
J Am Coll Cardiol
2011
;
57
:
184
–
94
.
133Andreu
D
, Penela
D
, Acosta
J
, Fernandez-Armenta
J
, Perea
RJ
, Soto-Iglesias
D
et al.
Cardiac magnetic resonance-aided scar dechanneling: influence on acute and long-term outcomes
.
Heart Rhythm
2017
;
14
:
1121
–
8
.
134Hussein
AA
, Niekoop
M
, Dilsizian
V
, Ghzally
Y
, Abdulghani
M
, Asoglu
R
et al.
Hibernating substrate of ventricular tachycardia: a three-dimensional metabolic and electro-anatomic assessment
.
J Interv Card Electrophysiol
2017
;
48
:
247
–
54
.
135Acosta
J
, Fernandez-Armenta
J
, Penela
D
, Andreu
D
, Borras
R
, Vassanelli
F
et al.
Infarct transmurality as a criterion for first-line endo-epicardial substrate-guided ventricular tachycardia ablation in ischemic cardiomyopathy
.
Heart Rhythm
2016
;
13
:
85
–
95
.
136Siontis
KC
, Kim
HM
, Sharaf Dabbagh
G
, Latchamsetty
R
, Stojanovska
J
, Jongnarangsin
K
et al.
Association of preprocedural cardiac magnetic resonance imaging with outcomes of ventricular tachycardia ablation in patients with idiopathic dilated cardiomyopathy
.
Heart Rhythm
2017
;
14
:
1487
–
93
.
137Zghaib
T
, Ipek
EG
, Hansford
R
, Ashikaga
H
, Berger
RD
, Marine
JE
et al.
Standard ablation versus magnetic resonance imaging-guided ablation in the treatment of ventricular tachycardia
.
Circ Arrhythm Electrophysiol
2018
;
11
:
e006413.
138Anter
E.
Cardiac magnetic resonance imaging to guide ventricular tachycardia ablation: are we there?
Heart Rhythm
2017
;
14
:
1494
–
5
.
139Leshem
E
, Tschabrunn
CM
, Jang
J
, Whitaker
J
, Zilberman
I
, Beeckler
C
et al.
High-resolution mapping of ventricular scar. Evaluation of a novel integrated multielectrode mapping and ablation catheter
.
J Am Coll Cardiol EP
2017
;
3
:
220
–
31
.
140Weinsaft
JW
, Kim
RJ
, Ross
M
, Krauser
D
, Manoushagian
S
, LaBounty
TM
et al.
Contrast-enhanced anatomic imaging as compared to contrast-enhanced tissue characterization for detection of left ventricular thrombus
.
JACC Cardiovasc Imaging
2009
;
2
:
969
–
79
.
141Rajwani
A
, Stewart
MJ
, Richardson
JD
, Child
NM
, Maredia
N.
The incremental impact of cardiac MRI on clinical decision-making
.
Br J Radiol
2016
;
89
:
20150662.
142White
JA
, Fine
NM
, Gula
L
, Yee
R
, Skanes
A
, Klein
G
et al.
Utility of cardiovascular magnetic resonance in identifying substrate for malignant ventricular arrhythmias
.
Circ Cardiovasc Imaging
2012
;
5
:
12
–
20
.
143Hennig
A
, Salel
M
, Sacher
F
, Camaioni
C
, Sridi
S
, Denis
A
et al.
High-resolution three-dimensional late gadolinium-enhanced cardiac magnetic resonance imaging to identify the underlying substrate of ventricular arrhythmia
Europace
2018
;
20
:
f179
--
f191
.
144Reithmann
C
, Herkommer
B
, Fiek
M.
Epicardial ventricular tachycardia substrate visualized by magnetic resonance imaging: need for a transpericardial ablation approach?
Clin Res Cardiol
2016
;
105
:
827
–
37
.
145Andreu
D
, Ortiz-Perez
JT
, Boussy
T
, Fernandez-Armenta
J
, de Caralt
TM
, Perea
RJ
et al.
Usefulness of contrast-enhanced cardiac magnetic resonance in identifying the ventricular arrhythmia substrate and the approach needed for ablation
.
Eur Heart J
2014
;
35
:
1316
–
26
.
146Sacher
F
, Roberts-Thomson
K
, Maury
P
, Tedrow
U
, Nault
I
, Steven
D
et al.
Epicardial ventricular tachycardia ablation a multicenter safety study
.
J Am Coll Cardiol
2010
;
55
:
2366
–
72
.
147Della Bella
P
, Brugada
J
, Zeppenfeld
K
, Merino
J
, Neuzil
P
, Maury
P
et al.
Epicardial ablation for ventricular tachycardia: a European multicenter study
.
Circ Arrhythm Electrophysiol
2011
;
4
:
653
–
9
.
148Tilz
RR
, Makimoto
H
, Lin
T
, Rillig
A
, Metzner
A
, Mathew
S
et al.
In vivo left-ventricular contact force analysis: comparison of antegrade transseptal with retrograde transaortic mapping strategies and correlation of impedance and electrical amplitude with contact force
.
Europace
2014
;
16
:
1387
–
95
.
149Kumar
S
, Tedrow
UB
, Stevenson
WG.
Adjunctive interventional techniques when percutaneous catheter ablation for drug refractory ventricular arrhythmias fail: a contemporary review
.
Circ Arrhythm Electrophysiol
2017
;
10
:
e003676.
150Tholakanahalli
VN
, Bertog
S
, Roukoz
H
, Shivkumar
K.
Catheter ablation of ventricular tachycardia using intracoronary wire mapping and coil embolization: description of a new technique
.
Heart Rhythm
2013
;
10
:
292
–
6
.
151Venlet
J
, Piers
SR
, Jongbloed
JD
, Androulakis
AF
, Naruse
Y
, den Uijl
DW
et al.
Isolated subepicardial right ventricular outflow tract scar in athletes with ventricular tachycardia
.
J Am Coll Cardiol
2017
;
69
:
497
–
507
.
152Desjardins
B
, Morady
F
, Bogun
F.
Effect of epicardial fat on electroanatomical mapping and epicardial catheter ablation
.
J Am Coll Cardiol
2010
;
56
:
1320
–
7
.
153van Huls van Taxis
CF
, Wijnmaalen
AP
, Piers
SR
, van der Geest
RJ
, Schalij
MJ
, Zeppenfeld
K.
Real-time integration of MDCT-derived coronary anatomy and epicardial fat: impact on epicardial electroanatomic mapping and ablation for ventricular arrhythmias
.
JACC Cardiovasc Imaging
2013
;
6
:
42
–
52
.
154Matsumoto
Y
, Krishnan
S
, Fowler
SJ
, Saremi
F
, Kondo
T
, Ahsan
C
et al.
Detection of phrenic nerves and their relation to cardiac anatomy using 64-slice multidetector computed tomography
.
Am J Cardiol
2007
;
100
:
133
–
7
.
155Yamashita
S
, Sacher
F
, Mahida
S
, Berte
B
, Lim
HS
, Komatsu
Y
et al.
Role of high-resolution image integration to visualize left phrenic nerve and coronary arteries during epicardial ventricular tachycardia ablation
.
Circ Arrhythm Electrophysiol
2015
;
8
:
371
–
80
.
156Peichl
P
, Baran
J
, Wichterle
D
, Cihak
R
, Skala
T
, Aldhoon
B
et al.
The tip of the muscle is a dominant location of ventricular ectopy originating from papillary muscles in the left ventricle
.
J Cardiovasc Electrophysiol
2018
;
29
:
64
–
70
.
157Ren
JF
, Marchlinski
FE.
Utility of intracardiac echocardiography in left heart ablation for tachyarrhythmias
.
Echocardiography
2007
;
24
:
533
–
40
.
158Piers
SR
, Zeppenfeld
K.
Imaging-guided ventricular tachycardia ablation
.
Arrhythm Electrophysiol Rev
2013
;
2
:
128
–
34
.
159Tao
Q
, Piers
SR
, Lamb
HJ
, Zeppenfeld
K
, van der Geest
RJ.
Preprocedural magnetic resonance imaging for image-guided catheter ablation of scar-related ventricular tachycardia
.
Int J Cardiovasc Imaging
2015
;
31
:
369
–
77
.
160Russo
RJ
, Costa
HS
, Silva
PD
, Anderson
JL
, Arshad
A
, Biederman
RW
et al.
Assessing the risks associated with MRI in patients with a pacemaker or defibrillator
.
N Engl J Med
2017
;
376
:
755
–
64
.
161Dickfeld
T
, Tian
J
, Ahmad
G
, Jimenez
A
, Turgeman
A
, Kuk
R
et al.
MRI-Guided ventricular tachycardia ablation: integration of late gadolinium-enhanced 3D scar in patients with implantable cardioverter-defibrillators
.
Circ Arrhythm Electrophysiol
2011
;
4
:
172
–
84
.
162Ranjan
R
, McGann
CJ
, Jeong
EK
, Hong
K
, Kholmovski
EG
, Blauer
J
et al.
Wideband late gadolinium enhanced magnetic resonance imaging for imaging myocardial scar without image artefacts induced by implantable cardioverter-defibrillator: a feasibility study at 3 T
.
Europace
2015
;
17
:
483
–
8
.
163Sommer
P
, Grothoff
M
, Eitel
C
, Gaspar
T
, Piorkowski
C
, Gutberlet
M
et al.
Feasibility of real-time magnetic resonance imaging-guided electrophysiology studies in humans
.
Europace
2013
;
15
:
101
–
8
.
164Mukherjee
RK
, Whitaker
J
, Williams
SE
, Razavi
R
, O'Neill
MD
.
Magnetic resonance imaging guidance for the optimization of ventricular tachycardia ablation
.
Europace
2018
;
20
:
1721
--
32
.
165Mukherjee
RK
, Roujol
S
, Chubb
H
, Harrison
J
, Williams
S
, Whitaker
J
et al.
Epicardial electroanatomical mapping, radiofrequency ablation, and lesion imaging in the porcine left ventricle under real-time magnetic resonance imaging guidance-an in vivo feasibility study
.
Europace
2018
;
20
:
f254
--
f262
.
166Mahida
S
, Sacher
F
, Dubois
R
, Sermesant
M
, Bogun
F
, Haissaguerre
M
et al.
Cardiac imaging in patients with ventricular tachycardia
.
Circulation
2017
;
136
:
2491
–
507
.
167Dubois
R
, Shah
AJ
, Hocini
M
, Denis
A
, Derval
N
, Cochet
H
et al.
Non-invasive cardiac mapping in clinical practice: application to the ablation of cardiac arrhythmias
.
J Electrocardiol
2015
;
48
:
966
–
74
.
Author notes
Published on behalf of the European Society of Cardiology. All rights reserved. © The Author(s) 2018. For permissions, please email:
[email protected].


