


Abstract
Electrical storm (ES) is a serious arrhythmic syndrome that is characterized by recurrent episodes of ventricular arrhythmias. Electrical storm is associated with increased mortality and morbidity despite the use of implantable cardioverter-defibrillators (ICDs). Predicting ES could be essential; however, models for predicting this event have never been developed. The goal of this study was to construct and validate machine learning models to predict ES based on daily ICD remote monitoring summaries.
Daily ICD summaries from 19 935 patients were used to construct and evaluate two models [logistic regression (LR) and random forest (RF)] for predicting the short-term risk of ES. The models were evaluated on the parts of the data not used for model development. Random forest performed significantly better than LR (P < 0.01), achieving a test accuracy of 0.96 and an area under the curve (AUC) of 0.80 (vs. an accuracy of 0.96 and an AUC of 0.75). The percentage of ventricular pacing and the daytime activity were the most relevant variables in the RF model.
The use of large-scale machine learning showed that daily summaries of ICD measurements in the absence of clinical information can predict the short-term risk of ES.
Electrical storm (ES) is a serious arrhythmic syndrome. This study applied machine learning on daily implantable cardioverter-defibrillator (ICD) summaries from 19 935 patients in the US and showed that, without additional clinical information, this model could predict the short-term risk of ES with an area under the receiver operating characteristic curve of 0.80 and a sensitivity of 61% at 90% specificity on unseen data.
The percentage of ventricular pacing and the daytime activity were important predictive variables.
Remote monitoring ICD data can predict ES, potentially provide value for patient care and allow the initiation of interventions that prevent ES if used in combination with additional patient information.
Introduction
Implantable cardioverter-defibrillators (ICDs) are used for the primary and secondary prevention of sudden death in patients with various types of heart disease.1,2 The number of delivered therapies is low in most patients; however, approximately 10–25% of patients will experience episodes of electrical storm (ES), which is defined as three or more distinct episodes of ventricular tachycardia (VT) or ventricular fibrillation (VF) within 24 h.3–7 The occurrence of frequent episodes of ES has been linked to psychological trauma, a reduced quality of life and increased mortality. Thus identifying patients at high risk of ES is essential.6–9
Several factors including progressive heart failure, severe reduction of left ventricular function, advanced age, previous VT or VF episodes, and the use of Class I antiarrhythmic drugs are associated with an increased risk of developing ES; however, to the authors knowledge, no predictive models have been developed and the prediction of ES remains challenging.7,9–12
All ICDs provide daily summaries (e.g. diagnostic information, ICD therapies and predefined arrhythmias) that are sent at scheduled intervals and after arrhythmic events. This study investigated whether it was possible to predict ES based on daily stored ICD summaries using modern machine learning techniques on a large dataset. These predictions could potentially initiate an alert on the remote monitoring system and prompt the clinician to take action to prevent ES.
Methods
Definition of electrical storm
This study adopted a common definition of ES which defined it as three or more distinct episodes of ventricular arrhythmias (including VT and VF) treated by device electrical therapy [appropriate antitachycardia pacing (ATP) or shock delivery] within a 24 h period.3,8 All episodes (VT or VF) were defined by the device. To be categorized as a distinct new episode, the preceding episode must be classified as terminated (e.g. a ventricular rate below the detection zone).
Study population and study variables
The dataset consisted of daily remote monitoring data from Medtronic ICDs implanted in the US patients between 2005 and 2016. One ICD identification number represented one patient; however, it is possible that a small number of patients had more than one ICD implantation, which was neglected in this study.
Among the 26 possible ICD variables, only nine were available in all patients, and therefore, included in the present study. In addition, a binary indicator variable was added to distinguish biventricular (CRT-D) and conventional devices. The variables are shown in Table 1.
ICD variables considered in the study
| Variables | Description |
|---|---|
| OneOrMoreShocksPerDay | Indicates the occurrence of one or more ventricular high-voltage shocks during the day |
| VtVfEpisodes | Number of VT and VF episodes during the day |
| VRateDuringVtVf | Ventricular rate during VT and VF episodes |
| VRateDuringAtAf | Ventricular rate during atrial tachycardia and fibrillation (AT and AF) episodes |
| NSTEpisodes | Number of non-sustained (non-treated) tachycardia events during the day (i.e. tachycardia events that did not lead to an ATP or shock treatment) |
| VPercentPacingPerDay | Percentage of ventricular pacing during the day |
| AvgVRateDay | Average ventricular heart rate during the day (08:00 a.m.–08:00 p.m.) |
| AvgVRateNight | Average ventricular heart rate during the night (12:00 p.m.–04:00 a.m.) |
| ActivityPerDay | Activity measure during the day |
| Model | Type of device (conventional or biventricular ICD) |
The first nine variables were from daily recordings, while the last indicates whether the ICD was right ventricular or biventricular (CRT-D).
ATP, antitachycardia pacing; AF, atrial fibrillation; AT, atrial tachycardia; ICD, implantable cardioverter-defibrillator; VF, ventricular fibrillation; VT, ventricular tachycardia.
Construction of datasets
The gathered ICD measurements were used to generate datasets to construct and evaluate the predictive models (see Figure 1). Nine time-dependent variables (see Table 1) from four consecutive days as well as the model variable (CRT-ICD vs. conventional ICD) were considered when predicting whether the patient would suffer from an ES event the next day. This gave a total number of predicted variables of 37 (4 × 9 + 1 = 37). Of the patients who experienced ES, all ES events were extracted where the patient did not experience another ES within the preceding 2 weeks (n = 2367). This was done because we are interested in the detection of ES for triggering interventions. We presume that an ES leads to an intervention afterwards, and thus excluded ES where a closely preceding event already gave a strong alarm signal. Note that this makes the detection problem not only more relevant in practice but also more challenging. It has been argued that 2 weeks without recorded arrhythmia have to pass after an ES before the event is considered to have ended,4 and we considered the same period. The data points representing situations not leading to an ES were extracted from periods that were not followed by an ES event within 1 week. A total of 7.2% (n = 3789) of data points were extracted from ES patients in accordance with the fraction of patients suffering an ES. The remaining 92.8% (n = 48 359) were extracted from patients not suffering from ES within the monitoring interval. The total number of non-ES data points was 52 148, and the total size of the dataset was 54 521.
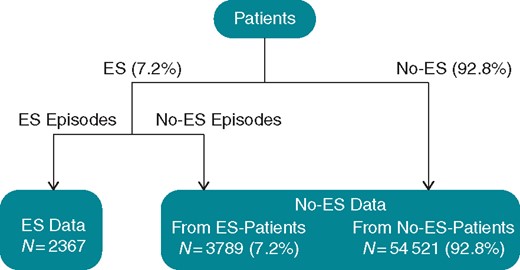
Schematic of the dataset generation. ES, electrical storm.
In the next step, the data were randomly split into a training set (80% of the data) and a test set (20% of the data). This split was done so that the training and test set did not contain data points from the same patients.
Statistics
Two separate statistical models were developed to predict ES: (i) a logistic regression (LR) model and (ii) a model based on random forests (RFs), which is an established and robust machine learning technique.13,14 The choice of a RF classifier with 500 trees and a monitoring period of 4 days was made based on a smaller dataset from 1354 Danish patients by measuring the AUC when varying the number of trees and days.
The predictive ability of the two models was evaluated using receiver operating characteristic (ROC) curves and calculated accuracy [(true positives + true negatives)/all predictions]. Moreover, the sensitivity of the classifiers was measured at 90% and 99% specificity, as the number of false positives should be low for clinical applications. The test devised by DeLong et al.15 was used to compare AUC values for the two models.
The accuracy of the models was compared using a two-sided McNemar’s test. A one-sided binomial test was used to test whether a model performed better than the baseline class probabilities, that is better than a model always predicting that the patient will not suffer from ES the next day. The significance level was set to 0.01.
The logistic model used a z-test to evaluate the relevance of predictive variables by testing that the weights associated with the variables where significantly different from zero. In a RF model, the relevance of variables is not measured in a similar way but can be measured by their permutation importance (Supplementary material online, Random Forest section).13
When comparing models, the impact of class skew must be addressed. Electrical storm occurs rarely in most patients; however, in the selected data, the prevalence of ES was 4.4%. This implies that the reported classification accuracies do not directly reflect the true performance of the models in practice. Therefore, the AUC, the area under the ROC curve, is mostly relied upon as this is invariant under class skew.
It should be noted that the predictive ability of the models was computed on data not used in the model building process. Furthermore, the test data was not used for any modelling decisions that could otherwise have compromised the results.
Results
The study assessed remote monitoring data from 19 935 ICDs implanted in US patients between 2005 and 2016. Of the ICDs, 5522 were CRT-D. A total of 2367 ES events occurred in 1410 patients during an average monitoring period of 1206 ± 575 days/patient. The therapies delivered are shown in Table 2.
Number of shocks during ES events observed in this study
| Events | Patients | |
|---|---|---|
| Three or more shocks | 245 | 231 |
| Two shocks | 135 | 126 |
| One shock | 516 | 472 |
| ATPs only | 1471 | 817 |
| Events | Patients | |
|---|---|---|
| Three or more shocks | 245 | 231 |
| Two shocks | 135 | 126 |
| One shock | 516 | 472 |
| ATPs only | 1471 | 817 |
ATP, antitachycardia pacing; ES, electrical storm.
The LR model and RF model both predicted ES with an accuracy of 0.96 (P > 0.01; McNemar’s test, two-sided for differences between models). Both results were significantly better than simply predicting that the patient will not suffer from ES the next day (P < 0.01; binomial test, one-sided, baseline = 95.6%). The RF model showed a significantly higher AUC than the LR model (0.80 vs. 0.75, P < 0.01; see Figure 2 and Table 3). At a specificity of 0.9, the LR and RF models had sensitivities of 0.53 and 0.61, respectively. At a specificity of 0.99, the sensitivities were 0.37 and 0.39, respectively.
Accuracies, AUC values, and sensitivities at 0.9 and 0.99 specificity
| Logistic regression | Random forest | |
|---|---|---|
| Accuracy | 0.96 | 0.96 |
| AUC | 0.75 | 0.80 |
| Sensitivity at 0.9 specificity | 0.53 | 0.61 |
| Sensitivity at 0.99 specificity | 0.37 | 0.39 |
| Logistic regression | Random forest | |
|---|---|---|
| Accuracy | 0.96 | 0.96 |
| AUC | 0.75 | 0.80 |
| Sensitivity at 0.9 specificity | 0.53 | 0.61 |
| Sensitivity at 0.99 specificity | 0.37 | 0.39 |
AUC, area under the curve.
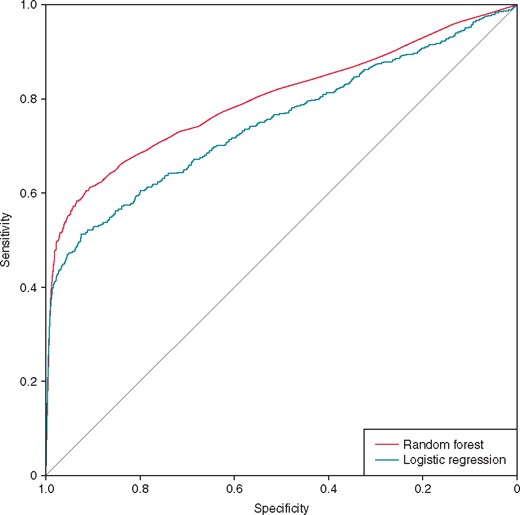
ROC curves for predicting ES. ES, electrical storm; ROC, receiver operating characteristic.
The most important predictors of ES are summarized in Figures 3and4. Both models emphasise the most recent measurements. From the current day, ActivityPerDay and AvgVRateDay were relevant in both models. In the RF model, VPercentPacingPerDay, AvgVRateDay, and ActivityPerDay were relevant from all days. In the logistic model, the number of VT and VF episodes from the current day was also significant. Measurements of ventricular rate during previous VT and VF (VRateDuringVtVf) and the number of non-sustained episodes (NSTEpisodes) from all days turned out to be significant predictive variables in the LR model; however, they were not relevant in the RF model. The type of ICD used was not important for the prediction in either model.
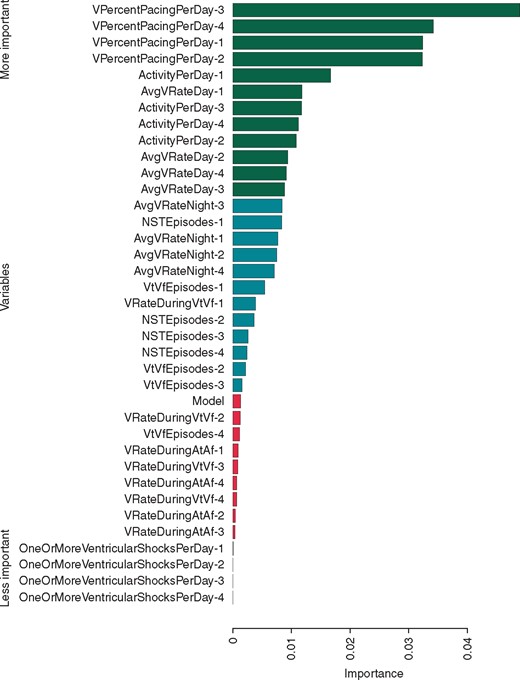
Representative feature relevance obtained by predicting ES (random forest model) by measuring their permutation importance (Supplementary material online, Random Forest section).13 The 33% most and least important variables are coloured green and red, respectively. The number after the name of the variable indicates how many days before the day for which the prediction is made the value was measured (e.g. VPercentPacingPerDay-2 refers to the percent of pacing 2 days before). ES, electrical storm.
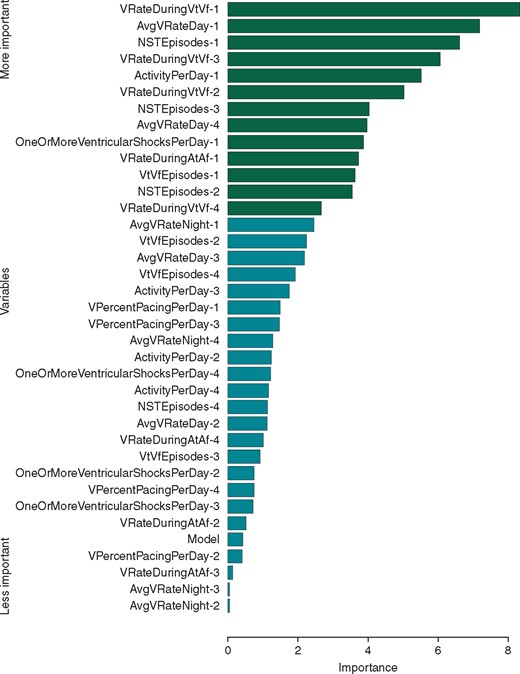
Variable importance in the logistic regression model for ES prediction ordered by z-value. Variables significant at the 0.01 level are marked in green (P < 0.01, Z-test). ES, electrical storm.
Experiments were repeated over shorter periods to verify whether it was important to consider measurements from four consecutive days. The results are summarized in Table 4 and highlight that considering measurements from only 1 or 2 days before the ES impaired the performance.
Sensitivities and AUC values depending on how many consecutive days are considered
| 1 day | 2 days | 3 days | 4 days | |
|---|---|---|---|---|
| AUC | ||||
| Logistic regression | 0.70 | 0.72 | 0.74 | 0.75 |
| Random forest | 0.71 | 0.75 | 0.79 | 0.80 |
| Sensitivity at 0.9 specificity | ||||
| Logistic regression | 0.41 | 0.46 | 0.51 | 0.53 |
| Random forest | 0.47 | 0.53 | 0.59 | 0.61 |
| Sensitivity at 0.99 specificity | ||||
| Logistic regression | 0.26 | 0.31 | 0.35 | 0.37 |
| Random forest | 0.33 | 0.36 | 0.37 | 0.39 |
‘1 day’ refers to using today’s measurement to predict ES tomorrow, while ‘4 days’ corresponds to the results in Table 3.
AUC, area under the curve; ES, electrical storm.
Discussion
These results show that, without additional clinical information, daily stored ICD summaries can predict the occurrence of ES on the following day. A modern machine learning model (RF) demonstrated improved predictions compared with a LR model, with AUCs of 0.80 and 0.75, respectively.
The most important variables for prediction were the percentage of pacing and reduced daytime activity, and these variables are known to be indicators of deteriorating heart disease. A reduction in patient activity, as measured by the device, is associated with the progression of heart failure and imminent hospitalization for cardiac reasons.16,17 A high percentage of right ventricular pacing increases the risk of heart failure and a low percentage of biventricular pacing is also related to increased heart failure.17 It is interesting that the classifiers picked up this variable. Conventional ICD patients could be expected to have close to 0% pacing on average whereas patients with CRT-D could be expected to have close to 100% pacing. Indeed, we find that most of the devices recorded either 0% or 100% of pacing, but for the non-CRT-D patients we still have values in-between (this is visualized in a histogram in the Supplementary material online, Figure A1). The amount of pacing may be used by the classifier as a marker for the otherwise unknown type of the heart disease, which is more fine-grained than just differentiating between CRT-D and other patients. As we included a model-type variable indicating CRT-D devices, our learning algorithms could rely on this variable to differentiate between the device types, especially the RFs could use it for splitting. However, the device type was not among the important variables for neither RF nor LR. We have also performed a control experiment, where instead of using the model-type variable we created a separate model for CRT-D and non-CRT-D patients, however, this did not change the results.
Previously-treated and non-treated VT and VF episodes were reported as risk factors for ES in other studies, and these variables were also relevant predictors in the models presented here.3–6 Interestingly, the number of shock therapies prior to ES was not important for prediction. This may be explained by the low rate of shock therapies due to device programming for the avoidance of preventable shocks.18
Data from the day preceding the ES were particularly important; however, experiments considering fewer days demonstrated the importance of considering features over a longer period and not just a single day.
This analysis was based on 19 935 ICD patients, including 1410 who experienced ES events. Thus 7.2% of the population experienced at least one ES episode during a 3.5-year period. This is somewhat lower than the 10–25% reported previously.3–7 One reason for this discrepancy may be that a better estimate was achieved due to the size of the dataset in this study. Another reason could be because the definition of ES varies within the medical literature. Another potential source of difference is that our evaluation relies on the device-based classification of episodes. We performed a control experiment where we only predicted ES where at least one episode was treated by a shock (results in the Supplementary material online, Table A1). However, the results were worse, because of the low incident rate and small sample size.
In general, the prediction of ES based on ICD data is challenging. The low event rate of ES complicates the identification of measurements that contribute to ES, which is an issue that can only be addressed by considering large amounts of data, as in this study. To the author’s knowledge, analysing ICD data from a large cohort independently of other clinical information has not been done before; however, a similar analysis was carried out to predict heart failure.17 Remote monitoring data were recently used to predict VT and VF episodes terminated by a shock; however, these preliminary studies considered only 25 patients and did not evaluate the predictive models on data independent of the model building process.19
Being able to predict ES could have important clinical implications for patients with ICDs. The models could be incorporated into a remote monitoring system that would allow clinicians to act before the occurrence of an event.
Despite an accuracy of 0.96 and an AUC of 0.80, the model performance (61% sensitivity at 90% specificity) is not sufficient for current clinical implementation as it produced too many false predictions. Adding additional clinical information that correlates with ES (i.e. diagnosis, age and medication) would most likely increase the predictive performance.5–7,9–12 However, if the prediction must be implemented directly on the device or at a data centre where additional patient information is not available (e.g. due to privacy reasons), we are exactly in the scenario considered in our study.
From a clinical perspective, it would be beneficial if predictions could be made more than 1 day in advance; however, this is left to future work.
Limitations
There are limitations of this study. Implantable cardioverter-defibrillator therapy is initiated so quickly that it is impossible to separate sustained (≥30 s) from non-sustained (<30 s) arrhythmias. The aggressiveness of the device programming will influence how the therapy from the device is given.
Since ICDs can deliver inappropriate therapy (often given to atrial fibrillation), assurance of a correct arrhythmia diagnosis with verification of ventricular arrhythmia would have been desirable. We cannot exclude that a limited number of episodes in this study were inappropriately diagnosed as VT or VF. In particular, incorrect diagnosis of VT with inappropriate ATP treatment was not uncommon in earlier years.20–22 Therefore, we repeated our experiments considering only episodes from January 2011 onwards. However, the results did not change qualitatively.
All patients in the study were US patients, which may have influenced the strategy of device programming, and the results may apply to other patient groups.23
We do not have the information linking devices to patients, and different devices treated independently in our study may belong to the same patient. However, all statistical analyses are performed at the level of ES events and non-ES events. Thus, considering the patient identities would not change the sample sizes. In our analysis, we take care that training and test data stem from different devices. Because a patient could be associated with several devices, data from the same patient might be contained in both training and test data. However, these data would come from different devices and therefore also from very different phases of the patient’s life and can therefore be treated as independent.
Conclusion
In a large cohort of patients with ICD, the occurrence of ES could be predicted 1 day in advance solely using stored ICD summaries. A modern machine learning model (RF) performed better than a standard LR model, with AUCs of 0.82 and 0.77, respectively. Important predictive variables were the percentage of ventricular pacing, the number of previously untreated tachycardias, daytime activity and the average ventricular heart rate. This has possible implications for the detection and prevention of arrhythmias in patients with ICD; however, the models currently show too many false predictions for practical clinical use. The models should ideally be combined with additional clinical data to improve their accuracy.
Acknowledgements
The authors thank Medtronic for providing the data for this study and Matthew Georg Liptrot for proofreading the manuscript.
Funding
This work was supported by the Innovation Fund Denmark under grant [#72–2014-1].
Conflict of interest: A.A.H. is employed at Medtronic, the company which manufactured the ICDs considered in this study and provided the data. J.H.S., C.A.L. and H.H.P. have relevant financial activity (grants, personal fees and other), outside the submitted work. S.S., O.K., J.M., T.O.A. and C.I.: no disclosures.
