


Abstract
Brugada syndrome (BrS) represents a major cause of sudden cardiac death in young individuals. The risk stratification to forecast future life-threatening events is still controversial. Non-invasive assessment of late potentials (LPs) has been proposed as a risk stratification tool. However, their nature in BrS is still undetermined. The purpose of this study is to assess the electrophysiological determinants of non-invasive LPs.
Two hundred and fifty consecutive patients with (Group 1, n = 96) and without (Group 2, n = 154) BrS-related symptoms were prospectively enrolled in the registry. Signal-averaged electrocardiogram (SAECG) was performed in all subjects before undergoing epicardial mapping. Group 1 patients exhibited larger arrhythmogenic substrates (AS; 5.8 ± 2.8 vs. 2.6 ± 2.1 cm2, P < 0.001) with more delayed potentials (220.4 ± 46.0 vs. 186.7 ± 42.3 ms, P < 0.001). Late potentials were present in 82/96 (85.4%) Group 1 and in 31/154 (20.1%) Group 2 individuals (P < 0.001). Patients exhibiting LPs had more frequently a spontaneous Type 1 pattern (30.1% vs. 10.9%, P < 0.001), SCN5A mutation (34.5% vs. 21.2%, P = 0.02), and exhibited a larger AS with longer potentials (5.8 ± 2.7 vs. 2.2 ± 1.7 cm2; 231.2 ± 37.3 vs. 213.8 ± 39.0 ms; P < 0.001, respectively). Arrhythmogenic substrate dimension was the strongest predictor of the presence of LPs (odds ratio 1.9; P < 0.001). An AS area of at least 3.5 cm2 identified patients with LPs (area under the curve 0.88, 95% confidence interval 0.843–0.931; P < 0.001) with a sensitivity of 86%, specificity 88%, positive predictive value 85%, and negative predictive value 89%.
The results of this study support the role of the epicardial AS as an electrophysiological determinant of non-invasive LPs, which may serve as a tool in the non-invasive assessment of the BrS substrate, as SAECG-LPs could be considered an expression of the abnormal epicardial electrical activity.
ClinicalTrials.gov number (NCT02641431; NCT03106701).
In patients with BrS, the nature of noninvasive late potentials (LP) recorded by SAECG are still undetermined.
Epicardial mapping technique was used to describe the arrhythmogenic substrate (AS).
The AS and its electrophysiological properties represent the main determinants of noninvasive LPs in BrS.
A 3.5 cm2 AS area discriminated patients exhibiting LPs with 86% sensitivity, 88% specificity, an 85% positive predictive value, and an 89% negative predictive value.
SAECG abnormalities are more frequently observed in patients experiencing malignant ventricular arrhythmias.
Introduction
In the last two decades, Brugada syndrome (BrS) has gained considerable scientific interest as a major cause of sudden cardiac death (SCD) in young, otherwise healthy individuals.1,2
The incidence of life-threatening arrhythmic events in BrS patients is reported to be 13.5% per year in patients with a history of cardiac arrest (CA), 3.2% per year in patients with syncope, and 1% per year in those who are asymptomatic.3,4 However, the most appropriate method for risk stratification to forecast future life-threatening arrhythmic events is still controversial, especially when the disease did not show yet its clinical malignancy, since SCD might be the first manifestation. In fact, implantable cardioverter-defibrillator (ICD) represents the main therapeutic option for high-risk patients, although it bares practical and psychological consequences and de facto does not represent a definitive but palliative cure. Therefore, since the perceived prevalence of the syndrome is increasing, due to better understanding of this condition, there is an overwhelming clinical need for further parameters that can help in refining risk stratification.1,3
Late potentials (LPs) are abnormal low-amplitude signals (LAS) in the terminal part of the QRS complex, obscured by noise in a standard body surface electrocardiogram (ECG), whose presence detected by signal-averaged electrocardiography (SAECG) has been described in BrS patients with a positive correlation to the risk of arrhythmic events.5–13 However, their use as a non-invasive risk stratification tool is still controversial, as well as their origin in this subset of patients.1
Although a univocal pathophysiological mechanism of ventricular arrhythmias (VAs) in BrS remains unclear, recent pioneering studies have identified a discrete arrhythmogenic substrate (AS) located in the epicardium of the right ventricle, which is related to both the Type 1 ECG pattern and VA inducibility.14–17 Most importantly, its elimination by catheter ablation may normalize the ECG pattern, thus preventing spontaneous VA recurrences.14,15 Accordingly, the presence and electrophysiological properties of the AS likely have a crucial role in the clinical manifestation, as well as the natural history, of BrS. Therefore, we sought to systematically assess the role and determinants of non-invasive LPs in a large series of BrS patients at risk of SCD.
Methods
Study population
Full details of the rationale and design of the BrS registry have been previously published.16 All consecutive patients referred to the Arrhythmology Department of IRCCS Policlinico San Donato for epicardial ablation for BrS have been prospectively enrolled.
Medical history, physical examination, and baseline ECG were obtained in all patients. All patients enrolled had an ICD implanted. The study started in November 2015 as Epicardial Ablation in Brugada syndrome (NCT02641431), enrolling the first 135 patients.15 The last patient was enrolled in November 2017 in an extension study (NCT03106701). The protocol was reviewed and approved by the local Institutional Review Board, and all participants provided written informed consent. Further methodological details are provided in the Supplementary material online. All authors had full access to all data in the study and take responsibility for its integrity and data analysis.
Late potentials detection
All patients underwent SAECG recording approximately 1 h before the procedure. None of the study subjects was taking any antiarrhythmic, antipsychotic, or other drugs known to potentially affect cardiac ion channels before the procedure and at the time of SAECG recording. Late potentials were analysed using the ELI 350 SAECG system (Mortara Instruments Europe, Italy). Analyses were based on quantitative time-domain measurements of the filtered vector magnitude of the orthogonal Frank X, Y, and Z leads during sinus rhythm in all patients. Overlaying 1600 cardiac cycles resulted in noise <1 µV. Band-pass filter frequency was 40–250 Hz bilateral filtering. The following three parameters were assessed by computer algorithm: (i) filtered QRS duration (f-QRSd); (ii) root mean square voltage of the terminal 40 ms of the filtered QRS complex (RMS40); and (iii) duration of low-amplitude signals <40 µV of QRS in the terminal filtered QRS complex (LAS40). Late potentials are considered to be present if both of the following criteria are met:1 RMS40 < 20 μV, and2 LAS40 > 38 ms.6,10
Electrophysiological study and mapping procedure
None of the patients had prior mapping or ablation procedures. Electrophysiological study (EPS) was systematically performed as previously described (Supplementary material online, Methods section).16 All patients underwent a combined endo-epicardial mapping procedure using a three-dimensional (3D) mapping system (CARTO 3, Biosense Webster, CA, USA), as previously described.16,17 Further details are provided in the Supplementary material online. All maps were obtained at baseline conditions and after drug challenge (ajmaline up to 1 mg/kg in 5 min). The abnormal electrograms (EGMs) were identified if they met at least one of the following characteristics: (i) a wide duration (>110 ms) with fragmented component (>3 distinct peaks); (ii) late component of low voltage amplitude ranging from 0.05 to 1.5 mV; (iii) distinct and delayed component exceeding the end of the QRS complex, and (iv) discrete double activity. Total signal duration was measured for each potential before and after drug challenge as previously described.16 Measurements were interpreted and validated online by two expert electrophysiologists using CARTO3 system electronic callipers. The potential duration map was created by collecting the duration of each EGM. As a result, a colour-coded map was obtained showing the regions displaying the shortest (red colour) and the longest (purple colour) durations.16
Statistical analysis
Data are presented as mean ± standard deviation (SD) and as absolute values and percentages, and were tested with the use of χ2 tests, unpaired Student’s t-test, Mann–Whitney U test, or the Kruskal–Wallis H with Dunn’s test for multiple comparisons, as appropriate. Logistic regression analysis was used in univariate and multivariate models to predict LP presence on the basis of values of a set of predictor variables. Significant risk factors from univariate analysis were entered in a multivariate model using the block entry method. Significant risk factors from univariate analysis were entered in a multivariate model using the block entry method. Logistic regression coefficients were also used to estimate odds ratios (ORs) for each of the independent variables in the model. A receiver-operating characteristic (ROC) curve for substrate size and LP presence was generated, and the area under the curve (AUC) was calculated. Substrate size threshold was selected as that displaying optimal sensitivity and specificity for LP discrimination. P-value <0.05 was considered statistically significant. Statistical analyses were conducted using SPSS (v.23, IBM SPSS Statistics).
Results
Study population
A total of 250 BrS patients (199 male, 79.6%; mean age 40.6 ± 12.4 years; range 18–63 years) undergoing epicardial mapping and ablation were enrolled in this study. Among all enrolled patients before the epicardial procedure, 96 had resuscitated CA and/or documented VAs (Group 1), whereas 154 patients did not (Group 2). Forty-nine subjects (19.6%) presented with a spontaneous Type 1 pattern, whereas a SCN5A mutation could be documented in 68 (27.2%). Family history of SCD in early relatives was present in 56 (22.4%) individuals, and 206 (82.4%) were inducible for ventricular tachycardia/ventricular fibrillation (VT/VF) during the EPS. Baseline clinical characteristics of the study population are listed in Table 1.
Clinical and electrophysiological characteristics of the study population
| Overall (n = 250) | Group 1 (n = 96) | Group 2 (n = 154) | P-value | |
|---|---|---|---|---|
| Clinical characteristics | ||||
| Age, years (mean ± SD) | 40.6 ± 12.4 | 40.2 ± 12.1 | 40.9 ± 12.6 | 0.65 |
| Male gender, n (%) | 199 (79.6) | 75 (78.1) | 124 (80.5) | 0.75 |
| Spontaneous Type 1 pattern, n (%) | 49 (19.6) | 27 (28.1) | 22 (14.3) | 0.009 |
| Abnormal SAECG-LPs, n (%) | 113 (45.2) | 82 (85.4) | 31 (20.1) | <0.001 |
| f-QRSd | ||||
| n (%) | 132 (52.8) | 82 (85.4) | 50 (32.5) | <0.001 |
| ms (mean ± SD) | 116.7 ± 10.9 | 123.7 ± 7.8 | 112.3 ± 10.3 | <0.001 |
| RMS40 | ||||
| n (%) | 164 (75.2) | 93 (96.9) | 71 (46.1) | <0.001 |
| µV (mean ± SD) | 18.2 ± 12.1 | 10.0 ± 5.5 | 23.4 ± 12.4 | <0.001 |
| LAS40 | ||||
| n (%) | 156 (62.4) | 86 (89.6) | 70 (45.5) | <0.001 |
| ms (mean ± SD) | 40.3 ± 10.5 | 47.3 ± 11.2 | 35.9 ± 7.3 | <0.001 |
| Family history of early SCD, n (%) | 56 (22.4) | 26 (27.1) | 30 (19.5) | 0.16 |
| SCN5A mutation, n (%) | 68 (27.2) | 35 (36.5) | 33 (21.4) | 0.01 |
| SND, n (%) | 11 (4.4) | 7 (7.3) | 4 (2.6) | 0.11 |
| Inducible VT/VF during PES before ajmaline test, n (%) | 141 (56.4) | 63 (65.6) | 78 (50.6) | 0.03 |
| Inducible VT/VF during PES after ajmaline test, n (%) | 69 (27.6) | 20 (20.8) | 49 (31.8) | 0.83 |
| Symptoms status at ICD implant | ||||
| Aborted CA | 30 (12) | 30 (31.2) | 0 (0) | <0.001 |
| Syncope | 107 (42.8) | 43 (44.8) | 64 (41.6) | 0.69 |
| Brugada not-related symptoms | 113 (45.2) | 23 (24) | 90 (58.4) | <0.001 |
| Electrophysiological characteristics | ||||
| Baseline substrate, cm2 (mean ± SD) | 3.8 ± 2.9 | 5.8 ± 2.8 | 2.6 ± 2.1 | <0.001 |
| Baseline abnormal EGM duration (ms) | 199.5 ± 46.6 | 220.4 ± 46.0 | 186.7 ± 42.3 | <0.001 |
| Substrate after ajmaline, cm2 (mean ± SD) | 14.1 ± 7.2 | 16.5 ± 8.1 | 12.6 ± 6.2 | <0.001 |
| Abnormal EGM duration after ajmaline (ms) | 284.7 ± 43.3 | 300.5 ± 41.2 | 274.9 ± 41.8 | <0.001 |
Values are mean ± SD or n and percentage as appropriate.
CA, cardiac arrest; EGM, electrograms; f-QRSd, filtered QRS duration; LAS40, duration of low-amplitude signals <40 µV of the terminal fQRS; LPs, late potentials; PES, programmed electrical stimulation; RMS40, root mean square voltage of the terminal 40 ms of the filtered QRS complex; SAECG, signal-averaged electrocardiogram; SCD, sudden cardiac death; SND, sinus node dysfunction; VT/VF, ventricular tachycardia/ventricular fibrillation.
Clinical and electrophysiological characteristics according to clinical presentation
Table 1 shows the clinical and electrophysiological characteristics of the study cohort according to clinical presentation. Compared to individuals in Group 2, patients in Group 1 more frequently exhibited a spontaneous Type 1 pattern (27 [28.1%] vs. 22 [14.3%], P = 0.009) and SCN5A gene mutation (35 [36.5%] vs. 33 [21.4%], P = 0.01) and had more frequently inducible VT/VF at programmed electrical stimulation (PES) in baseline conditions (Table 1). At SAECG analysis, the rate of LP presence was significantly higher in Group 1 as compared to Group 2 [82 (85.4%) vs. 31 (20.1%), P < 0.001]. The values of f-QRSd, RMS40, and LAS40 in symptomatic Group 1 were 123.7 ± 7.8 ms, 10.0 ± 5.5 µV, and 47.3 ± 11.2 ms, respectively. Corresponding values in the Group 2 were 112.3 ± 10.3 ms, 23.4 ± 12.4 µV, and 35.9 ± 7.3 ms, respectively. All of these parameters were significantly different between the two groups (Table 1). Considering clinical parameters, no other statistically significant differences were observed among the groups (Table 1). Whereas, the electrophysiological characteristics of the epicardial AS were significantly different between the groups (Figures 1–5). Before and after ajmaline administration, Group 1 showed a larger AS area with more delayed and fragmented potentials than Group 2 (Table 1). Of note, individuals with inducible VT/VF at PES more frequently showed abnormal SAECG-LPs and had larger AS areas with more delayed potentials (Supplementary material online, Table S1).
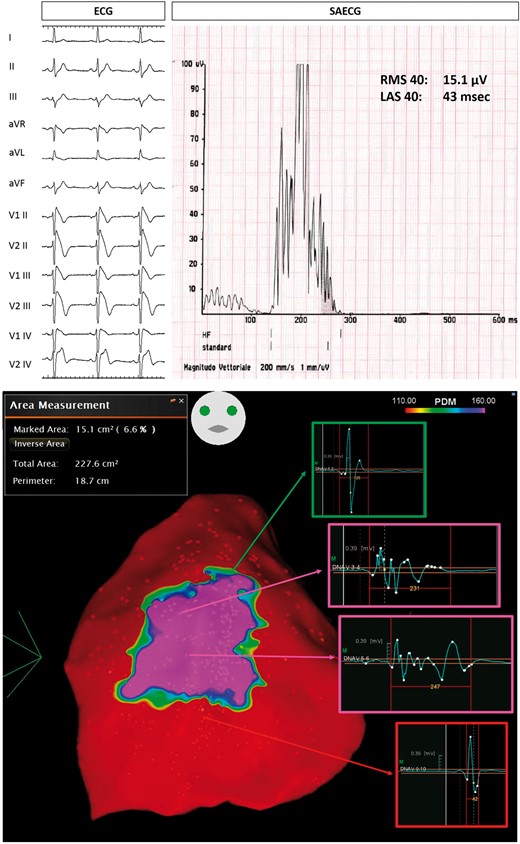
Example of Group 1 patient, with spontaneous Type 1 ECG BrS pattern (top panel on the left), who survived a previous CA. SAECG showed abnormal LPs (top panel on the right). Baseline epicardial mapping demonstrated a large area (15.1 cm2) of abnormal potentials (bottom panel). BrS, Brugada syndrome; CA, cardiac arrest; ECG, electrocardiogram; LAS, low-amplitude signal; LPs, late potentials; RMS, root mean square; SAECG, signal-averaged electrocardiogram.
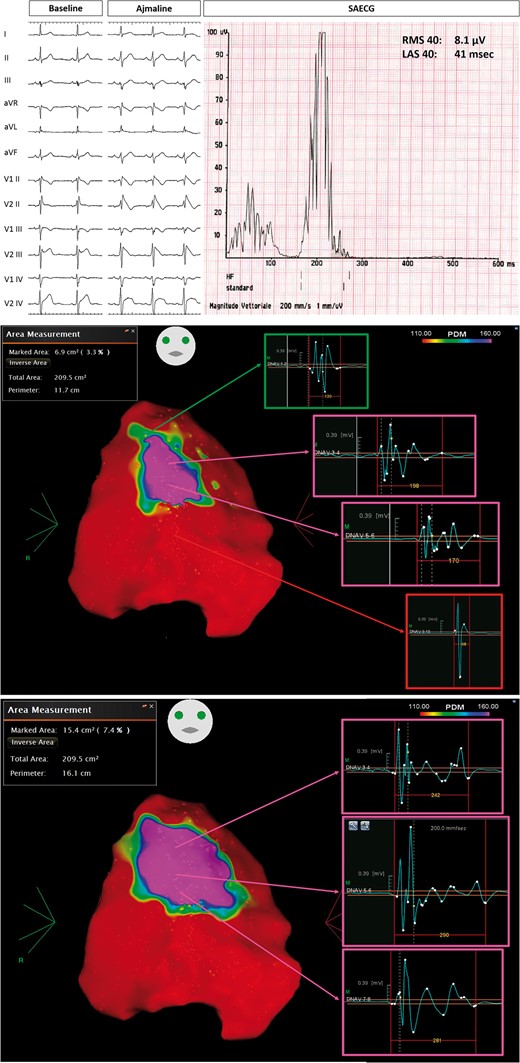
Group 1 patient, with ajmaline-induced Type 1 pattern (top panel), who experienced previous spontaneous VT/VF episodes. SAECG showed abnormal LPs (top panel). Baseline epicardial mapping demonstrated a large area (6.9 cm2) of abnormal potentials (middle panel). After ajmaline administration, with the occurrence of Type 1 ECG, the substrate area increased at 15.4 cm2 (bottom panel). LAS, low-amplitude signal; LPs, late potentials; RMS, root mean square; SAECG, signal-averaged electrocardiogram; VT/VF, ventricular tachycardia/ventricular fibrillation.
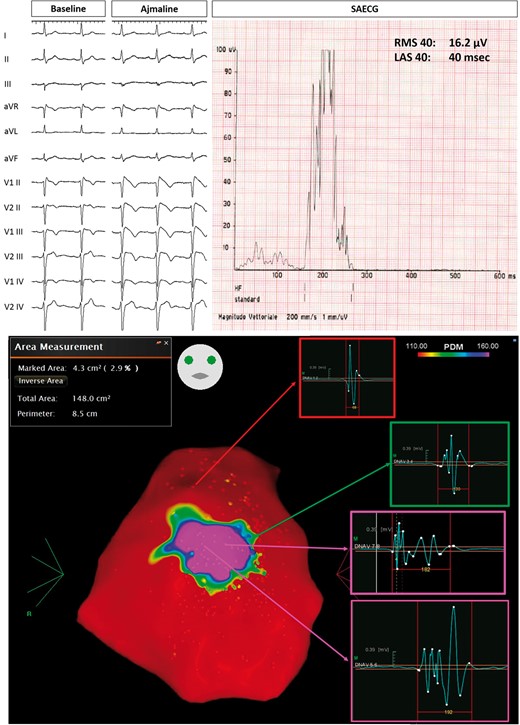
Example of Group 2 patient, with drug-induced Type 1 pattern (top panel on the left). SAECG showed abnormal LPs (top panel on the right). Baseline epicardial mapping demonstrated a 4.3 cm2 area of abnormal electrograms (bottom panel). LAS, low-amplitude signal; LPs, late potentials; RMS, root mean square; SAECG, signal-averaged electrocardiogram.
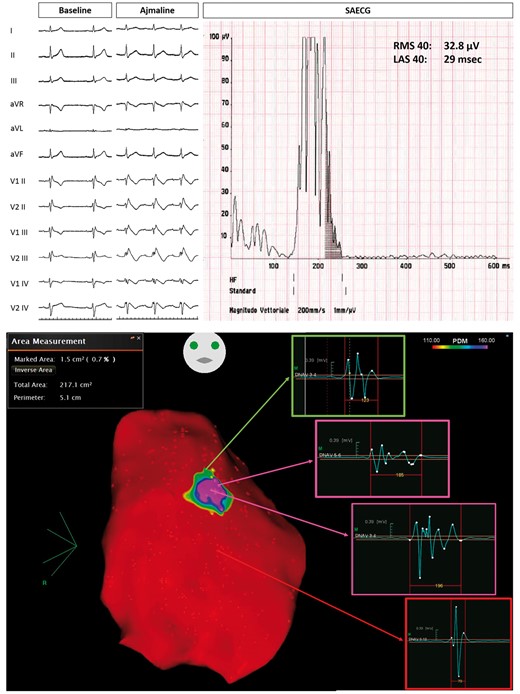
Example of Group 2 patient, with ajmaline-induced Type 1 pattern (top panel). Baseline epicardial mapping demonstrated a small area (1.5 cm2) of delayed electrograms (bottom panel). LAS, low-amplitude signal; RMS, root mean square; SAECG, signal-averaged electrocardiogram.
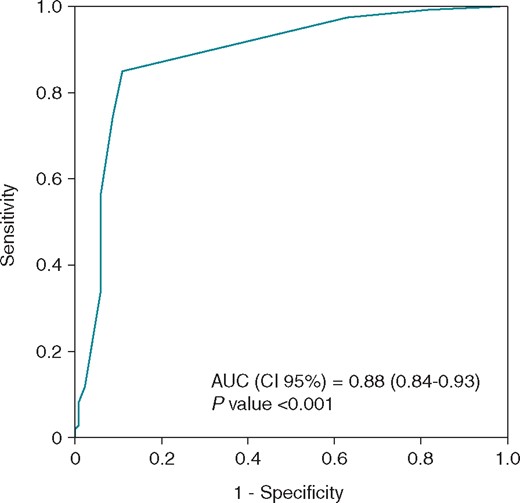
By receiver-operating characteristic (ROC) analysis, a 3.5 cm2 minimum substrate size identified patients with abnormal SAECG late potentials. AUC, area under the curve; SAECG, signal-averaged electrocardiogram.
Clinical and electrophysiological characteristics according to late potentials assessment
Non-invasive SAECG was successfully assessed in all patients before the procedure. Clinical characteristics and AS properties of the study cohort according to LP presence are listed in Table 2. A total of 113/250 (45.2%) BrS patients exhibited LPs, compared to 137/250 (54.8%) individuals who did not. A spontaneous Type 1 pattern and SCN5A mutation were more frequently observed in patients with LPs (LPs positive, or LP+ group) [Type 1 pattern: 39 (34.5%) vs. 29 (21.2%), P = 0.02; SCN5A mutation: 34 (30.1%) vs. 15 (10.9%), P < 0.001; Table 2]. The incidence of VAs requiring an appropriate ICD therapy was higher in LP+ vs. LP-negative (LP−) group [74 (65.5%) vs. 12 (8.8%), P < 0.001]. Among LP+ patients, the average AS area was 5.8 ± 2.7 cm2 and abnormal potential duration was 231.2 ± 37.3 ms (Supplementary material online, Figures S1–S4). Whereas, those with LP− had a significantly smaller AS area (2.2 ± 1.7 cm2) and shorter abnormal EGM duration (213.8 ± 39.0) as compared to the LP+ group (P < 0.001, respectively) (Supplementary material online, Figures S1–S4). Moreover, LP+ patients showed a larger area of AS area and abnormal potential duration after ajmaline administration as compared to LP− individuals (16.4 ± 8.4 vs. 13.9 ± 6.5 cm2, P = 0.004; 302.3 ± 38.9 vs. 285.7 ± 35.9 ms, P < 0.001; Table 2). In addition, patients with more abnormal SAECG criteria showed larger substrate size and longer abnormal potentials (Supplementary material online,Table S2, Figure S5).
Clinical and electrophysiological characteristics of patients according to signal-averaged electrocardiogram late potentials
| LP+ (n = 113) | LP− (n = 137) | P-value | |
|---|---|---|---|
| Clinical characteristics | |||
| Age, years (mean ± SD) | 39.8 ± 11.2 | 40.2 ± 13.5 | 0.22 |
| Male gender, n (%) | 90 (79.6) | 79.6 (76.7) | 1.00 |
| Spontaneous Type 1 pattern, n (%) | 34 (30.1) | 15 (10.9) | <0.001 |
| Family history of early SCD, n (%) | 27 (23.9) | 29 (21.2) | 0.65 |
| Appropriate ICD therapies, n (%) | 74 (65.5) | 12 (8.8) | <0.001 |
| SCN5A mutation, n (%) | 39 (34.5) | 29 (21.2) | 0.02 |
| Inducible VAs during PES before ajmaline test, n (%) | 72 (63.7) | 69 (50.3) | 0.04 |
| Electrophysiological characteristics | |||
| Baseline substrate, cm2 (mean ± SD) | 5.8 ± 2.7 | 2.2 ± 1.7 | <0.001 |
| Baseline abnormal EGM duration (ms) | 231.2 ± 37.3 | 213.8 ± 39.0 | <0.001 |
| Substrate after ajmaline >200 ms, cm2 (mean ± SD) | 16.4 ± 8.4 | 13.9 ± 6.5 | 0.004 |
| Abnormal EGM duration after ajmaline (ms) | 302.3 ± 38.9 | 285.7 ± 35.9 | <0.001 |
EGM, electrograms; ICD, implantable cardioverter-defibrillator; LPs late potentials; PES, programmed electrical stimulation; SCD, sudden cardiac death; SD, standard deviation; VA, ventricular arrhythmias.
Predictors of abnormal signal-averaged electrocardiogram late potentials
Table 3 shows the list of parameters associated with the presence of LPs. Univariate analyses showed that several factors correlated with LP presence (Table 3). However, after multivariate analysis, the substrate size and abnormal potential duration evaluated at baseline conditions were the strongest variables retained as independent predictors of LPs assessed at SAECG. The substrate size had the most significant value [OR 1.9, 95% confidence interval (CI) 1.5–2.2, P < 0.001]. Receiver-operating characteristic curve was constructed from substrate size for LP discrimination (Figure 5). Predictive performance increased with larger AS area, showing an AUC of 0.88 (95% CI 0.843–0.931, P < 0.001). The 3.5 cm2 area for the AS was chosen based on the highest sensitivity and specificity for identifying the presence of LPs [sensitivity 0.865 (0.787–0.922), specificity 0.878 (0.811–0.927), positive predictive value 0.849 (0.782–0.898), negative predictive value 0.890 (0.835–0.929), and predictive accuracy 0.872 (0.824–0.910)].
Clinical and electrophysiological variables associated with abnormal late potentials in Brugada syndrome patients
| Univariate analysis | Multivariate analysis | |||
|---|---|---|---|---|
| OR (95% CI) | P-value | OR (95% CI) | P-value | |
| Age (years) | 0.993 (0.973–1.013) | 0.492 | ||
| Male gender | 0.995 (0.536–1.846) | 0.987 | ||
| Positive SCN5A | 1.963 (1.116–3.451) | 0.019 | 1.894 (0.855–4.193) | 0.116 |
| Spontaneous Type 1 ECG | 3.500 (1.791–6.842) | <0.001 | 2.016 (0.728–5.584) | 0.177 |
| SCD family history | 1169 (0.644–2.122) | 0.607 | ||
| Inducible VT/VF | 1.888 (0.924–3.859) | 0.081 | 1.506 (0.535–4.238) | 0.438 |
| Substrate size (cm2) | 2.186 (1.816–2.632) | <0.001 | 1.851 (1.529–2.240) | <0.001 |
| Potential duration (ms) | 1.027 (1.020–1.035) | <0.001 | 1.018 (1.008–1.027) | <0.001 |
CI, confidence interval; OR, odds ratio; SCD, sudden cardiac death; VT/VF, ventricular tachycardia/ventricular fibrillation.
Discussion
Main findings
To the best of our knowledge, this is the first study that systematically evaluated a correlation between LPs recorded with SAECG and the epicardial AS in a large cohort of BrS patients presenting with various clinical manifestations. The main findings of this study are the following: (i) the AS and potential duration represent the main determinants of non-invasive LPs in BrS; (ii) a 3.5 cm2 AS area discriminated patients exhibiting LPs with 86% sensitivity, 88% specificity, an 85% positive predictive value, and an 89% negative predictive value; and (iii) SAECG abnormalities are more frequently observed in symptomatic patients.
Non-invasive late potentials in Brugada syndrome
The LPs are obscured by noise in a standard body surface ECG because of their low amplitude, and they can be detected by a high-resolution ECG technique. To date, previous studies have reported that abnormal SAECG is useful for identifying the risk of VAs in patients with structural heart disease and after myocardial infarction.18,19 Non-invasive assessment of LPs may reflect ventricular conduction delay and have been used to detect high-risk individuals among patients with myocardial scar.5 Moreover, the presence of LPs in BrS patients has also been described.6–13 In this study, LPs could be identified in roughly 85% of patients who have experienced symptomatic VAs, compared to 20% among those who did not. This observation is in line with previous experiences, as the incidence of LPs ranges between 80% and 100% in symptomatic BrS patients.9 Several investigators have described the role of LPs on SAECG as a useful risk stratification tool in BrS patients. In a prospective study of 124 BrS patients without a history of CA, Ikeda et al.5 demonstrated that spontaneous change in ST-segment was associated with the highest subsequent risk of developing an arrhythmic event, and the additional presence of LPs may improve its predictive value. Accordingly, a prospective study by Huang et al.10 supported the promising role of LPs in risk stratification assessment.
In this study, we have also reported the rate of SAECG abnormalities and their association with arrhythmic events, supporting their prognostic role in this patient population. Nevertheless, risk stratification in BrS remains a clinical challenge as the predictive role of each variable alone (invasive or not) has shown conflicting results (e.g. QRS fragmentation, early repolarization, LPs, inducibility at EPS, etc.).20 However, the combination of several risk factors may show relevant prognostic implications in the management of these patients, in order to better identify the subset of population with a very low rate of arrhythmic events, thus avoiding unnecessary therapies.3,20
Although they might have a prognostic impact in this patient population, the nature and the electrophysiological determinants of non-invasive LPs in BrS patients are still unknown. Benchside work from Antzelevitch demonstrated that ST-segment elevation in BrS syndrome could be explained on the basis of a transmural heterogeneity of repolarization between endo-epicardium.21 The repolarization hypothesis holds that the second upstroke of the epicardial cell action potential is greatly accentuated, which may register itself as LPs on SAECG.21 On the other end, an abnormality in depolarization and conduction disorders associated with sodium channel defects is another possible explanation for LPs in this population. In fact, in this study population, both spontaneous Type 1 ECG pattern either SCN5A mutations were significantly associated with the presence of abnormal LPs. However, the most important information can be gathered from the description of the AS, which is not only associated with the clinical presentation of the disease, but it also may be considered one of the main electrophysiological determinants of non-invasive LPs. The results of this study may favour a depolarization disorder as a main contributor to the arrhythmogenic mechanism of the disease and to the origin of LPs in BrS, thus providing new pathophysiological information, as none of the abovementioned mechanisms may explain alone the broad spectrum of complex clinical manifestations of the syndrome.
Arrhythmogenic substrate in Brugada syndrome and risk of ventricular arrhythmias
After initial demonstration of electrophysiological abnormalities in the epicardium of BrS patients, it has been reported that the AS may play a role as a determinant of both ECG either clinical manifestation of the disease.15,16 In fact, patients experiencing symptoms due to VAs have different electrophysiological properties compared to those who are still asymptomatic, and who have not yet experienced a potentially life-threatening event.16 In fact, as occurred in our series, those having survived a previous CA or having already experienced appropriate ICD therapies show a larger epicardial AS area characterized by prolonged and fragmented potentials, whereas those without arrhythmic events have less aggressive abnormalities in terms of substrate area dimensions and dispersion of the electrograms. These findings further strengthen the relevance of the epicardial AS in BrS, as these concepts are also supported by the evidence that the BrS substrate elimination may suppress VAs recurrences and modify the phenotype expression of the disease.14,15
Our study was conducted in a population with heterogeneous clinical characteristics, evaluated, and/or referred to our centre because they were deemed high-risk patients. Patients survived to a CA and/or those experienced ICD therapies for VAs represent Group 1, but many of them did not show a spontaneous Type 1 ECG pattern in this cohort. This observation might have several explanations. Brugada ECG pattern is dynamic overtime and sensitive to many external influences (e.g. fever, meal, drugs, exercise, etc.). Therefore, the incidence of spontaneous Type 1 ECG might have been underestimated. Furthermore, although drug-induced BrS is generally associated to a lower arrhythmic risk, it has been reported that nearly half of BrS individuals surviving to a CA show a non-Type 1 ECG pattern.21 Therefore, the absence of a spontaneous diagnostic pattern might not be the only marker of risk. Furthermore, after the 2005 consensus statement, we are witnessing a change clinical scenario as newly diagnosed BrS patients are showing less frequently a spontaneous Type 1.4,22,23 This observation may be due to a more proactive attitude in BrS diagnosis, especially among patients with syncope and asymptomatic family members.
Conversely, although Group 2 patients did not experience ICD therapies, they presented a high-risk clinical profile (history of syncope, spontaneous Type 1, early family history of sudden death, sinus node dysfunction, inducible VT/VF, self-terminating VAs in ICD memory). Therefore, this represents a relatively selected cohort, rather than a ‘low-risk’ population. In our opinion, not all BrS patients with an ICD should undergo catheter ablation; however, the risk of future arrhythmias in this population should rely on multiparametric score, which may include clinical factors, invasive and non-invasive parameters (e.g. SAECG, QRS fragmentation, early repolarization, inducible arrhythmias, etc.).3,20 In the light of the observations, SAECG might be used to screen BrS patients for ablation, although further studies are needed to confirm these results.
Predictors of non-invasive late potentials in Brugada syndrome and clinical implications
The noteworthy feature of this study was the independent association between the extent of the AS and epicardial potential dispersion with the presence of non-invasive LPs. A cut-off value of 3.5 cm2 adequately discriminated patients with LPs with high sensitivity and specificity of the test. As a contrary, the absence of LPs correlated with a smaller AS area. The high negative predictive value might also identify those with a smaller substrate and this finding could be clinically relevant, as it may improve risk stratification.
Furthermore, other variables were significantly associated with the presence of LPs at univariate analysis, namely spontaneous Type 1 ECG pattern and SCN5A mutations. However, they were excluded in the multivariate analysis. This might be explained also by the dynamicity of the AS and by its heterogeneous nature, in which conduction and repolarization abnormalities may be respectively prevalent in different patient settings.
This may be considered the first clinical demonstration of the association between epicardial abnormalities with LPs detected by SAECG in BrS, and this might represent an attempt in substrate non-invasive characterization. Nowadays, AS evaluation is still invasive, requiring an epicardial access, therefore it would be desirable to use non-invasive tools to assess the dimension of the substrate in each individual patient, in order to pursue and to establish a more individualized treatment. In fact, our risk stratification schemes still do not consider the electrophysiological properties of the AS in each individual patient. Moreover, the sensitivity of the ECG may be low, as the absence of a spontaneous coved-type ECG does not necessarily imply the lack of the AS, whereas LPs proved to be very sensitive in detecting even a small area of epicardial abnormalities. Therefore, a non-invasive approach using SAECG may be useful in evaluating substrate characteristics, refining and integrating our current approach to reserve further therapies only to those individuals at higher risk of SCD, as it has been demonstrated that they may benefit the most from ICD insertion or catheter ablation.
Limitations
To the best of our knowledge, this is the first prospective study evaluating the correlation between non-invasive LPs and epicardial AS in a large cohort of BrS patients with various clinical presentations. This study was conducted in a population with heterogeneous clinical characteristics, evaluated and/or referred to a high-volume, experienced centre for BrS patients’ management, because they were deemed high-risk patients. These reasons might explain the higher incidence of ICD therapies and the higher inducibility rate in this cohort. Therefore, these results do not necessarily apply to other patient populations. Considering BrS ECG pattern variability, the true rate of spontaneous Type 1 ECG might have been underestimated. No multiple SAECG measurements were performed, thus potentially underestimating LPs fluctuations. However, the rigorous methodology applied in this study by recording SAECG immediately before the epicardial mapping procedure might significantly minimize this potential limitation. Although QRS fractionation may be associated to the presence of non-invasive LPs and larger AS, this parameter was not evaluated in this study. Future studies are needed to clarify the potential role of non-invasive LPs and the Brugada substrate size in predicting arrhythmic events. Finally, the assessment of clinical indication to catheter ablation, its usefulness or safety are out of the scope of this analysis, as they will be a matter of two currently ongoing randomized trials (ClinicalTrials.gov numbers NCT02704416 and NCT03294278).
Conclusions
The data of this prospective study demonstrate that among patients with BrS, the characteristics of the AS are independent predictors of non-invasive LPs, which could serve as a marker of the abnormal epicardial electrical activity. These results warrant further research aimed at refining risk stratification assessment by pursuing a patient-specific approach in this subset of patients.
Conflict of interest: none declared.
