


Abstract
The Berlin Atrial Fibrillation Registry was designed to analyse oral anticoagulation (OAC) prescription in patients with atrial fibrillation (AF) and acute ischaemic stroke.
This investigator-initiated prospective multicentre registry enrolled patients at all 16 stroke units located in Berlin, Germany. The ongoing telephone follow-up is conducted centrally and will cover 5 years per patient. Within 2014 and 2016, 1080 patients gave written informed consent and 1048 patients were available for analysis. Median age was 77 years [interquartile range (IQR) 72–83], 503 (48%) patients were female, and 254 (24%) had a transient ischaemic attack (TIA). Overall, 470 (62%) out of 757 patients with known AF and a (pre-stroke) CHA2DS2-VASc ≥ 1 were anticoagulated at the time of stroke. At hospital discharge, 847 (81.3%) of 1042 patients were anticoagulated. Thereof 710 (68.1%) received a non-vitamin K-dependent oral anticoagulant (NOAC) and 137 (13.1%) a vitamin K antagonist (VKA). Pre-stroke intake of a NOAC [odds ratio (OR) 15.6 (95% confidence interval, 95% CI 1.97–122)] or VKA [OR 0.04 (95% CI 0.02–0.09)], an index TIA [OR 0.56 (95% CI 0.34–0.94)] rather than stroke, heart failure [OR 0.49 (95% CI 0.26–0.93)], and endovascular thrombectomy at hospital admission [OR 12.9 (95% CI 1.59–104)] were associated with NOAC prescription at discharge. Patients’ age or AF type had no impact on OAC or NOAC use, respectively.
About 60% of all registry patients with known AF received OAC at the time of stroke or TIA. At hospital discharge, more than 80% of AF patients were anticoagulated and about 80% of those were prescribed a NOAC.
The investigator-initiated prospective multicentre Berlin Atrial Fibrillation Registry provides a representative evaluation of oral anticoagulation (OAC) use for stroke prevention in atrial fibrillation (AF) patients with acute ischaemic stroke in a German urban region.
In registry patients with known AF before the index stroke and a pre-stroke, CHA2DS2-VASc score ≥1 guideline-recommended OAC was prescribed in 62% at the time of acute ischaemic stroke or transient ischaemic attack (TIA).
At hospital discharge after the index stroke, more than 80% of all stroke survivors were anticoagulated, especially those with prior ischaemic stroke or TIA, OAC on admission or an index TIA in comparison with an index stroke. A severe neurological deficit as well as carotid endarterectomy were inversely related to OAC prescription.
Compared to the prescription of the vitamin K antagonist phenprocoumon, the number of stroke patients with AF discharged on a non-vitamin K-dependent oral anticoagulant (NOAC) was five-times higher and highest in registry patients with pre-stroke NOAC intake.
Introduction
Atrial fibrillation (AF) is the most frequent cardiac arrhythmia worldwide and its prevalence increases with age. Atrial fibrillation is associated with approximately every fifth ischaemic stroke and patients with AF-related strokes have a high recurrence rate.1 Long-term oral anticoagulation (OAC) using the vitamin K antagonist (VKA) warfarin reduces the risk of recurrent stroke in AF patients by about two-thirds compared to placebo.2 However, due to feared bleeding complications and multiple drug interactions, VKAs are widely underused in routine practice and less than half of all patients still take a prescribed warfarin 2 years after ischaemic stroke.3 According to the results of randomized multicentre trials4, national and international guidelines now recommend OAC using a VKA or a non-vitamin K-dependent oral anticoagulant (NOAC) for stroke prevention in patients with AF and prior ischaemic stroke.1,5,6 Compared to VKAs, NOACs have a fixed daily dosage, a lower rate of drug–drug and drug–food interactions and avoid the need for serial coagulation measurements.7 Ongoing AF registries and retrospective (claims) data analyses demonstrate an increasing use of NOACs in AF patients with or without stroke.8–10
Nevertheless, prospectively collected data on OAC use in the acute and post-acute phase of ischaemic stroke after the approval of the NOACs are rare. While ongoing multicentre registries like RASUNOA prime (NCT02533960) or PRODAST (NCT02507856) do not have a long-term follow-up after acute stroke in AF patients, large AF registries like ORBIT-AF II (NCT 01701817), GARFIELD (NCT01090362), or EORP-AF11 do not explicitly focus on acute stroke patients. Furthermore, all mentioned registries are unable to provide a representative assessment of clinical practice in a certain area due to a selection of study sites and patients.
To provide a representative evaluation of OAC use for (secondary) stroke prevention in AF patients in a defined region, we have established the multicentre prospective Berlin Atrial Fibrillation Registry, including all Departments of Neurology in the area of Berlin, Germany running a stroke unit. All study sites together treat 80–90% of all stroke patients in the wider Berlin area with about 4 million inhabitants.12 Herewith we report the design of the Berlin Atrial Fibrillation Registry, the baseline characteristics of registry patients as well as factors associated with OAC use at the time of stroke/transient ischaemic attack (TIA) or at hospital discharge after the index stroke.
Methods
Ethical conduct
The Charité - Universitätsmedizin Berlin is the sponsor of the investigator-initiated prospective multicentre Berlin Atrial Fibrillation Registry (NCT02306824). The ongoing hospital-based registry received primary approval from the Ethical Committee of the Charité - Universitätsmedizin Berlin, Germany (EA2/033/14). Registry patients provided written informed consent. All study procedures are carried out following the Declaration of Helsinki.
Study design
All 14 Departments of Neurology in the area of Berlin, Germany conducting a stroke unit participated in the Berlin Atrial Fibrillation Registry (see Supplementary material online, Table SI for details), serving for a source population of more than 3 million inhabitants. Study sites were initiated in 2014 and 2015 by members of the study coordinating office located at the Center for Stroke Research Berlin, Charité - Universitätsmedizin Berlin (see Supplementary material online, Table SII). Inclusion and exclusion criteria are shown in Table 1. Conformation of stroke or TIA was based on brain imaging criteria and clinical criteria, following the WHO definition.13 No recommendations were given to the study patients or treating physicians at the 16 participating stroke units (Charité operates three stroke units). The predefined primary outcome measure is patient-reported persistence to OAC (either NOAC or VKA) in stroke patients with AF at 12 months after the index stroke. Detailed information on predefined secondary outcome measures can be found in Supplementary material online, Table SIII. Serious adverse events (SAEs) like recurrent ischaemic stroke or TIA, intracerebral haemorrhage, subarachnoid haemorrhage, major bleeding, myocardial infarction, peripheral arterial embolism, and death of any cause are evaluated by an independent Critical Event Committee (CEC). The ongoing central follow-up is conducted by the study coordinating office and will provide detailed information on stroke recurrence rate and major bleeding rate in patients prescribed an OAC within days after acute ischaemic stroke. Besides the frequency of OAC prescription at 3, 12, 24, 48, 60, and 72 months after stroke, patient self-reported persistence and quality of adherence to OAC as well as self-reported quality of life will be addressed (Supplementary material online, Table SIII).
Inclusion and exclusion criteria of the Berlin Atrial Fibrillation Registry
| Inclusion criteria |
|
| Exclusion criteria |
|
| Inclusion criteria |
|
| Exclusion criteria |
|
AF, atrial fibrillation; ECG, electrocardiogram; TIA, transient ischaemic attack.
Inclusion and exclusion criteria of the Berlin Atrial Fibrillation Registry
| Inclusion criteria |
|
| Exclusion criteria |
|
| Inclusion criteria |
|
| Exclusion criteria |
|
AF, atrial fibrillation; ECG, electrocardiogram; TIA, transient ischaemic attack.
Data assessment and monitoring
Members of the local study sites registered all patients using the electronic Case Report Form (eCRF) in Research Electronic Data Capture (REDCap™) after enrolment (see Supplementary material online for details). Collected information on in-hospital stay after the index stroke included patients’ demographics, past medical history, AF type, stroke type, individual stroke treatment, and stroke severity [assessed by the National Institutes of Health Stroke Scale (NIHSS) score14 on admission and the modified Rankin Scale (mRS) score at discharge15], antithrombotic medication on admission as well as at discharge, level of education, clinical diagnosis of depression, cognitive impairment, and the presence of SAEs. The HAS-BLED score was assessed according to guidelines.1 Classification of measured and previously documented international normalized ratio (INR) values as ‘labile INR’ was at the discretion of the treating physicians. On-site monitoring was conducted by the study central office and started after enrolment of the first five patients. Statistical analysis was performed within a scientific cooperation with the Institute for Clinical Epidemiology and Biometry at the University of Würzburg, Germany.
Statistical methods
The sample size estimation can be found in the Supplementary material online. Baseline patient characteristics are presented as absolute and relative frequencies or median and quartiles. Univariable odds ratios (OR) and respective confidence intervals (CI) are calculated using binary logistic regression analysis. Parameters with P-values <0.1 were transferred into multivariable binary logistic regression analysis and variable selection was conducted using backward selection algorithm. Multicollinearity was examined using the variance inflation factor. As sensitivity analysis, we used generalized linear modelling to estimate OR and CI adjusting for study site. We used the SPSS function ‘GENLIN’ to model a generalized estimation equation. We included the study site as clustering variable, i.e. data across study sites are still assumed to be independent, whereas data within study sites are assumed to be correlated. By using a logit link function, the generalized estimation equation estimates a binary logistic regression model that was extended to a second level (namely the study site level, which complements the patient level). Statistical analysis was performed using SPSS (Version 24, SPSS Inc., Chicago, IL, USA). Two-sided P-values <0.05 were considered statistically significant.
Results
From December 2014 to November 2016, 1080 hospitalized patients with suspected acute ischaemic stroke and known AF before the index stroke or a first episode of AF during the in-hospital stay were enrolled on a consecutive basis. Inclusion criteria (Table 1) were fulfilled in 1050 patients; 29 patients were classified as stroke mimics at hospital discharge, one patient had a long-term indication for OAC besides AF and two patients withdrew consent within the in-hospital stay. The baseline characteristics of the analysed 1048 study patients are presented in Table 2. Patients’ median age was 77 years [interquartile range (IQR) 72–83], 503 (48%) patients were female and 762 (73%) had known AF before enrolment. Of those, 350 (33%) had documented AF during the in-hospital stay after the index stroke. Overall, 254 (24%) had a TIA as index event. The median NIHSS score on admission was 2 points [IQR 1–5], 157 (15.0%) of all patients received intravenous thrombolysis and 81 (7.7%) patients underwent endovascular thrombectomy. The median mRS at hospital discharge was 2 [IQR 1–4], including 309 (29.5%) patients without any stroke-related neurological deficit and 272 (26.1%) patients who were bed-ridden after stroke (mRS score 4–5). Overall, 6 (0.6%) registry patients died in hospital.
Baseline characteristics of 1048 registry patients with AF
| Age, years (median, IQR) | 77 (72–83) |
| Age categories, years, % (n/total) | |
| 18–64 | 10.5 (110/1048) |
| 65–74 | 24.2 (254/1048) |
| 75–84 | 46.4 (486/1048) |
| ≥85 | 18.9 (198/1048) |
| Sex, female, % (n/total) | 48.0 (503/1048) |
| Atrial fibrillation (AF), % (n/total) | |
| AF according to medical history | 72.7 (762/1048) |
| First episode of AF in hospital | 27.3 (286/1048) |
| Index stroke, % (n/total) | |
| Ischaemic stroke | 75.8 (794/1048) |
| Transient ischaemic attack (TIA) | 24.2 (254/1048) |
| NIHSS score on hospital admission, median [IQR] | 2 [1–5] |
| modified Rankin Scale score at discharge, median [IQR] | 2 [1–4] |
| Intravenous thrombolysis on admission, % (n/total) | 15.0 (157/1046) |
| Carotid endarterectomy, % (n/total) | 1.2 (13/1048) |
| Endovascular thrombectomy, % (n/total) | 7.7 (81/1047) |
| CHA2DS2-VASc score pre-stroke, median [IQR] | 4 [3–5] |
| HAS-BLED score pre-stroke, median [IQR] | 2 [2–3] |
| Cardiovascular risk factors, % (n/total) | |
| Prior stroke or TIA | 27.3 (286/1048) |
| Hypertension | 87.1 (913/1048) |
| Heart failure | 14.7 (154/1048) |
| Diabetes | 28.4 (298/1048) |
| History of vascular disease | 28.5 (299/1048) |
| Impaired renal function (eGFR <90 mL/min) | 90.8 (952/1048) |
| In-hospital stay (days), median, [IQR] | 6 [4–8] |
| In-hospital mortality, % (n/total) | 0.6 (6/1048) |
AF, atrial fibrillation; eGFR, estimated glomerular filtration rate; IQR, interquartile range; NIHSS, National Institutes of Health Stroke Scale; TIA, transient ischaemic attack.
Impact factors on oral anticoagulation use at the time of the index stroke
Antithrombotic medication on hospital admission due to the index stroke is depicted in Figure 1 according to AF status pre-admission and pre-stroke CHA2DS2-VASc score. While 286 (27%) study patients had a first episode of AF after hospital admission, 762 (73%) of all study patients had known AF. Of those patients, 5 (0.5%) had a pre-stroke CHA2DS2-VASc score of 0. In the remaining 757 patients with a given indication for OAC, 470 (62.1%) received OAC [in detail 229 (30.3%) VKA and 241 (31.8%) NOAC, 12 (1.6%) received heparin in therapeutic dosage, 164 (21.7%) had an antiplatelet and 111 (14.7%) had no antithrombotic medication (Figure 2, column A)]. The median INR of those 229 registry patients taking a VKA on hospital admission because of the index stroke was 2.0 [IQR 1.7–2.4] (range 1.0–5.6). Of those, 105 (45.9%) patients had an INR within therapeutic range (2–3) on admission. In 275 registry patients, no anticoagulation was prescribed immediately before hospital admission despite given indication for anticoagulation according to present guideline recommendations. In 264 (96%) patients, the treating physicians recognized the given indication for anticoagulation before the index stroke. In 115 (41.8%) out of these 275 patients, no anticoagulation was ever established. In 149 (54.2%) patients, previous OAC was stopped before the index stroke. A reason for stopping anticoagulation was not provided in 104 (69.8%) out of 149 patients. Besides patients’ choice to stop anticoagulation (n = 34; 22.8%), a pervious intracranial bleed (n = 9; 6.0%), a previous (non-intracranial) major bleeding (n = 27; 18.1%), or planned surgery (n = 22; 14.8%) were most often mentioned reasons.
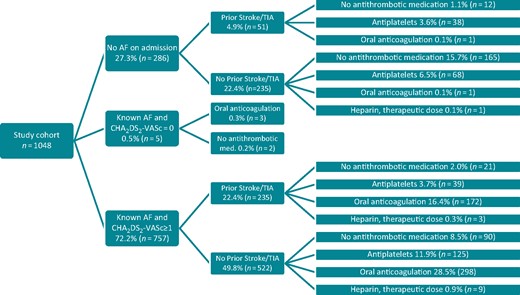
Antithrombotic medication on admission according to AF status and CHA2DS2-VASc score before admission for acute ischaemic stroke in 1048 patients with AF. AF, atrial fibrillation; TIA, transient ischaemic attack.
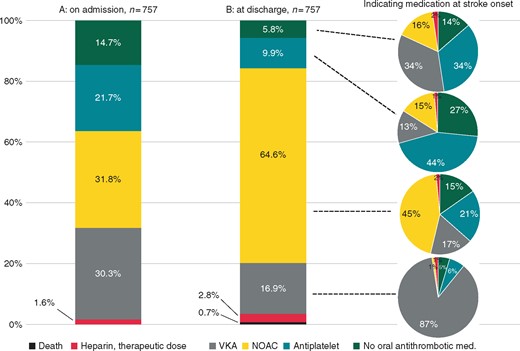
Antithrombotic medication on admission as well as at hospital discharge after the index stroke in 757 patients with known AF and CHA2DS2-VASc ≥1 before the index stroke. AF, atrial fibrillation; NOAC, non-vitamin K-dependent oral anticoagulant; VKA, vitamin K antagonist.
Multivariable analysis (Table 3) revealed significant associations of prior stroke or TIA [OR 1.97 (95% CI 1.40–2.78)], diabetes [OR 1.64 (95% CI 1.17–2.28)], and age [65–74 years: OR 2.00 (95% CI 1.13–3.54), 75–84 years: OR 2.81 (95% CI 1.65–4.78), ≥85 years: OR 2.13 (95% CI 1.28–4.17)] with OAC prescription at the time of stroke/TIA. Atrial fibrillation type (paroxysmal vs. non-paroxysmal), sex, or known cardiovascular risk factors like hypertension, heart failure, vascular disease, or renal impairment [glomerular filtration rate (GFR) <90 mL/min] were not associated with OAC prescription at the time of stroke/TIA. The variance inflation factor values were <1.3 for all variables considered in the multiple logistic regression model.
Characteristics of 757 patients with known AF and pre-stroke CHA2DS2-VASc ≥1 with regard to prescription of OAC (including VKA or NOAC) or no prescription of OAC at the time of the index stroke
| Univariable analysis | Multivariable analysis with backward selection | |||||
|---|---|---|---|---|---|---|
| OAC | No OAC | OR (CI) | P-value | OR (CI) | P-value | |
| n = 470 | n = 287 | |||||
| Age categories, years, % (n) | <0.001b | 0.002 | ||||
| 18–64 | 6.2 (29) | 14.6 (42) | 1 | 1 | ||
| 65–74 | 21.9 (103) | 25.8 (74) | 2.02 (1.15–3.53) | 0.014 | 2.00 (1.13–3.54) | 0.017 |
| 75–84 | 51.7 (243) | 40.4 (116) | 3.03 (1.80–5.12) | <0.001 | 2.81 (1.65–4.78) | <0.001 |
| ≥ 85 | 20.2 (95) | 19.2 (55) | 2.50 (1.40–4.46) | 0.002 | 2.13 (1.28–4.17) | 0.005 |
| Sex, female, % (n) | 50.0 (235) | 44.9 (129) | 0.82 (0.61–1.10) | 0.177 | – | – |
| Known AF before index stroke, % (n) | ||||||
| Paroxysmal AF | 42.3 (199) | 50.2 (144) | 1 | 1 | ||
| Non-paroxysmal or unknown type of AFa | 57.7 (271) | 49.8 (143) | 1.37 (1.02–1.84) | 0.036 | 1.31 (0.96–1.78) | 0.086 |
| Cardiovascular risk factors, % (n) | ||||||
| Prior stroke or transient ischaemic attack | 36.6 (172) | 22.0 (63) | 2.05 (1.47–2.87) | <0.001 | 1.97 (1.40–2.78) | <0.001 |
| Hypertension | 91.3 (429) | 87.5 (251) | 1.50 (0.93–2.41) | 0.093 | 1.32 (0.77–2.26) | 0.307 |
| Heart failure | 16.0 (75) | 20.6 (59) | 0.73 (0.50–1.07) | 0.108 | – | – |
| Diabetes | 36.0 (169) | 24.7 (71) | 1.71 (1.23–2.37) | 0.001 | 1.64 (1.17–2.28) | 0.004 |
| Vascular disease | 31.1 (146) | 34.8 (100) | 0.84 (0.62–1.15) | 0.282 | – | – |
| Renal impairment (eGFR <90 mL/min) | 92.1 (433) | 91.6 (263) | 0.94 (0.55–1.60) | 0.810 | – | – |
| CHA2DS2-VASc pre-stroke, median [IQR] | 5 [4–6] | 4 [3–5] | ||||
| CHA2DS2-VASc pre-stroke, categories, % (n) | <0.001b | 0.168 | ||||
| 1 | 2.1 (10) | 9.1 (26) | 1 | 1 | ||
| 2–3 | 21.1 (99) | 26.6 (76) | 3.39 (1.54–7.45) | 0.002 | 2.12 (0.89–5.03) | 0.088 |
| ≥ 4 | 76.8 (361) | 64.5 (185) | 5.07 (2.40–10.75) | <0.001 | 1.70 (0.67–4.32) | 0.269 |
| HAS-BLED pre-stroke, median [IQR] | 3 [2–3] | 3 [2–3] | ||||
| HAS-BLED pre-stroke, categories, % (n) | ||||||
| 0–2 | 48.9 (230) | 47.0 (135) | 1 | – | – | |
| 3–6 | 51.1 (240) | 53.0 (152) | 0.93 (0.69–1.24) | 0.612 | – | – |
AF, atrial fibrillation; CI, confidence interval; eGFR, estimated glomerular filtration rate; IQR, interquartile range; NOAC, non-vitamin K-dependent oral anticoagulant; OAC, oral anticoagulation; OR, odds ratio; VKA, vitamin K antagonist.
397 registry patients were classified to have non-paroxysmal AF (n = 397) and 17 patients were classified to have an unknown type of AF.
These P-values refer to the overall P-value of the respective categorical variable.
Impact factors on oral anticoagulation use at hospital discharge after the index stroke
Antithrombotic medication in 1042 surviving registry patients was distributed at hospital discharge as follows: 847 (81.3%) received OAC, 26 (2.5%) received heparin in therapeutic dosage, 117 (11.2%) had antiplatelet, and 52 (5.0%) patients had no antithrombotic medication. Prior ischaemic stroke or TIA [OR 1.64 (95% CI 1.08–2.48)], OAC on admission [OR 1.77 (95% CI 1.16–2.70)], and an index TIA [OR 2.07 (95% CI 1.18–3.65) in comparison with an index stroke] were associated with OAC prescription at discharge. A severe neurological handicap at discharge [mRS score 4–5; OR 0.35 (95% CI 0.21–0.57)] and conducted carotid endarterectomy [OR 0.18 (95% CI 0.06–0.62)] were inversely associated with OAC prescription at discharge. Patients’ age, sex, AF type (first episode vs. paroxysmal vs. non-paroxysmal vs. unknown), or known cardiovascular risk factors like hypertension, heart failure, diabetes, vascular disease, or renal impairment (GFR <90 mL/min) had no significant impact on OAC prescription at discharge. These results were consistent with those gained from a sensitivity analysis adjusting for enrolling study sites (Table 4).
Characteristics of surviving 1042 AF patients with regard to prescription of OAC (including VKA or NOAC) or no prescription of OAC at hospital discharge after the index stroke
| Univariable analysis | Multivariable analysis with backward selection | Multivariable analysis adjusting for study site | ||||||
|---|---|---|---|---|---|---|---|---|
| OAC | No OAC | OR (CI) | P-value | OR (CI) | P-value | OR (CI) | P-value | |
| n = 847 | n = 195 | |||||||
| Age categories, years, % (n) | 0.559c | – | – | – | – | |||
| 18–64 | 11.2 (95) | 7.7 (15) | 1 | |||||
| 65–74 | 24.0 (203) | 25.1 (49) | 0.65 (0.35–1.23) | 0.185 | ||||
| 75–84 | 46.2 (391) | 47.7 (93) | 0.66 (0.37–1.20) | 0.173 | ||||
| ≥ 85 | 18.7 (158) | 19.5 (38) | 0.66 (0.34–1.26) | 0.204 | ||||
| Sex, % (n) | – | – | – | – | ||||
| Male | 51.7 (438) | 54.4 (106) | 1 | |||||
| Female | 48.3 (409) | 45.6 (89) | 0.90 (0.66–1.23) | 0.505 | ||||
| Index stroke, % (n) | <0.001c | |||||||
| Ischaemic stroke | 72.3 (612) | 90.3 (176) | 1 | 1 | 1 | |||
| Transient ischaemic attack | 27.7 (235) | 9.7 (19) | 3.56 (2.17–5.85) | 2.07 (1.18–3.65) | 0.012 | 2.04 (1.21–3.45) | 0.008 | |
| NIHSS on admission, median [IQR] | 2 [1–5] | 4 [1–8] | ||||||
| NIHSS on admission, categories, % (n) | <0.001c | 0.289 | 0.409 | |||||
| 0–3 | 80.4 (683) | 66.1 (127) | 1 | 1 | 1 | |||
| 4–7 | 15.9 (135) | 30.2 (58) | 0.56 (0.39–0.82) | 0.003 | 0.88 (0.58–1.34) | 0.555 | 0.87 (0.50–1.52) | 0.622 |
| ≥8 | 3.8 (32) | 3.6 (7) | 0.35 (0.23–0.52) | <0.001 | 0.69 (0.43–1.10) | 0.116 | 0.59 (0.26–1.35) | 0.214 |
| mRS at discharge, median [IQR] | 2 [1–3] | 3 [2–4] | ||||||
| mRS at discharge, categories, % (n) | <0.001c | <0.001 | <0.001 | |||||
| 0–1 | 32.5 (275) | 17.4 (34) | 1 | 1 | 1 | |||
| 2–3 | 45.8 (388) | 37.4 (73) | 0.66 (0.43–1.02) | 0.059 | 0.88 (0.55–1.44) | 0.614 | 0.89 (0.58–1.38) | 0.610 |
| 4–5 | 21.7 (184) | 45.1 (88) | 0.26 (0.17–0.40) | <0.001 | 0.35 (0.21–0.57) | <0.001 | 0.37 (0.24–0.59) | <0.001 |
| Intravenous thrombolysis, % (n) | 15.0 (127) | 15.5 (30) | 0.96 (0.62–1.48) | 0.847 | – | – | – | – |
| Carotid endarterectomy, % (n) | 0.8 (7) | 3.1 (6) | 0.26 (0.09–0.79) | 0.017 | 0.18 (0.06–0.62) | 0.006 | 0.17 (0.02–1.25) | 0.094 |
| Endovascular thrombectomy, % (n) | 6.9 (58) | 10.8 (21) | 0.61 (0.36–1.03) | 0.065 | 1.42 (0.74–2.71) | 0.288 | 1.39 (0.80–2.40) | 0.239 |
| In-hospital stay (days), median [IQR] | 5 [4–8] | 6 [4–9] | 0.95 (0.92–0.98)b | 0.002 | 1.01 (0.97–1.05) | 0.578 | 1.01 (0.98–1.05) | 0.512 |
| AF type, % (n) | 0.758c | – | – | – | – | |||
| First episode of AF in hospital | 26.8 (227) | 29.7 (58) | 1 | |||||
| Paroxysmal AF before index stroke | 33.5 (284) | 31.8 (62) | 1.17 (0.79–1.74) | 0.439 | ||||
| Non-paroxysmal AF before index stroke | 37.9 (321) | 37.4 (73) | 1.12 (0.77–1.65) | 0.553 | ||||
| Unknown AF type before index stroke | 1.8 (15) | 1.0 (2) | 1.92 (0.43–8.62) | 0.396 | ||||
| Cardiovascular risk factors, % (n) | ||||||||
| Prior stroke or Transient ischaemic attack | 29.2 (247) | 19.0 (37) | 1.76 (1.19–2.59) | 0.004 | 1.64 (1.08–2.48) | 0.020 | 1.64 (1.19–2.27) | 0.003 |
| Hypertension | 87.4 (740) | 87.4 (167) | 1.16 (0.74–1.82) | 0.518 | – | – | – | – |
| Heart failure | 14.3 (121) | 16.4 (32) | 0.85 (0.56–1.30) | 0.450 | – | – | – | – |
| Diabetes | 28.2 (242) | 28.6 (55) | 1.02 (0.72–1.44) | 0.919 | – | – | – | – |
| Vascular disease | 28.0 (237) | 31.3 (61) | 0.85 (0.61–1.20) | 0.358 | – | – | – | – |
| Renal impairment (eGFR <90 mL/min) | 91.1 (772) | 89.2 (174) | 0.83 (0.50–1.39) | 0.411 | – | – | – | – |
| CHA2DS2-VASc after stroke, median [IQR] | 6 [5–6] | 6 [5–7] | – | – | – | – | ||
| CHA2DS2-VASc after stroke, categories, % (n) | ||||||||
| 2–3 | 7.2 (61) | 6.2 (12) | 1 | |||||
| ≥4 | 92.8 (786) | 93.8 (183) | 0.85 (0.45–1.60) | 0.606 | ||||
| HAS-BLEDa after stroke, median [IQR] | 3 [3–4] | 3 [3–4] | – | – | – | – | ||
| HAS-BLED after stroke, categories, % (n) | 0.163c | |||||||
| 0–2 | 17.0 (144) | 12.8 (25) | 1 | |||||
| 3–6 | 83.0 (703) | 87.2 (170) | 0.69 (0.44–1.09) | 0.115 | ||||
| Medication on hospital admission, % (n) | <0.001c | <0.001 | <0.001 | |||||
| No antithrombotic medication | 26.7 (226) | 32.8 (64) | 1 | 1 | 1 | |||
| Heparin, therapeutic dose | 1.1 (9) | 2.1 (4) | 0.64 (0.19–2.14) | 0.465 | 0.49 (0.14–1.73) | 0.270 | 0.50 (0.08–3.11) | 0.457 |
| NOAC or VKA | 49.5 (419) | 28.2 (55) | 2.16 (1.45–3.20) | <0.001 | 1.77 (1.16–2.70) | 0.008 | 1.70 (1.10–2.63) | 0.017 |
| Antiplatelet(s) | 22.8 (193) | 36.9 (72) | 0.76 (0.52–1.12) | 0.163 | 0.69 (0.46–1.03) | 0.071 | 0.67 (0.43–1.05) | 0.079 |
AF, atrial fibrillation; CI, confidence interval; eGFR, estimated glomerular filtration rate; IQR, interquartile range; mRS, Modified Rankin Scale score; NIHSS, National Institutes of Health Stroke Scale; NOAC, non-vitamin K-dependent oral anticoagulant; OR, odds ratio; VKA, vitamin K antagonist.
‘Labile INR’ according to the treating physician.
Per day in hospital.
These P-values refer to the overall P-value of the respective categorical variable.
Antithrombotic medication on hospital discharge is shown in column B of Figure 2 for all 757 study patients with known AF and CHA2DS2-VASc ≥1 before the index stroke. While the proportion of patients prescribed a NOAC more than doubled compared to antithrombotic medication on admission, the proportion of patients prescribed a VKA or an antiplatelet was about halved. At discharge, less than 6% of all patients with known AF had no antithrombotic medication at all.
Impact factors on non-vitamin K-dependent oral anticoagulant prescription at hospital discharge after the index stroke
Of the 847 patients prescribed OAC at hospital discharge, 137 (16.2%) received a VKA and 710 (83.8%) received a NOAC (Table 5). An index TIA [OR 0.56 (95% CI 0.34–0.94) in comparison with an index stroke], co-existing heart failure [OR 0.49 (95% CI 0.26–0.93)], endovascular thrombectomy on admission [OR 12.9 (95% CI 1.59–104)], and medication on hospital admission were associated with NOAC prescription at discharge. Compared to patients with no antithrombotic medication on admission, patients prescribed a NOAC at the time of stroke/TIA had a significantly higher chance of NOAC prescription at discharge [OR 15.6 (95% CI 1.97–122)], while patients prescribed a VKA at the time of stroke/TIA had a significantly lower chance of NOAC prescription at discharge [OR 0.04 (95% CI 0.02–0.09)]. Patients’ age, sex, AF type, or known risk factors including prior stroke or TIA had no significant impact on prescription of NOAC on hospital discharge. These results were consistent with those gained from a sensitivity analysis adjusting for enrolling study sites (Table 5).
Characteristics of 847 AF patients prescribed a NOAC or VKA at hospital discharge after the index stroke
| Univariable analysis | Multivariable analysis with backward selection | Multivariable analysis adjusting for study site | |||||||
|---|---|---|---|---|---|---|---|---|---|
| NOAC | VKA | OR (CI) | P-value | OR (CI) | P-value | OR (CI) | P-value | ||
| n = 710 | n = 137 | ||||||||
| Age categories, years, % (n) | 0.272b | – | – | – | – | ||||
| 18–64 | 12.1 (86) | 6.6 (9) | 1 | ||||||
| 65–74 | 23.9 (170) | 24.1 (33) | 0.54 (0.25–1.18) | 0.121 | |||||
| 75–84 | 45.2 (321) | 51.1 (70) | 0.48 (0.23–1.00) | 0.050 | |||||
| ≥ 85 | 18.7 (133) | 18.2 (25) | 0.56 (0.25–1.25) | 0.156 | |||||
| Sex, % (n) | – | – | – | – | |||||
| Male | 51.3 (364) | 54.0 (74) | 1 | ||||||
| Female | 48.7 (346) | 46.0 (63) | 0.90 (0.62–1.29) | 0.556 | – | – | – | – | |
| Index stroke, % (n) | |||||||||
| Ischaemic stroke | 74.6 (530) | 59.9 (82) | 1 | 1 | 1 | ||||
| Transient ischaemic attack (TIA) | 25.4 (180) | 40.1 (55) | 0.51 (0.35–0.74) | <0.001 | 0.56 (0.34–0.94) | 0.027 | 0.52 (0.30–0.90) | 0.019 | |
| NIHSS on admission, median [IQR] | 2 [1–5] | 2 [0–4] | |||||||
| NIHSS on admission, categories, % (n) | 0.046b | 0.451 | 0.325 | ||||||
| 0–3 | 63.9 (454) | 73.7 (101) | 1 | 1 | 1 | ||||
| 4–7 | 22.8 (162) | 19.7 (27) | 1.34 (0.84–2.12) | 0.219 | 1.21 (0.65–2.27) | 0.552 | 1.23 (0.57–2.63) | 0.600 | |
| ≥8 | 13.2 (94) | 6.6 (9) | 2.32 (1.13–4.76) | 0.021 | 0.62 (0.23–1.66) | 0.346 | 0.65 (0.24–1.76) | 0.398 | |
| mRS at hospital discharge, median [IQR] | 2 [1–3] | 2 [1–3] | |||||||
| mRS at discharge, categories, % (n) | 0.210b | – | – | – | – | ||||
| 0–1 | 31.8 (226) | 35.8 (49) | 1 | ||||||
| 2–3 | 45.4 (322) | 48.2 (66) | 1.06 (0.70–1.59) | 0.787 | |||||
| 4–5 | 22.8 (162) | 16.1 (22) | 1.60 (0.93–2.75) | 0.091 | |||||
| Intravenous thrombolysis, % (n) | 16.3 (116) | 8.0 (11) | 2.24 (1.17–4.27) | 0.015 | 0.89 (0.37–2.15) | 0.792 | 0.89 (0.36–2.20) | 0.793 | |
| Carotid endarterectomy, % (n) | 0.7 (5) | 1.5 (2) | 0.48 (0.09–2.49) | 0.382 | – | – | – | – | |
| Endovascular thrombectomy, % (n) | 8.0 (57) | 0.7 (1) | 11.9 (1.63–86.6) | 0.015 | 12.9 (1.59–104) | 0.017 | 19.4 (2.69–139) | 0.003 | |
| In-hospital stay (days), median [IQR] | 5 [4–8] | 4 [3–7] | 1.05 (1.00–1.11) | 0.064 | 0.96 (0.89–1.03) | 0.281 | 0.96 (0.85–1.08) | 0.474 | |
| AF type, % (n) | <0.001b | 0.143 | 0.003 | ||||||
| First episode of AF in hospital | 30.7 (218) | 6.6 (9) | 1 | 1 | 1 | ||||
| Paroxysmal AF before index stroke | 31.7 (225) | 43.1 (59) | 0.16 (0.08–0.33) | <0.001 | 0.47 (0.19–1.15) | 0.096 | 0.44 (0.18–1.06) | 0.068 | |
| Non-paroxysmal AF before index stroke | 35.9 (255) | 48.2 (66) | 0.16 (0.08–0.33) | <0.001 | 0.69 (0.27–1.77) | 0.441 | 0.67 (0.23–2.00) | 0.461 | |
| Unknown AF type before index stroke | 1.7 (12) | 2.2 (3) | 0.17 (0.04–0.69) | 0.014 | 1.55 (0.26–9.33) | 0.633 | 1.60 (0.51–5.03) | 0.422 | |
| Cardiovascular risk factors, % (n) | |||||||||
| Prior stroke or transient ischaemic attackc | 30.0 (213) | 24.8 (34) | 1.30 (0.85–1.98) | 0.223 | |||||
| Hypertension | 86.1 (611) | 94.2 (129) | 0.38 (0.18–0.81) | 0.012 | 0.71 (0.27–1.83) | 0.474 | 0.80 (0.33–1.92) | 0.613 | |
| Heart Failure | 13.0 (92) | 21.2 (29) | 0.55 (0.35–0.88) | 0.013 | 0.49 (0.26–0.93) | 0.029 | 0.50 (0.27–0.93) | 0.030 | |
| Diabetes | 27.3 (194) | 35.0 (48) | 0.70 (0.47–1.03) | 0.068 | 0.88 (0.52–1.50) | 0.879 | 0.88 (0.61–1.27) | 0.493 | |
| Vascular disease | 27.0 (192) | 32.8 (45) | 0.76 (0.51–1.12) | 0.167 | – | – | – | ||
| Renal impairment (eGFR <90 mL/min) | 90.6 (643) | 94.2 (129) | 1.68 (0.79–3.58) | 0.179 | |||||
| CHA2DS2-VASc after stroke, median [IQR] | 6 [5–6] | 6 [5–7] | |||||||
| CHA2DS2-VASc after stroke, categories, % (n) | |||||||||
| 2–3 | 7.9 (56) | 3.6 (5) | 1 | 1 | 1 | ||||
| ≥4 | 92.1 (654) | 96.4 (132) | 0.44 (0.17–1.13) | 0.087 | 0.99 (0.30–3.31) | 0.993 | 0.85 (0.20–3.67) | 0.824 | |
| HAS-BLEDa after stroke, median [IQR] | 3 [3–4] | 3 [3–4] | 0.04 | – | – | – | – | ||
| HAS-BLED after stroke, categories, % (n) | |||||||||
| 0–2 | 18.6 (132) | 8.8 (12) | 1 | 1 | 1 | ||||
| 3–6 | 81.4 (578) | 91.2 (125) | 0.42 (0.23–0.78) | 0.006 | 0.88 (0.32–2.41) | 0.806 | 0.85 (0.20–3.67) | 0.824 | |
| Medication on admission, % (n) | <0.001 | <0.001 | <0.001 | ||||||
| No antithrombotic medication | 30.3% (215) | 8.0% (11) | 1 | 1 | 1 | ||||
| Heparin, therapeutic dose | 1.0% (7) | 1.5% (2) | 0.18 (0.03–0.97) | 0.045 | 0.24 (0.04–1.33) | 0.102 | 0.31 (0.03–3.20) | 0.324 | |
| VKA | 11.8% (84) | 81.0% (111) | 0.04 (0.02–0.08) | <0.001 | 0.04 (0.02–0.09) | <0.001 | 0.06 (0.03–0.12) | <0.001 | |
| NOAC | 31.4% (223) | 0.7% (1) | 11.41 (1.46–89.1) | 0.02 | 15.6 (1.97–122) | 0.009 | 21.3 (2.49–181.7) | 0.005 | |
| Antiplatelet(s) | 25.5% (181) | 8.8% (12) | 0.77 (0.33–1.79) | 0.546 | 0.89 (0.38–2.08) | 0.779 | 1.10 (0.48–2.50) | 0.822 | |
| First episode of AF (n = 227), % (n) | – | – | – | – | |||||
| No antithrombotic medication | 63.8 (139) | 55.6 (5) | 1 | ||||||
| Antiplatelet(s), % (n) | 35.3 (77) | 44.4 (4) | 0.68 (0.18–2.62) | 0.578 | |||||
| Known AF before admission (n = 620), % (n) | <0.001b | – | – | – | – | ||||
| No antithrombotic medication | 15.4 (76) | 4.7 (6) | 1 | ||||||
| Heparin, therapeutic dose | 1.4 (7) | 1.6 (2) | 0.28 (0.05–1.64) | 0.156 | |||||
| VKA | 16.9 (83) | 86.7 (111) | 0.06 (0.03–0.14) | <0.001 | |||||
| NOAC | 45.1 (222) | 0.8 (1) | 17.5 (2.08–147.9) | 0.009 | |||||
| Antiplatelet(s) | 21.1 (104) | 6.3 (8) | 1.03 (0.34–3.08) | 0.963 | |||||
AF, atrial fibrillation; CI, confidence interval; eGFR, estimated glomerular filtration rate; IQR, interquartile range; mRS, Modified Rankin Scale score; NIHSS, National Institutes of Health Stroke Scale; NOAC, non-vitamin K-dependent oral anticoagulant; OR, odds ratio; TIA, transient ischaemic attack; VKA, vitamin K antagonist.
‘Labile INR’ according to the treating physician.
These P-values refer to the overall P-value of the respective categorical variable.
Discussion
The Berlin Atrial Fibrillation Registry is an investigator-initiated prospective multicentre cohort study gathering comprehensive data on (secondary) stroke prevention in AF patients in an unselected urban population in Germany. The baseline data of the registry indicate that about 60% of all patients with known AF and an at least moderate stroke risk were anticoagulated at the time of the index stroke (Figure 1). At hospital discharge after ischaemic stroke or TIA, more than 80% of all registry patients were anticoagulated and about 80% of those were prescribed a NOAC (Tables 4and5). These percentages are slightly higher than a retrospective analysis of quality assurance data in the federal state of Hesse, Germany in 2015 or in a retrospective cohort study of Danish AF patients in 2004–2007.9,10
While prescription of OAC at the time of stroke or TIA in registry patients with known AF was associated with prior stroke or TIA, diabetes, and old age (Table 3), there was no association with other items of the CHA2DS2-VASc score like heart failure, hypertension, vascular disease, or sex. In comparison, a retrospective study from Korea reported an association of OAC at the time of stroke with prior stroke but also with younger age, higher CHADS2 score and heart failure according univariate analyis.16 Of those with VKA on admission (n = 229), 105 (46%) had an INR within therapeutic range. These findings indicate that the quality of anticoagulation in our patient cohort is higher than in studies reported previously.17,18 However, we cannot comment on the quality of OAC in registry patients prescribed a VKA within weeks before the index stroke/TIA, as previous INR values were not assessed. Moreover, we have no detailed information on the intake of a prescribed NOAC before the index stroke/TIA, as coagulation tests assessing thrombin-clotting time or the present anti-Xa activity was not part of clinical routine on admission. In 275 of registry patients, no anticoagulation was prescribed immediately before hospital admission. In 54% of these patients, anticoagulation was initiated but stopped before the index stroke or TIA. A specific reason for stopping anticoagulation was not provided in the vast majority of these patients.
At hospital discharge (median 6 days after the index stroke), patients with prior stroke or TIA and patients with an index TIA (using an index ischaemic stroke as reference) had higher probability of prescription of OAC. This may be due to the fact that the assumed intracranial bleeding risk in TIA patients is lower compared to patients with ischaemic stroke.7 Moreover, patients with severe neurological handicap or carotid endarterectomy had a lower probability of OAC prescription (Table 4). Previous studies in German patients with a medical history of stroke before the approval of the NOACs showed an inverse relationship between patients’ age and OAC prescription.19 However, we did not observe a statistical significant association between the a priori defined age categories and OAC prescription in patients with acute stroke in our dataset which might also be caused by the limited statistical power. We assume, that the observed differences correspond to the increased awareness regarding medical stroke prevention after the index stroke. Furthermore, general practitioners mainly prescribed medical stroke prevention before the index stroke and a neurologist prescribed medical stroke prevention at hospital discharge. The observed 80% rate of OAC at hospital discharge is higher compared to smaller single-centre cohort studies, reporting an OAC rate of 55–70% in the NOAC era or 38–58% in the pre-NOAC era.20–23
Underpinned by the baseline data of the Berlin Atrial Fibrillation Registry, prescription of a NOAC after stroke seems to be standard nowadays as also found in other studies.8,9 In registry patients with known AF before enrolment the proportion of patients prescribed a NOAC more than doubled at hospital discharge compared to baseline (Figure 2). Interestingly, patients with intake of the VKA phenprocoumon at the time of the index stroke were discharged on phenprocoumon in about half of all cases (Figure 2, Supplementary material online, Table SIV). In addition, the probability to prescribe a VKA (and not a NOAC) was higher in patients with heart failure. Once again, patients’ age or AF type had no impact on NOAC prescription. The magnitude of the observed impact factors on OAC (Table 4) or NOAC prescription (Table 5) was consistent after adjusting for the recruiting study sites.
Limitations
Besides the reported strength, the present analysis has limitations. First, providing informed consent by the patient implies a selection bias towards patients with less severe stroke. Moreover, the Berlin Atrial Fibrillation registry cohort is younger and had a slightly higher proportion of pre-stroke OAC compared to a retrospective analysis of non-selected AF patients with acute ischaemic stroke in the Berlin area.24 Secondly, we cannot exclude that undocumented factors have influenced the physicians’ choice of medical stroke prevention in an individual patient pre-stroke.
Conclusion
The prospective multicentre Berlin Atrial Fibrillation Registry provides a representative evaluation of OAC use for (secondary) stroke prevention in AF patients in a defined urban region in Germany. Our results clearly demonstrate that OAC prescription is very common within days after acute ischaemic stroke or TIA. In the majority of anticoagulated stroke patients with AF a NOAC was used instead of the VKA phenprocoumon. In line with guideline recommendations, OAC prescription after stroke was independent of patients’ age or AF type.
Acknowledgements
We thank all members of the study sites and of the study coordinating office (see Supplementary material online, Tables SI and SII for details). Moreover, we thank Julia Herde (CSB, Berlin; Germany) for critically revising the manuscript. We thank Petra Dem, Michael Krämer, and Larissa Pfeiler for their substantial work at the study coordinating office.
Funding
This work was supported by an unrestricted research grant from Bayer Vital GmbH, Germany. The authors are solely responsible for the design and conduct of this registry, all analyses, the drafting and editing of the paper and its final contents.
Conflict of interest: K.G.H. reports study grants by Bayer and Sanofi-Aventis, lecture fees/advisory board fees from Sanofi-Aventis, Pfizer, Bristol-Myers-Squibb, Boehringer Ingelheim, Daiichi Sankyo, Biotronik, W. L. Gore & Associates, Edwards Lifesciences and Medtronic. S.T. reports lecture fees by Boehringer Ingelheim. C.M., J.H., B.D., M.Eb., G.J.J., G.H., F.H., J.S., B.S., R.S., M.v.B, and J.D. report no conflicts of interest. S.W. reports research grants by the BMBF and Deutsche Herzstiftung e.V. M.H. received travel support by Bayer Healthcare and Boehringer Ingelheim. C.L. reports lecture fees from Bard Medical and advisory board fees from Edwards Lifesciences. C.K. reports lecture fees from UCB and travel support from Daiichi Sankyo. BMM reports lecture fees by Boehringer Ingelheim, Bayer, Pfizer and Daiichi Sankyo. FM received fees for lectures and participation in advisary boards from Bayer Healthcare, Bristol-Myers Squibb, Daiichi Sankyo, MSD and Sanofi. D.G.N. reports honoraries for lectures and advisory activities by Astra Zeneca, Bayer Healthcare, Boheringer Ingelheim, Bristol-Myers-Squibb, Daiichi Sankyo, Pfizer, Sanofi, and Medtronic. A.R. received honoraria for travel or lectures from Bayer and Ever Pharma. I.S. received lecture fees by Boehringer Ingelheim and Daiichi-Sankyo. P.S. reports lecture fees/advisory board fees and/or travel support by Bayer, Boehringer Ingelheim, Bristol-Myers-Squibb, Pfizer, Daiichi-Sankyo, and UCB. E.V. reports that his unmarried partner works for Pfizer. P.U.H. reports grants from German Ministry of Research and Education, German Research Foundation, European Union, Federal Joint Committee (G-BA) within the Innovationfond, Charité–Universitätsmedizin Berlin, Berlin Chamber of Physicians, German Parkinson Society, University Hospital Würzburg, Robert Koch Institute, German Heart Foundation, University Göttingen (within FIND-AF randomized, supported by an unrestricted research grant to the University Göttingen from Boehringer-Ingelheim), University Hospital Heidelberg (within RASUNOA-prime, supported by an unrestricted research grant to the University Hospital Heidelberg from Bayer, BMS, Boehringer-Ingelheim, Daiichi Sankyo), grants from Charité–Universitätsmedizin Berlin (within Mondafis, supported by an unrestricted research grant to the Charité from Bayer), outside the submitted work. M.E. reports grant support and/or fees paid to the Charité from Bayer, Boehringer Ingelheim, Bristol-Myers-Squibb, Pfizer, Daiichi Sankyo, Amgen, Sanofi, Covidien GSK, Ever, Novartis, all outside the submitted work.
References
Arbeitsgemeinschaft der Wissenschaftlichen Medizinischen Fachgesellschaften (AWMF): S3-Leitlinie Sekundärprophylaxe ischämischer Schlaganfall und transitorische ischämische Attacke. http://www.awmf.org/leitlinien/detail/ll/030-133.html (31 January 2015, date last accessed).
Author notes
Karl Georg Haeusler, Serdar Tütüncü, Peter U. Heuschmann and Matthias Endres authors contributed equally to the study.
