


Background: Left atrial appendage (LAA) stunning occurs after spontaneous conversion of atrial fibrillation (AF) to sinus rhythm. Previous studies using prolonged ECG monitoring showed an elevated rate of silent AF as the aetiology of cryptogenic stroke.
Objective: To evaluate if the presence of LAA stunning assessed by transoesophageal echocardiogram (TEE) predicts the occurrence of AF after ischemic stroke.
Methods: We retrospectively studied patients who had a TEE performed in the first 30 days after an ischemic stroke, between 2010 and 2014. Patients were excluded if they had AF previously to or at admission, or known causes of cardioembolic stroke at the TEE. We evaluated the LAA peak velocity (LAAV), LAA area (LAAA), and left atrial volume (LAV). A 24h Holter monitoring was performed during admission, the presence and number of premature atrial contractions (PACs) and runs of PACs was assessed. Patients were followed in an outpatient clinic and the occurrence of AF or death was registered.
Results: We studied 73 consecutive patients out of 123. The baseline patient characteristics are depicted in Table. The mean follow-up period was 1635 ± 627 days, 8 patients developed AF, and 7 patients died. Patients with AF occurrence had lower LAAVs than those without AF occurrence (p=0.004). The ROC curve analysis revealed that the best cut-off value of the LAAV for the prediction of AF occurrence was 46.5 cm/s (AUC 0.796, p=0.007). The two groups with the lower LAAV (≤46.5 cm/s) and higher LAAV (>46.5 cm/s) did not differ significantly except for the gender (Table). However, in a multivariable Cox regression analysis including age, gender and LAAV, only a LAAV ≤46.5 cm/s was associated with the occurrence of AF (p=0.002). A Kaplan–Meier analysis demonstrated a lower survival rate free from AF occurrence in the low LAAV group (mean of 55 months) than in the high LAAV group (mean of 83 months) (Log-rank, p<0.001) (Figure).
Conclusion: A low LAAV was associated with AF occurrence after an initial episode of cryptogenic stroke. Patients with lower LAAV could eventually benefit from long term cardiac rhythm monitoring.
Patients characteristics
| Total(n=73) | LAAV ≤ 46.5 cm/s(n=9) | LAAV > 46.5 cm/s(n=64) | p-value | |
|---|---|---|---|---|
| Age in years, mean (SD) | 54.3 (13.7) | 63.0 (48.0 - 72.0) | 50.0 (43.5 - 64.0) | 0.140 |
| Males, n (%) | 42 (56) | 2 (22) | 40 (63) | 0.032 |
| LAAA in cm2, median (IQR) | 2.95 (2.25 - 3.70) | 2.6 (2.1 - 4.1) | 3.0 (2.3 - 3.7) | 0.699 |
| PACs per day (24h Holter), median (IQR) | 7.0 (2.0 - 38.0) | 33.0 (1.0 - 60.0) | 7.0 (2.0 - 22.0) | 0.378 |
| Runs of PACs per day (24h Holter), mean (SD) | 0.37 (1.04) | 0.63 (1.40) | 0.33 (0.99) | 0.460 |
| LAV in mL/m2, median (IQR) | 27.9 (21.8 - 30.8) | 27.0 (23.7 - 41.9) | 27.9 (21.3 - 30.8) | 0.732 |
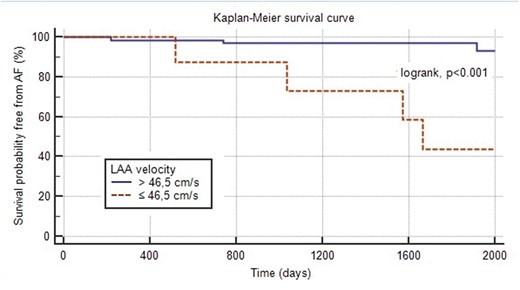
Abstract 677 Figure. Survival free from AF
