


Abstract
To determine the frequency of implantable cardioverter defibrillator (ICD) therapy following cardiac resynchronization therapy (CRT-D) implantation in super and non-super responders and whether greater improvement in left ventricular (LV) function after CRT is associated with a reduced burden in ICD therapy.
This is a two-centre, retrospective study between January 2002 and September 2011. Patients were classified as non-super responders and super-responders based on the post-CRT ejection fraction (EF) of < 50% and ≥50%, respectively. Of 629 recipients of CRT-D, 37 (5.9%) were super-responders. Implantable cardioverter defibrillator follow-up was available for a mean duration of 6.2 ± 2.7 years. The 5-year rate of antitachycardia pacing (ATP) in super-responders was significantly lower than in non-super responders (2.7% vs. 22.1%, P = 0.004). Super-responders also had a lower 5-year rate of appropriate ICD shock compared with non-super responders (2.7% vs. 14.3%, P = 0.03). On multivariable analysis, factors associated with appropriate ICD therapy (ICD shock/ATP) include male gender (hazard ratio, HR 1.97, 95% confidence interval, 95% CI 1.15–3.35), secondary prevention indication (HR 2.09, 95% CI 1.13–3.85), increased baseline LV end-systolic diameter (HR 1.03 per mm, 95% CI 1.01–1.06) and higher baseline EF (HR 1.03 per %, 95% CI 1.00–1.06) while super-responder status was highly protective (HR 0.13, 95% CI 0.02–0.91).
Recipients of CRT-D that normalize their EF have very low rates of ventricular arrhythmias requiring appropriate ICD therapy compared with those that do not.
Recipients of cardiac resynchronization therapy (CRT-D) that normalize their ejection fraction have very low rates of VA requiring appropriate implantable cardioverter defibrillator (ICD) therapy compared with those that do not.
Male gender, higher baseline LV end-systolic diameter and secondary prevention indication were associated with an increased risk of ICD therapy.
Introduction
Cardiac resynchronization therapy (CRT) has been established as one of the most beneficial therapies in the management of symptomatic heart failure (HF) despite optimal medical therapy.1,2 Following CRT however, there is variability in the degree of benefit. Approximately one-third do not derive benefit, and have progression of HF, while some improve so much as to regain near-normal or normal cardiac function and diameters. This latter group, commonly referred to as ‘super-responders’ and seen in approximately 10–25% of CRT recipients, has been shown to derive survival benefit equivalent to that of normal controls.3–5 Furthermore, they are felt to possibly represent a group with low risk of sudden cardiac death that would no longer meet current implantable cardioverter defibrillator (ICD) indications. Unnecessary ICD capability of CRT devices is expensive and may lead to inappropriate ICD shocks with associated morbidity and mortality.6 Naturally, the question that is being asked is whether super-responders continue to require ICD functionality (CRT-D) or whether a CRT-pacemaker (CRT-P) will suffice at the time of elective device replacement. Indeed, the 2013 US joint committee’s appropriate use criteria guideline states that in patients with CRT-D and ejection fraction (EF) ≥50% at the time of elective replacement, it is appropriate to replace with a CRT-D (appropriate use criteria score 7 [9 is deemed most appropriate and 1 is deemed most inappropriate]), but may be appropriate to downgrade to CRT-P (appropriate use criteria score 6).7
We, therefore, aimed to determine the frequency of ICD therapy following CRT-D implantation in super and non-super responders and whether greater improvement in left ventricular (LV) function after CRT is associated with a reduced burden of ICD therapy.
Methods
Patient population
This is a two-centre (Mayo Clinic, Rochester, MN, USA and Sheba Medical Center, Tel Hashomer, Israel), retrospective study that included recipients of CRT-D between January 2002 and September 2011. Only echocardiograms obtained ≥2 months after implantation were used for the definition of response. We intentionally used a strict definition of super-response (being normalization of EF) to minimize risk of lowering the specificity of super-responder status on ICD therapy rates. We did not enrol patients that had deactivation of their LV lead. The Institutional Review Board of each centre approved the protocol, and all patients consenting to use of their records for research were included in the study. Clinical information documented as part of routine clinical care was collected from electronic medical records.
Echocardiography
Echocardiography parameters recorded included left ventricular (LV) ejection fraction (LVEF) (calculated using the modified Quinone's formula or where possible, modified Simpson’s formula), LV end-diastolic diameter (LVEDD) (measured with M-mode or 2D echocardiography), LV end-systolic diameter (LVESD), LV end-diastolic volume (LVEDV) (calculated using the Teichholz formula), LV end-systolic volume (LVESV) (calculated using the Teichholz formula), pulmonary artery systolic pressure (PASP, estimated from the tricuspid regurgitant velocity and an estimate of right atrial pressures), and mitral valve regurgitation (MR) grade (0, none; 1, trivial/mild; 2, moderate; 3, severe) (based on jet characteristics and/or PISA method), and right ventricular (RV) dysfunction (semi-quantitative grading scale: 0, normal; 0.5, borderline; 1, mild; 1.5, mild-moderate; 2, moderate; 2.5, moderate-severe; 3, severe dysfunction). Intraventricular dys-synchrony was not routinely measured during the study period. Pre-implant echo data were collected within 12 months prior to the CRT implant. In order to be included in the study, all patients must have had an echocardiogram between 2 and 24 months following CRT implantation. Echocardiographic data were entered into the patient’s medical record as part of routine clinical practice. For the purposes of our study, echocardiographic data were retrospectively collected from the electronic medical record and entered into our study database.
Cardiac resynchronization therapy
Device implantation was performed under conscious sedation and local anaesthetic as standard clinical practice. Commercially available devices were used. The position of the LV lead was prioritized as lateral/postero-lateral whenever possible as dictated by pacing thresholds, diaphragmatic stimulation, and ability to cannulate the veins.
Implantable cardioverter defibrillator programming
Devices were programmed to monitor plus therapy. ICD secondary prevention settings were individualized according to primary cardiologist preference. Between 2002 and 2010, primary prevention settings were as follows: detection rate was 185 bpm (8 out of 10 beats with addition of sustained duration of 1 s) for Boston Scientific devices and 188 bpm for Medtronic (duration 18/24 intervals) and St Jude (duration 12 beats) devices. In 2011, the detection rate only was changed and was increased to 200 bpm for all three manufactures. Therapy was programmed to one cycle of antitachycardia pacing (ATP) during ICD capacitor charge, followed by shock delivery.
Clinical follow-up
Following implantation, patients underwent telephone interview at 30 days and clinical review was typically at 3 months. Thereafter, remote follow-ups were performed every 3 months. In-office follow-up was at the discretion of the care provider. The device was interrogated to ensure normal function. Electrogram review, where indicated, was performed by a trained device nurse and cardiac electrophysiologist who were unaware of the patient group classification. The event rate of appropriate and inappropriate ICD therapy for VT/VF was collected. Cardiac transplantation and survival information was obtained from the electronic medical records and the national death and location database. No routine AV and VV optimization was performed.
Definition of response
Patients were classified as non-super responders and super-responders based on the post-CRT EF of <50% and ≥50%, respectively.
Definition of implantable cardioverter defibrillator therapy
Therapy was deemed appropriate if it was delivered for VT/VF and inappropriate if delivered for other reasons. We compared the occurrence of any (rather than the total number of) ICD therapy between the two groups.
Outcomes
The primary outcome was rate of appropriate ICD therapy (shock and ATP) as defined above. The secondary outcome was mortality.
Statistical analysis
Landmark analysis was performed in which only patients with post-CRT echocardiograms obtained ≥2 months after implantations were included. Normality of individual continuous variables was assessed using the Shapiro–Wilks test. Comparisons between the groups with respect to continuous variables were completed with Wilcoxon rank-sum tests. Paired comparisons were completed using Wilcoxon signed-rank tests. Means, standard deviations, and medians are provided in the tables. Categorical variables were compared using the χ2 test for independence. Mortality was estimated in these populations using the standard Kaplan–Meier method. Other follow-up endpoints such as ATP, appropriate shock, and inappropriate shock were estimated using mortality as a competing risk. The cumulative probabilities of these events were compared between groups using log-rank tests for mortality. Fine and Gray methods were used to compare the therapy endpoints. Potential risk factors for these endpoints were evaluated using Cox-proportional hazards models. The proportional hazards assumption was assessed for the individual variables and was found to be satisfied. P < 0.05 was considered statistically significant. Analyses were completed using SAS version 9.4.
Results
Patient baseline characteristics
Baseline characteristics are outlined in Table 1. During the study period, there were 629 CRT-D recipients. The average time from CRT implantation to post-CRT echo was 9.2 ± 3.7 months; 37 (5.8%) were super-responders. Super-responders, as compared with non-super responders, were more likely to be female (49% vs. 20%), have DCM (73% vs. 40%), higher baseline EF (27.7% vs. 23.5%), smaller LV diameters, less RV dysfunction, and lower PASP. In addition, super-responders had higher frequency of a paced rhythm, lower frequency of interventricular conduction delay and lower creatinine, NYHA class and LVESV. There was no difference in left bundle branch block (LBBB) QRS morphology or device manufacturers between groups (P = 0.64). With regards to device programming, in the super-responder group 32% of the patients had rate cut-offs of 185 bpm and 68% had cut-offs of 188 bpm. In the non-super responder group, 42% of the patients had rate cut-offs of 185 bpm and 58% had cut-offs of 188 bpm (P = 0.38).
Baseline characteristics in CRT-D recipients (N = 629) according to responder status
| Variable | N | Non-super responders (N = 592) | Super- responders (N = 37) | P-value |
|---|---|---|---|---|
| Age at CRT implant | 629 | 67.0 ± 11.3 (69) | 67.1 ± 12.8 (71) | 0.59* |
| Primary indication | 629 | 558 (94%) | 35 (95%) | 0.93 |
| Gender, female, n (%) | 629 | 117 (20%) | 18 (49%) | <0.001 |
| DCM, n (%) | 628 | 239 (40%) | 27 (73%) | <0.001 |
| QRS morphology, n (%) | 621 | |||
| LBBB, n (%) | 621 | 269 (46%) | 21 (58%) | 0.15 |
| RBBB, n (%) | 621 | 51 (9%) | 0 (0%) | 0.06 |
| IVCD, n (%) | 621 | 96 (16%) | 1 (3%) | 0.028 |
| Paced, n (%) | 621 | 137 (23%) | 14 (39%) | 0.036 |
| Other, n (%) | 621 | 32 (5%) | 0 (0%) | 0.15 |
| Digoxin, n (%) | 622 | 280 (48%) | 13 (36%) | 0.17 |
| Beta blocker, n (%) | 623 | 530 (90%) | 35 (97%) | 0.16 |
| ACE-I/ARB, n (%) | 622 | 510 (87%) | 32 (89%) | 0.75 |
| Creatinine (mg/dL) | 612 | 1.4 ± 0.7 (1.3) | 1.3 ± 1.1 (1.1) | 0.001 |
| NYHA class | 625 | 3.0 ± 0.5 (3.0) | 2.8 ± 0.4 (3.0) | 0.037 |
| QRS duration (ms) | 619 | 163 ± 34 (162) | 166 ± 29 (158) | 0.98 |
| Ejection fraction (%) | 629 | 23.5 ± 7.2 (23) | 27.7 ± 7.3 (28) | <0.001 |
| LVEDD size (mm) | 573 | 66.2 ± 9.2 (65) | 61.4 ± 6.9 (61) | 0.002 |
| LVESD (mm) | 533 | 57.3 ± 10.3 (57) | 52.0 ± 8.3 (51) | 0.004 |
| LVEDV (mls) | 329 | 210 ± 73 (197) | 187 ± 59 (180) | 0.25 |
| LVESV (mls) | 326 | 159 ± 62 (149) | 129 ± 47 (122) | 0.047 |
| MR grade | 579 | 1.5 ± 0.9 (1.0) | 1.2 ± 0.8 (1.0) | 0.10 |
| RV dysfunction, grade | 521 | 1.1 ± 1.0 (1.0) | 0.5 ± 0.7 (0.0) | <0.001 |
| PASP (mmHg) | 546 | 47.5 ± 15.2 (47) | 39.5 ± 13.0 (34) | 0.002 |
Data expressed as mean ± standard deviation (median) unless stated otherwise.
ACE/ARB, ACE inhibitor/angiotensin receptor blocker; DCM, dilated cardiomyopathy; IVCD, intraventricular conduction delay; LBBB, left bundle branch block; LVEDD, left ventricular end-diastolic diameter; LVEDV, left ventricular end-diastolic volume; LVEF, left ventricular ejection fraction; LVESD, left ventricular end-systolic diameter; LVESV, left ventricular end-systolic volume; MR, mitral valve regurgitation; NYHA, New York Heart Association; PASP, pulmonary artery systolic pressure; RBBB, right bundle branch block; RV, right ventricular.
Structural changes
Following CRT-D implantation, both groups had significant improvement in EF, LVEDD, LVESD, and RV function. Non-super responders also had improvement in MR severity and PASP. Compared with non-super responders, super-responders had significantly greater improvement in NYHA class (−1.0 vs. −0.5), EF (27.6% vs. 5.3%), LVEDD (−8.0 mm vs. −1.7 mm), and LVESD (−14.8 mm vs. −3.1 mm) (Table 2).
Summary of variables pre- and post-CRT-D according to responder status
| Non-super responders | Super-responders | |||||||||
|---|---|---|---|---|---|---|---|---|---|---|
| N | Pre mean ± SD | Post mean ± SD | Change mean ± SD | Paired P | N | Pre mean ± SD | Post mean ± SD | Change mean ± SD | Paired P | |
| NYHA (class) | 502 | 3.02 ± 0.49 (3.0) | 2.53 ± 0.79 (3.0) | −0.49 ± 0.83 (0) | <0.001 | 30 | 2.83 ± 0.46 (3.0) | 1.80 ± 0.71 (2.0) | −1.03 ± 0.72# (1.0) | <0.001 |
| Ejection fraction (%) | 592 | 23.49 ± 7.224 (23.5) | 28.75 ± 9.66 (28.0) | 5.26 ± 9.54 (4.0) | <0.001 | 37 | 27.70 ± 7.25 (28.0) | 55.32 ± 4.91 (55.0) | 27.62 ± 9.15# (28.0) | <0.001 |
| LVEDD (mm) | 524 | 66.26 ± 8.82 (65.0) | 64.60 ± 9.26 (64.0) | −1.67 ± 6.38 (1.0) | <0.001 | 31 | 61.81 ± 6.83 (61.0) | 53.82 ± 6.33 (54.0) | −7.98 ± 7.56# (7.0) | <0.001 |
| LVESD (mm) | 447 | 57.28 ± 10.13 (57.0) | 54.18 ± 10.91 (53.5) | −3.10 ± 7.90 (2.0) | <0.001 | 28 | 51.57 ± 8.39 (50.0) | 36.79 ± 5.26 (37.0) | −14.79 ± 9.21# | <0.001 |
| MR (grade) | 538 | 1.46 ± 0.93 (1.0) | 1.22 ± 0.82 (1.0) | −0.24 ± 0.85 (0.0) | <0.001 | 34 | 1.21 ± 0.81 (1.0) | 1.06 ± 0.69 (1.0) | −0.15 ± 0.78 (0.0) | 0.61 |
| RV dysfunction (grade) | 447 | 1.15 ± 0.95 (1.0) | 1.03 ± 0.93 (1.0) | −0.12 ± 0.91 (0) | 0.011 | 27 | 0.54 ± 0.73 (0) | 0.13 ± 0.33 (0) | −0.41 ± 0.76 (0) | 0.010 |
| PASP (mmHg) | 492 | 47.63 ± 15.10 (47.0) | 43.12 ± 13.54 (41.0) | −4.50 ± 13.24 (4.0) | <0.001 | 31 | 39.45 ± 13.01 (34) | 36.32 ± 11.19 (32) | −3.13 ± 10.20 (1.0) | 0.23 |
Data expressed as mean ± standard deviation (median) unless stated otherwise.
LVEDD, left ventricular end-diastolic diameter; LVEDV, left ventricular end-diastolic volume; LVESD, left ventricular end-systolic diameter; LVESV, left ventricular end-systolic volume; MR, mitral valve regurgitation; NYHA, New York Heart Association; PASP, pulmonary artery systolic pressure; RV, right ventricular.
P < 0.05 compared with change in non-super-responders.
Implantable cardioverter defibrillator therapy
Antitachycardia pacing and appropriate implantable cardioverter defibrillator shock
Follow-up was available for a mean duration of 6.2 ± 2.7 years. Median follow-up duration after post-implant TTE was 5.4 years; minimal follow-up was 2 months. The 5-year rate of ATP in super-responders was significantly lower than in non-super responders (2.7% [95% confidence interval, (95% CI) 0–7.9%] vs. 22.1% [95% CI 18.6–25.6], P = 0.004). Super-responders also had a lower 5-year rate of appropriate ICD shock (2.7% [95% CI 0–7.9%] vs. 14.3% [95% CI 11.3–17.3%], P = 0.03) (Figure 1). Of note, there was no difference in the number of ablation procedures between super and non-super responders both pre- and post-CRT.
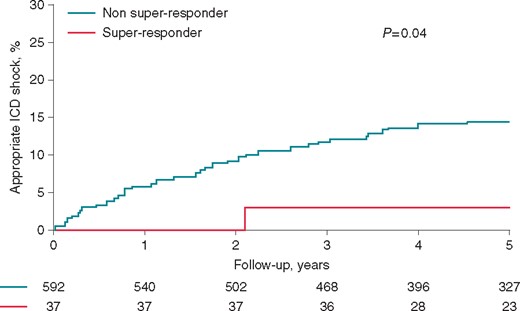
Rate of appropriate ICD shocks according to responder status.
Inappropriate implantable cardioverter defibrillator shock
There was no difference in the rate of inappropriate ICD shock overall. The 5-year rate of inappropriate ICD delivery was 7.0% (95% CI 0–18.3%) vs. 5.3% (95% CI 3.4–7.3%) (P = 0.46) in super and non-super responders, respectively (Figure 2).
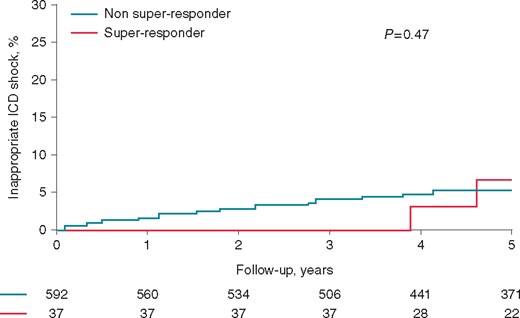
Rate of inappropriate ICD shocks according to responder status.
Factors associated with ICD therapy
Antitachycardia pacing
Univariate factors associated with ATP therapy included male gender (hazard ratio, HR 2.02, 95% CI 1.21–3.35), higher baseline LVEDD (HR 1.02 per mm, 95% CI 1.00–1.04) and secondary prevention indication (HR 2.54, 95% CI 1.48–4.35). Super-responders, however, were less likely to receive ATP (HR 0.11, 95% CI 0.02–0.75).
Appropriate implantable cardioverter defibrillator shock
Super-response status had a trend towards being protective in terms of appropriate ICD shocks only (HR 0.16, 95% CI 0.020–1.14). Otherwise, male gender (HR 2.68, 95% CI 1.35–5.33), higher baseline LVEDD (HR 1.04 per mm, 95% CI 1.02–1.06) and higher baseline LVESD (HR 1.03 per mm, 95% CI 1.01–1.05) were associated with increased risk of appropriate ICD shock.
Combined antitachycardia pacing/appropriate implantable cardioverter defibrillator shock
Univariate factors associated with appropriate ICD therapy (combined ATP/appropriate shock) are shown in Table 3 and include male gender, increased baseline LVESD and LVEDD, non-super responder status and secondary prevention indication. On multivariate analysis, factors associated with appropriate ICD therapy (ICD shock/ATP) include male gender (HR 1.97, 95% CI 1.15–3.35), secondary prevention indication (HR 2.09, 95% CI 1.13–3.85), increased baseline LVESD (HR 1.03 per mm, 95% CI 1.01–1.06) and higher baseline EF (HR 1.03 per %, 95% CI 1.00–1.06) while super-responder status was highly protective (HR 0.13, 95% CI 0.02–0.91).
Predictors of appropriate ICD therapy (shock and ATP)
| Variable | Univariate HR (95% CI) | P-value | Multivariate HR (95% CI) | P-value |
|---|---|---|---|---|
| Male gender | 2.15 (1.32, 3.48) | 0.002 | 1.97 (1.15, 3.35) | 0.01 |
| LVEDD (per mm) | 1.03 (1.01, 1.05) | 0.004 | ||
| LVESD (per mm) | 1.02 (1.01, 1.05) | 0.005 | 1.03 (1.01,1.06) | 0.002 |
| Age | 0.99 (0.98,1.00) | 0.06 | 0.99 (0.97,1.00) | 0.13 |
| DCM | 0.94 (0.68, 1.30) | 0.72 | 1.07 (0.73,1.57) | 0.73 |
| Digoxin | 1.33 (0.96, 1.83) | 0.08 | ||
| Beta blocker | 0.93 (0.55,1.58) | 0.79 | ||
| ACE-I/ARB | 0.98 (0.61, 1.56) | 0.92 | ||
| 2° prevention indication | 2.12 (1.24, 3.61) | 0.006 | 2.09 (1.13,3.82) | 0.02 |
| LBBB | 0.82 (0.59,1.13) | 0.22 | 0.79 (0.56,1.13) | 0.20 |
| QRS duration (per ms) | 1.00 (0.99, 1.00) | 0.08 | ||
| NYHA (class) | 0.85 (0.62, 1.16) | 0.31 | ||
| Ejection fraction (per %) | 1.00 (0.98,1.02) | 0.65 | 1.03 (1.0,1.06) | 0.04 |
| RV dysfunction (grade) | 1.11 (0.92, 1.33) | 0.28 | ||
| MR (grade) | 0.93 (0.78, 1.11) | 0.41 | ||
| PASP (per mmHg) | 1.01 (1.0, 1.02) | 0.12 | ||
| Super responder | 0.09 (0.01–0.63) | 0.02 | 0.13 (0.02,0.91) | 0.04 |
ACE-I/ARB, ACE inhibitor/angiotensin receptor blocker; CI, confidence interval; DCM, dilated cardiomyopathy; HR, hazard ratio; LBBB, left bundle branch block; LVEDD, left ventricular end-diastolic diameter; LVEF, left ventricular ejection fraction; LVESD, left ventricular end-systolic diameter; MR, mitral valve regurgitation; NYHA, New York Heart Association; PASP, pulmonary artery systolic pressure; RV, right ventricular.
Inappropriate ICD shock
There were few associations with inappropriate ICD therapy; however, dilated cardiomyopathy (DCM) was associated with an increased risk (HR 2.49, 95% CI 1.20–5.17). Non-left bundle branch morphology at baseline was associated with a higher likelihood of inappropriate ICD shock (HR 2.94, 95% CI 1.36–6.35).
Subgroup analysis
The rate of ICD therapy (appropriate and inappropriate) is illustrated in Figure 3 and Table 4 according to gender and responder status. There were 140 patients (77 male, 63 female) that had DCM and LBBB at baseline. Four of the 77 males (5.2%) and 11 of the 63 females (17.5%) derived super-response. There were no ATP or appropriate ICD shock events in any of these patients; three (two male, one female), however, suffered inappropriate shocks. While there was no significant difference in appropriate ICD shocks in patients with NICM vs. ischaemic cardiomyopathy (5-year rate; 11.3 [95% CI 7.4–15.2%]) vs. 15.6% [95% CI 11.6–19.6%], P = 0.12), patients with NICM had a higher rate of inappropriate ICD therapy (8.0 [95% CI 4.6–11.4%] vs. 3.4% [95% CI 1.4–5.4, P = 0.01). As different definitions of super-response may yield different outcomes, we analysed patients when categorized as non/modest (defined as a post-CRT EF improvement of <5%), moderate (defined as a post-CRT EF improvement of 5–15%) and super (defined as a post-CRT EF improvement of >15%). As seen in Table 5 and Figure 4, results remained consistent. Given that the usual interval considered in the majority of the studies is 6 months, to reflect the pattern of LV remodelling after CRT, we performed an analysis using 6 months as the cut-off for EF assessment. With this, there were 33 super-responders that normalized their EF. Encouragingly, the results remain consistent with data using our 2 month cut-off demonstrating that super-responders have a significantly lower rate of ATP and appropriate ICD shocks compared with non-super-responders. Meanwhile, the rate of inappropriate ICD shocks was similar between the two groups (see Supplementary material online).
Rate of appropriate and inappropriate ICD therapy according to CRT-D responder status
| Appropriate ICD therapy | Inappropriate ICD therapy | |||||||
|---|---|---|---|---|---|---|---|---|
| # pts | ATP therapy | 5 year incidence rate | ICD shock | 5 year incidence rate | Combined 5 year incidence ratea | # pts | 5 year incidence rate | |
| Male SR | 19 | 1 | 5.3 (0–15.3) | 0 | – | 5.3 (0–15.3) | 2 | 14.1 (0–32.2) |
| Female SR | 18 | 0 | 0 | 0 | 0 | 0 | 1 | 0 |
| Male NSR | 475 | 13 | 24.3 (20.2–28.4) | 80 | 16.2 (12.7–19.7) | 27.5 (23.2–31.8) | 23 | 5.3 (3.2–7.4) |
| Female NSR | 117 | 17 | 13.5 (7.1–19.9) | 9 | 7.2 (2.4–12.0) | 15.5 (8.8–22.2) | 6 | 5.5 (1.2–9.8) |
Numbers refer to average (confidence interval).
SR, super-responder; NSR, non-super responder.
Combined refers to ATP and ICD shock.
Baseline characteristics of CRT recipients according to alternative definition of response
| Variable | N | Non/modest responder: EF change <5% (N = 304) | Moderate responder: EF change 5–15% (N = 225) | Super-responder: EF change >15% (N = 100) | P-value | |||
|---|---|---|---|---|---|---|---|---|
| Age at CRT implant | 629 | 66.3 | (11.0) | 68.5 | (10.6) | 65.7 | (13.7) | 0.035 |
| Male gender, n (%) | 629 | 243 | (80%) | 188 | (84%) | 63 | (63%) | <0.001 |
| CRT-D vs. CRT-P, n (%) | 629 | 304 | (100%) | 225 | (100%) | 100 | (100%) | |
| QRS morphology, n (%) | 621 | <0.001 | ||||||
| LBBB | 621 | 135 | (45%) | 101 | (45%) | 54 | (54%) | |
| RBBB | 621 | 27 | (9%) | 19 | (9%) | 5 | (5%) | |
| IVCD | 621 | 63 | (21%) | 29 | (13%) | 5 | (5%) | |
| Paced | 621 | 54 | (18%) | 67 | (30%) | 30 | (30%) | |
| Other | 621 | 13 | (4%) | 7 | (3%) | 6 | (6%) | |
| Digoxin, n (%) | 622 | 139 | (46%) | 104 | (47%) | 50 | (51%) | 0.75 |
| Beta blocker, n (%) | 623 | 267 | (89%) | 207 | (93%) | 91 | (92%) | 0.25 |
| ACE/ARB, n (%) | 622 | 261 | (87%) | 197 | (89%) | 84 | (85%) | 0.60 |
| Creatinine (pre-CRT) | 612 | 1.4 | (0.4) | 1.5 | (0.9) | 1.4 | (0.8) | 0.050 |
| NYHA class (pre-CRT) | 625 | 3.0 | (0.5) | 3.0 | (0.5) | 3.0 | (0.5) | 0.74 |
| QRS duration (pre-CRT) | 619 | 159.6 | (33.6) | 167.8 | (34.4) | 164.8 | (28.6) | 0.020 |
| LVEF | 627 | 25.2 | (7.2) | 22.5 | (7.2) | 22.1 | (6.9) | <0.001 |
| LVED size | 573 | 67.2 | (8.5) | 64.7 | (9.9) | 64.6 | (8.8) | 0.005 |
| LVES size | 533 | 57.8 | (9.9) | 56.3 | (10.9) | 56.0 | (9.7) | 0.20 |
| LVEDV | 329 | 210.2 | (65.2) | 208.2 | (80.4) | 201.7 | (77.6) | 0.79 |
| LVESV | 326 | 156.0 | (57.5) | 160.9 | (66.6) | 150.3 | (62.6) | 0.61 |
| MR grade | 579 | 1.5 | (0.9) | 1.5 | (1.0) | 1.3 | (0.9) | 0.05 |
| RV dysfunction | 521 | 1.1 | (1.0) | 1.2 | (0.9) | 0.9 | (1.0) | 0.08 |
| PASP | 546 | 48.2 | (15.4) | 47.1 | (14.7) | 43.0 | (15.3) | 0.024 |
Data expressed as mean ± standard deviation (median) unless stated otherwise.
ACE/ARB, ACE inhibitor/angiotensin receptor blocker; DCM, dilated cardiomyopathy; IVCD, intraventricular conduction delay; LBBB, left bundle branch block; LVEDD, left ventricular end-diastolic diameter; LVEDV, left ventricular end-diastolic volume; LVEF, left ventricular ejection fraction; LVESD, left ventricular end-systolic diameter; LVESV, left ventricular end-systolic volume; MR, mitral valve regurgitation; NYHA, New York Heart Association; PASP, pulmonary artery systolic pressure; RBBB, right bundle branch block; RV, right ventricular.
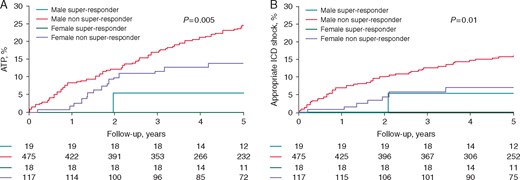
(A) Rate of ATP according to gender and responder status; (B) Rate of appropriate shocks according to gender and responder status.
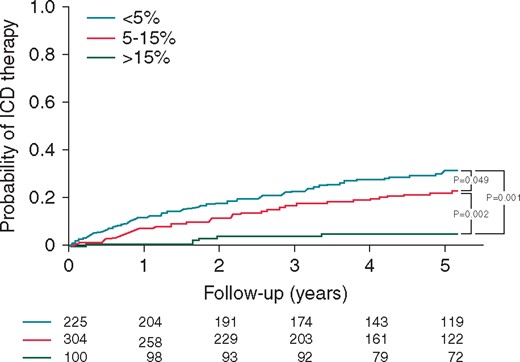
Kaplan–Meier curves for the rate of appropriate ICD therapy according to alternative definition of response.
Survival comparison
Eleven (1.7%) patients had follow-up <1 year duration. At last assessment date, 461 patients were alive; of these 437 were still followed after 2011. Twenty-six patients received LV assist devices and 29 underwent cardiac transplantation—all were in the non-super responder group. The 5-year cumulative probability of death in super and non-super responder patients was 24.3% (95% CI 4.6–43.4%) vs. 34.4% (95% CI 28.9–39.1%) (P = 0.11), respectively (Figure 5). While the difference was not quite statistically significant, the divergence in the curves suggests it this would have been with larger patient numbers.
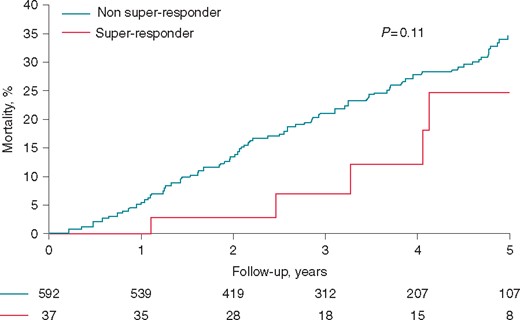
Mortality according to responder status.
Discussion
Cardiac resynchronization therapy (CRT) has been shown to improve HF-associated morbidity and mortality and its indications have been recently expanded to include patients with less severe HF symptoms.8–10 However, data are conflicting on its effect on ventricular arrhythmia (VA) occurrence.6,11–13 It is known that the degree of LV enlargement and dysfunction is directly related to risk of death. Therefore, improvement in LV diameter and function is expected to improve mortality as has been shown in multiple studies, with the degree of benefit proportional to the improvement in LV remodelling.5 While it is generally accepted that those with secondary prevention indications for CRT-D should receive CRT-D at elective generator replacement the issue is less clear in those with primary prevention indications. Given the improvement in EF, patients implanted with CRT for primary prevention may no longer meet traditional guideline criteria for prevention of sudden cardiac death. Therefore, some argue for ‘downgrading’ of the device to CRT-P at the time of replacement. While such an approach would save considerable resources and avoid unnecessary ICD therapies, patients may be placed at increased risk due to ongoing VAs. This large two-centre study with long follow-up duration shows that the rate of appropriate ICD therapy in CRT-D super-responders is exceptionally low (though not zero), especially in female super-responders.
The benefit in VA reduction with CRT is likely multifactorial and associated with structural alterations and reduction in myocardial ischaemia due to improved electromechanical function and altered neurohormonal activation.14,15 However, areas of fibrosis or scar may continue to form a nidus for re-entry and, therefore, VA in spite of an improved EF.
In a substudy of the MADIT-CRT trial, super-responders (defined as post-CRT EF >50%) had very low rate of VAs, occurring in only 5% at 2.2 years follow-up with none receiving an appropriate ICD shock.13 Furthermore, patients that were female, had non-ischaemic aetiology, LBBB, baseline EF > 30% and smaller LV and LA volumes had no VAs during follow-up. This was corroborated by Manfredi et al.16 who demonstrated that near normalization of LVEF to ≥45% was associated with low rates of ICD therapy. Conversely, others report ongoing risk of VAs despite reverse remodelling, and therefore argue against CRT-P at generator change.11
Factors associated with dilated cardiomyopathy therapy
Male gender was associated with a higher risk of ATP and appropriate ICD shock therapy, likely due to a lower super-response rate compared with females (see below). Other associations included a higher baseline LVESD and secondary prevention indication. Although super-responder status by itself was not associated with a statistically significant reduction in ICD shocks, it was still highly protective and would have likely been statistically significant with higher event numbers and power. Indeed, in combining ATP therapy to ICD shocks, super-responder status was highly protective in reducing appropriate ICD therapy rates, with only 1 event in the 19 male super-responders and none in 18 female super-responders.
Subgroup analysis
Patients with DCM have traditionally had a higher rate of super-response to CRT and, therefore, possibly fewer ICD interventions. While in our study these patients had no difference in the rate of ATP therapy compared with recipients with ICM, there was a higher rate of inappropriate ICD therapy. It is difficult to elucidate why inappropriate ICD therapy may be higher in patients with DCM; however, it may be related to increased activity post-CRT and, therefore, faster heart rates.
Females have been shown to derive super-response from CRT more frequently than males, and this was again confirmed in this study. While this may in part be related to a higher incidence of DCM in females, there remained a higher rate of super-response compared with males in those patients that had DCM and LBBB at baseline. Although one has to be careful to provide any recommendations based on a small number, it is noteworthy that no female super-responders required ATP or appropriate ICD shock therapy during follow-up; rather some did sustain inappropriate ICD therapy. Garcia-Lunar et al.12 had analogous findings in women with none of their 11 female super-responders having recurrence of VA during an average follow-up of 30 months. Furthermore, we found no occurrence of ICD therapy in super-responders with baseline DCM and LBBB, potentially identifying a low-risk subset.
Duration of follow-up
Studies that failed to show improvement in ICD therapy following CRT may be due to short follow-up time. The CONTAK-ICD and MIRACLE-ICD studies showed no improvement in number of ICD shocks at 6 months.17,18 However in the CARE-HF (CRT-P only)9 and RAFT19 trials which had longer follow-up, the rate of sudden death was lower with CRT. Rickard et al.20 demonstrated that the 5-year survival benefit for super-responders only became evident after 2 years. In our study, follow-up duration was on average over 6 years, allowing patients that are likely to suffer VAs and require ICD therapy despite super-response to declare themselves by the time of elective generator change. Taken together, this suggests that longer follow-up is important and may be crucial in deciding whether patients truly are at low risk for further VAs.
Limitations
Our study is retrospective with inherent limitations. The number of super-responders is small; this may be related to the definition used and the inclusion of all patients that died or received cardiac transplantation post CRT-D. Since we included recipients from 2002, primary prevention CRT-D settings were not based on MADIT-RIT recommendations; therefore, VA detection rates may be higher than with current practice.21 We did not have full baseline anti-arrhythmic data; however, the majority of patients received ICD for primary prevention purposes. VAs slower than the detection threshold may have occurred and, therefore, not detected. Our long study period in addition to the two-centre design may limit uniformity of care. However, the long study period allows maximal recognition of ICD therapy events. Time-dependent analysis could not be performed as serial echocardiograms were not universally available. In addition, as we did not perform serial echocardiograms throughout the study period, EF (and therefore response status) may be different at the time of generator change than from its initial determination. Finally, given the relatively small sample size, power may have been too low to detect any differences between comparison groups. An important strength of our study that deserves mention, however, is that to our knowledge we provide the longest reported follow-up on this topic to date, with an average duration of over 6 years.
Conclusion
Recipients of CRT-D that normalize their EF have very low rates of VA requiring ICD therapy compared with those that do not. These observations raise the discussion of a possible downgrading to CRT-P at elective generator change in super-responders, particularly in females. However, further evidence is needed before committing this to routine clinical practice.
Supplementary material
Supplementary material is available at Europace online.
Conflict of interest: none declared.
