


Abstract
Repolarization indices of ECG have been widely assessed as predictors of ventricular arrhythmias. However, little is known of the dynamic changes of these parameters during continuous monitoring in acute ischaemic episodes. The objective of the study was to evaluate repolarization-related predictors of ventricular fibrillation (VF) during progression of experimental myocardial infarction.
Myocardial infarction was induced in 27 pigs by 40-min balloon inflation in the left anterior descending coronary artery, and 12-lead ECG was continuously recorded. Rate-corrected durations of the total Tpeak-Tend intervals measured from the earliest T-wave peak to the latest T-wave end in any lead were determined at baseline and at minute 1, 2, 5, and then every 5th minute of occlusion. There were 7 early (1–3 min) and 10 delayed (15–30 min) VFs in 16 pigs. Baseline Tpeak-Tend did not differ between animals with and without VF. Tpeak-Tend interval rapidly increased immediately after balloon inflation and was greater in VF-susceptible animals at 2–15 min compared with the animals that never developed VF (P < 0.05). Tpeak-Tend was tested as a predictor of delayed VFs. Median Tpeak-Tend at 10th min of occlusion was higher in delayed VF group (n = 10) than in animals without VF (n = 11): 138 [IQR 121–148] ms vs. 111 [IQR 106–127] ms, P = 0.02. Tpeak-Tend ≥123 ms (10th min) predicted delayed VF episodes with HR = 4.5 95% CI 1.1–17.8, P = 0.031.
Tpeak-Tend prolongation during ischaemia progression predicts VF in the experimental porcine myocardial infarction model and warrants further testing in clinical settings of acute coronary syndromes.
What’s new?
VF constitutes a major public burden and predicting life-threatening arrhythmias presents a great challenge.
ECG repolarization indices (specifically, those of dispersion of repolarization) have been the focus of VF prediction for a long time; however, the predictive power of snapshot measurements of these parameters has not been clearly demonstrated possibly due to technical and methodological reasons.
The present experimental study with continuous 12-lead ECG monitoring has shown that Tpeak-Tend interval predicts VF occurrence in dynamical observation during progression of myocardial infarction in a porcine model.
This observation warrants further clinical studies for monitoring the immediate risk of VF in acute coronary syndromes.
Introduction
Ventricular fibrillation (VF), arising both during and after the first 48 h of acute myocardial infarction, present a frequent complication of acute myocardial infarction (4.9% and 0.9%, respectively), and are associated with high in-hospital mortality (19.8% and 36.8%, respectively).1–3 Also, VF remains the leading cause of sudden cardiac death constituting a major public burden. Predicting life-threatening arrhythmias presents a great challenge.
As VF is primarily an electrophysiological phenomenon, it is reasonable to attempt predicting VF on the basis of electrocardiographic parameters. ECG repolarization indices have been the focus of VF prediction for a long time due to the straightforward connection between the repolarization phase and the development of the arrhythmogenic substrate and trigger. Dispersion of ventricular repolarization, being the factor contributing to the unidirectional conduction block and thus leading to the development of reentry and VF, is therefore of particular interest.
Dispersion of QT intervals, either native or rate-corrected (QTc), has likely been the most widely studied index of ventricular repolarization. However, the predictive power of QT dispersion and its relation to VF has been questioned by data obtained in large prospective studies.4 Moreover, from a theoretical/methodological point of view, QT dispersion has been shown to reflect not the extent of heterogeneity of ventricular repolarization itself, but the spatial position of the vectorcardiographic T loop.5
Tpeak-Tend interval was proposed as a marker of dispersion of ventricular repolarization6 and as such was studied as a predictor of VF in ischaemic conditions in addition to or instead of QT dispersion.7–10 The investigations generally demonstrated associations between the Tpeak-Tend intervals and arrhythmic events or mortality; however, these data have not been confirmed by large studies in the general population.11 As a result, current guidelines for management of patients with ventricular arrhythmias and prevention of sudden cardiac death12 do not recommend any ECG markers for VF prediction or risk stratification in myocardial infarction patients.
One possible approach to circumvent problems with determining repolarization predictors of VF is to move from snapshot measurements to dynamic observations of the ECG parameters characterizing the dispersion of repolarization in acute settings. This approach has been already utilized for short-lasting periods of ischaemia,13,14 but no data are available for the dynamic behaviour of Tpeak-Tend intervals and their relation to VF during periods of progression of ischaemia and necrosis.
Thus, earlier studies mostly relied on the analysis of relationship between the outcome of myocardial infarction and dispersion of ventricular repolarization measured as Tpeak-Tend on snapshot ECG recorded in the early phase of myocardial infarction, which showed association with arrhythmic events in standardized settings but were not reproduced in large clinical studies. We hypothesized that development of arrhythmogenic substrate in ventricular myocardium during ischaemia is reflected in the evolution of Tpeak-Tend as an index of heterogeneity of ventricular repolarization rather than in snapshot-based Tpeak-Tend measurements. The objectives of the present study were to describe changes of repolarization variables during an ischaemic episode, and to test whether evolution of electrocardiographic indices of dispersion of repolarization could predict VF.
Methods
Experimental protocol
The study conforms to the Guide for the Care and Use of Laboratory Animals, US National Institutes of Health (NIH Publication No. 85-23, revised 1996) and was approved by the local animal research ethics committee.
The experiments were performed on a closed-chest porcine model of myocardial infarction. The experimental preparation, study protocol and imaging technique were previously described in detail.15 In brief, ischaemia was induced in pigs (n = 31) by inflating the angioplasty balloon in the left anterior descending coronary artery (LAD), immediately distal to the first diagonal branch. Occlusion was verified by repeated coronary angiography, and the duration of occlusion was 40 min. Continuous 12-lead ECG monitoring (‘Kardiotechnica-04-8’, INCART, St. Petersburg, Russia) was performed with a sampling rate of 1028 Hz, dynamic range of ± 310 mV and 19-bit ADC, which provides an amplitude resolution of 1.18 μV per bit. The recording was initiated before the occlusion, and continued throughout the occlusion.
Imaging
Ex vivo imaging of the heart was undertaken in 15 pigs according to a previously described protocol.16 Cardiac magnetic resonance (CMR) and single photon emission computed tomography (SPECT) images were analysed using freely available software (Segment v1.700, Medviso, Lund, Sweden; http://segment.heiberg.se). In brief, the area at risk (MaR) and infarct size (IS) are expressed as a percentage of left ventricular myocardium. For MaR measurement, tetrofosmin Tc 99m (1000 MBq) was administered intravenously at the 20th minute of occlusion. Ex vivo imaging was performed with a dual-head camera (Skylight, Philips, Best, The Netherlands). The endocardial and epicardial borders of the left ventricle that were manually delineated in the CMR images were copied to the co-registered SPECT images. A SPECT defect was defined as a region within the CMR-determined myocardium with counts lower than 55% of the maximum counts in the myocardium. For determination of IS, a gadolinium-based contrast agent (Dotarem, gadoteric acid, Gothia Medical AB, Billdal, Sweden, 0.4 mmol/kg) was administered intravenously 30 min before removal of the heart. After removal, the heart was immediately rinsed in cold saline and the ventricles were filled with balloons containing deuterated water. CMR was performed using a 1.5-T MR scanner (Intera, Philips). The infarcted myocardium was defined as the myocardium with a signal intensity of greater than 8 SD above the average intensity of the non-affected remote myocardium, quantified as the product of the slice thickness and the area of hyperenhanced myocardium.
Data processing
The time of QRS onset, T-wave peak, and T-wave end in the individual leads were determined automatically using KT Result software (INKART, St. Petersburg, Russia). T-wave measurements were then verified by the qualified observer (JA) who was unaware of arrhythmic events. The time of the T-wave peak on the unfiltered ECG was determined as the point between ascending and descending limbs of the T wave with the potential time derivative dV/dt = 0 determined using a ± 30 ms time window from the point of interest in the range from 40 to 500 ms from the QRS termination, but not farther than half the way from the QRS termination to the next QRS onset. The time window for the dV/dt determination is ± 30 ms from the point of interest. In the ECGs with the complex (two-peak) T-wave morphology, the peak time was assigned to the peak adjacent to the steepest wavefront. The time of T-wave end was determined as the time when the magnitude of the dV/dt of the final limb of the T wave decreased to the threshold value defined as the maximum of (i) mean dV/dt value of the tail part of the T wave, (ii) the predefined value of 42 μV, and (iii) the noise level. The U-wave end was excluded from automatic search by imposing temporal limitations (100 ms from the steepest part of the final T-wave limb). A feasibility of the automatic determination of the T-wave parameters was tested by measurements of the base line displacement and noise level with respect to the steepest T-wave wavefront amplitude.
After the abovementioned determination of T-wave parameters, the QT, QTpeak, and their Bazette rate-corrected values (QTc = QT/√RR; QTcpeak = QTpeak/√RR) were calculated in a set of recorded precordial and limb leads. The data were considered acceptable if the measurements could be accomplished in at least five leads that included inferior (II, III, or aVF), anterior (V1, V2, or V3), and lateral (I, V5, or V6) leads. If the measurements were unfeasible in the required leads, the data from this time-point were discarded. Eight measurements at individual time-points and additionally all data from four pigs were excluded by the observer due to artifacts, noise, complex T-wave morphologies, or overlapping of the T and P waves. As a result, the data from 27 out of 31 pigs were included in the analysis.
The maximal and minimal values of the calculated intervals in the same cardiac cycle were used for subsequent analysis. The QTc and QTcpeak dispersions were measured as the difference between the maximal and minimal values of the parameter of interest. The total Tpeak-Tend interval was determined as the difference between the earliest corrected T-wave peak and the latest corrected T-wave end. The parameters were then averaged for two consecutive supraventricular QRST complexes. The dynamic changes of the repolarization indices were assessed by measurements done at baseline and during the period of occlusion at 1, 2, 5, 10, 15, 20, 25, 30, 35, 40 min of ischaemia. The data obtained at the same time-points were compared between the two groups of animals: the VF-susceptible animal group (experiencing VF during LAD occlusion period, VF group) and the VF-resistant animal group (No VF group).
Statistical analyses were performed using the SPSS 23 (SPSS, Inc., Chicago, Illinois, USA). According to normal data distribution confirmed by the Kolmogorov–Smirnov test, Student’s t-test was used to compare the VF and No VF groups. ANOVA post-hoc Tukey test was used for multiple comparisons of repeated measurements in the same two groups during the 40-min LAD occlusion. Pearson correlation coefficients were calculated in order to study the relationships between the different ECG parameters. In order to determine predictors of VF occurrence, ROC curve analysis was used, followed by the analysis of Cox regression and Kaplan–Meier survival functions. The differences were considered significant at P-value <0.05.
Results
Dynamics of repolarization indices during LAD occlusion in the general group
The QTc and QTcpeak intervals demonstrated different dynamics during the occlusion period (Figure 1A, B). Minimal QTcpeak shortened during the ischaemia exposure in ischaemia-related leads, with the greatest changes occurring during the initial 5 min (P < 0.001). Minimal and maximal QTc intervals increased during the first minute as compared with the baseline state (P = 0.001 and P = 0.008, respectively), and no significant dynamics were observed thereafter. Similarly, the maximal QTcpeak tended to increase at the first minute of occlusion, but these changes did not reach statistical significance (P = 0.058).
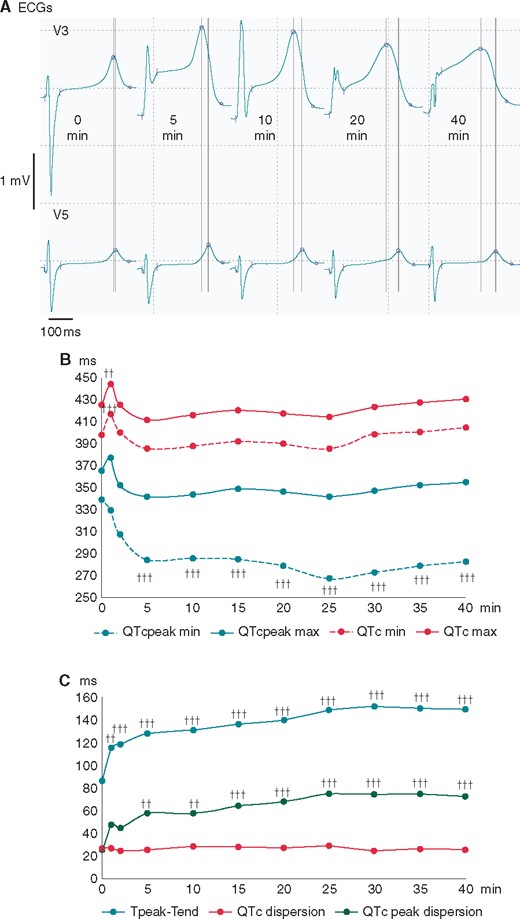
Changes of basic ECG parameters of ventricular repolarization during coronary occlusion. (A) The representative QRST complexes in the leads with maximal (V3) and minimal, if any (V5), ST-segment displacement during the course of LAD occlusion. Automatically measured margins of QRS complexes and markers for the Tpeak and Tend are indicated by the short vertical lines and circles, respectively. Note the increased dispersion of Tpeak timing (long vertical lines) due to QTpeak shortening in V3. (B) The time course of repolarization duration indices (averaged durations of maximal and minimal QTc and QTcpeak intervals). (C) The time course of repolarization heterogeneity indices (averaged values of Tpeak-Tend interval, QTc dispersion and QTcpeak dispersion) ††P < 0.01 vs. baseline; †††P < 0.001 vs. baseline. LAD, left anterior descending coronary artery.
Figure 1C displays changes in repolarization heterogeneity parameters during the occlusion period. Due to the dramatic changes of the minimal QTcpeak in ischaemia-related leads and the moderate changes of the maximal QTcpeak, a QTcpeak dispersion increased progressively during the occlusion period (P < 0.001), mainly during the first 5 min. The QTc dispersion did not demonstrate any significant changes during the occlusion period due to the generally concordant changes of the minimal and maximal QTc intervals. As a result of different dynamics of the QTc and QTcpeak intervals, the Tpeak-Tend intervals prolonged during the ischaemia exposure (P < 0.001), mainly during the first 5–10 min, then to a lesser extent up to the 25th min, and remained relatively stable thereafter. During the occlusion period, there was a strong correlation between the durations of the Tpeak-Tend intervals and the dispersions of the QTcpeak (Pearson’s correlation coefficients at each of the time-points ranged from 0.65 to 0.86, mean 0.80 with P-values <0.001). This correlation was absent during the baseline period (correlation coefficient 0.34, P > 0.05). Correlation coefficients of the Tpeak-Tend vs. QTc dispersion were mostly insignificant, being 0.36 (P > 0.05) at baseline and ranging from 0.06 to 0.50 during the occlusion period (mean 0.29, P > 0.05).
VF occurrence during coronary occlusion
Among the 27 studied pigs, 17 VF episodes were observed in 16 animals. All cases were defibrillated to sinus rhythm, and the pigs survived to the end of the 40-min LAD occlusion period. There were 7 early VFs (range 1–3 min, median 1.8 min after occlusion onset) and 10 delayed VFs (range 15–30 min, median 19.4 min after occlusion onset). These two distinct subsets of VFs corresponded to the previously-described arrhythmic pattern during the first hour of acute ischaemia, with arrhythmias arising during the first 10 min and from 10–15 to 40–45 min of occlusion period, and referred to as phase 1A and phase 1B arrhythmias, respectively.17 One animal experienced one early episode and one delayed episode.
Neither IS nor MaR (Figure 2) differed among the animals in the VF and the No VF group (IS: 27 [IQR 21–29]) % vs. 21 [IQR [20–23] %, P = 0.224 and MaR: 47 (IQR 35–50) % vs. 37 (IQR 31–39) %, P = 0.328, respectively). Moreover, no significant correlations were observed between the abovementioned ischaemia parameters and the studied ECG repolarization variables.
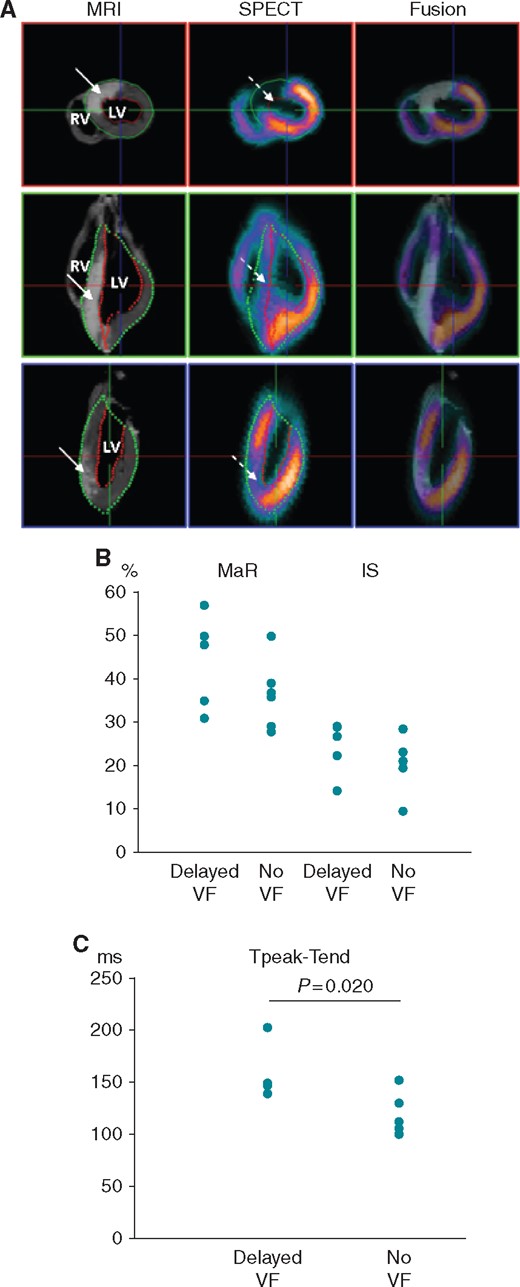
Individual values of the indices of ischaemic damage and ECG repolarization parameters in animals from the groups of delayed VF and no VF. (A) Representative images of MaR and IS in the pig heart after LAD occlusion. Left column: CMR performed for visualization of anteroseptal infarction (solid arrows, white colour). Middle column: SPECT visualization of the anteroseptal perfusion defect (dashed arrows, cold/absent colours). Right column: Fusion of MRI and SPECT images. The upper panel shows a mid-ventricular short-axis slice, and the lower two panels show two long-axis slices. From Demidova et al.15 with permission. (B) Individual values of the area at risk (MaR) and infarct size (IS) in delayed VF and no VF groups. (C) Individual values of Tpeak-Tend intervals measured at 10th minute of occlusion subsequently used for prediction of delayed VF.
VF-susceptible animals had shorter RR intervals at baseline (745 [IQR 702–837] ms vs. 960 [IQR 786–1028] ms, P = 0.013) and this difference persisted during coronary occlusion. During occlusion period, no statistically significant changes of heart rate were seen in VF-susceptible and VF-resistant animals.
Repolarization indices and delayed VF
Ventricular repolarization indices at baseline could not predict the occurrence of the VF episodes during ischaemia. Similarly, VF occurrence was not predicted by the QTc and QTcpeak interval durations and their dispersions throughout the 40-min period of coronary occlusion. However, VF-susceptible animals presented with a greater initial increase in Tpeak-Tend interval, which was significantly longer in the VF group as compared with the No VF group at 2–15 min of occlusion (P < 0.05). This observation provided a rationale for testing the value of Tpeak-Tend interval for predicting delayed VF episodes. The animals who suffered from phase 1A (early) VFs were excluded from this analysis. Accordingly, the animals that were subsequently analysed had the 1B phase VFs.
At the 10th min of occlusion, i.e. at the time preceding the delayed VF episodes, the magnitude of the Tpeak-Tend interval distinguished between the delayed VF group and the No VF group, whereas other studied variables thought to reflect repolarization heterogeneity did not demonstrate any differences (Figure 3). Figure 4A depicts the time course of the Tpeak-Tend interval in the delayed 1B VF group and the No VF group up to the last measurement (10th min) prior to the delayed arrhythmic window and the distribution of VFs in the subsequent period (15–30 min). ROC curve analysis showed significant association between Tpeak-Tend interval at the 10th min and the occurrence of delayed VF (AUC 0.800, P = 0.020), and identified the optimal cutoff value of 123 ms, which predicted VF occurrence with sensitivity of 70%, specificity of 73%, positive predictive value of 70% and negative predictive value of 73%. Tpeak-Tend interval ≥123 ms predicted subsequent VF with hazard ratio of 4.5 (95% CI 1.1–17.8; P = 0.031) by Cox regression analysis. The Kaplan–Meier survival functions (Figure 4B) demonstrated the significant differences (log-rank P = 0.019) in VF occurrence between the pigs having the Tpeak-Tend interval duration above and below 123 ms at 10th min of occlusion.
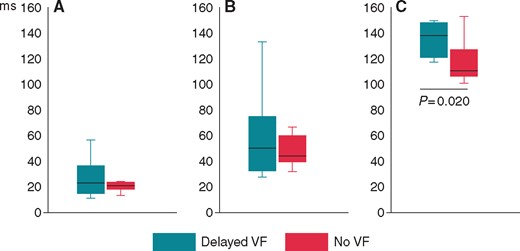
Comparisons of the parameters of dispersion of repolarization between VF-resistant animals (the No VF group) and animals with delayed arrhythmias (the Delayed VF group) at a time point (10 min of occlusion period) preceding VF episodes. (A) QTc dispersion, (B) QTcpeak dispersion, (C ) Tpeak-Tend interval. Medians (horizontal lines, inter-quartile intervals (boxes) and limits (vertical lines) are shown. VF, ventricular fibrillation.
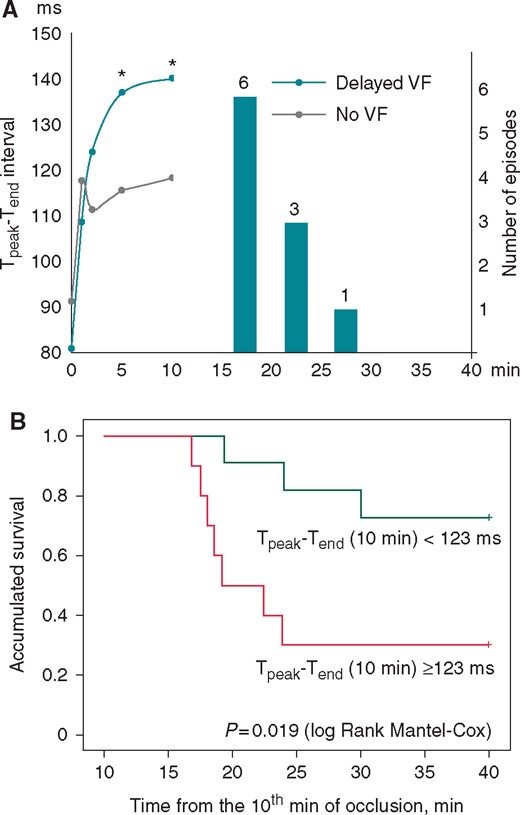
Predictive value of the Tpeak-Tend interval. (A) The time course of the Tpeak-Tend interval changes in subgroups of pigs with delayed arrhythmias (Delayed VF) and VF-resistant pigs (No VF) during the LAD occlusion period prior to the period of delayed VF (15–30 min). *P < 0.05 Delayed VF vs. No VF group. The vertical bars and numbers indicate the number of VF episodes observed in each 5 min interval. (B) Kaplan–Meier survival function analysis for the animals with the 10th min Tpeak-Tend interval duration above and below the cutoff value of 123 ms. LAD, left anterior descending coronary artery; VF, ventricular fibrillation.
Discussion
In the present study, we demonstrated that ECG indices of repolarization heterogeneity have been changing during the 40-min period of acute ischaemia, and the animals who suffered from VF had greater changes than the animals who did not develop VF during coronary artery occlusion. The mechanism of these effects is likely related to alterations of action potential durations in the ischaemic myocardium. Myocardial ischaemia is known to reduce action potential duration.18 In the present study, this phenomenon manifested on the ECG as a shortening of the minimal QTcpeak, which pertains to the ischaemic region. The T wave peak corresponds to the earliest end of repolarization in the myocardial region generating a signal in a given ECG lead.6 Therefore, the shortening of the T-wave peak should mark the shortening of the earliest ventricular repolarization time, which is related to ischaemic conditions.
On the other hand, we found no changes in QTc intervals during the greatest part of the 40 min occlusion period, except in the first minute when there was a short-lasting QTc prolongation. The end of the T wave (and the end of the QT interval) in a given unipolar lead apparently corresponds to the end of the repolarization process in the corresponding myocardial region, and hence the maximal time of T-wave end indicates the latest repolarization time in the myocardium. The earliest period of myocardial ischaemia is associated with transient prolongation of the action potential durations in at least a part of ischaemic cardiomyocytes.19 In the present study, this phenomenon is apparently expressed in the increase of QTc intervals at the first minute of occlusion. Throughout the remaining (major) period of occlusion, the ischaemia classically induced the shortening of action potential durations,18 and therefore the T-wave end corresponded to the end of repolarization somewhere in non-ischaemic tissue, which remained stable and close to its baseline value.
At the first minute of occlusion, QTc dispersion did not change because the minimal and maximal QTc intervals followed parallel courses of behaviour. QTc dispersion did not change significantly during the remaining occlusion period occlusion either, in accordance with relatively stable minimal and maximal QTc intervals. In contrast, dispersion of QTcpeak intervals increased dramatically as a result of local ischaemic shortening of the minimal QTcpeak. Likewise, due to shortening of the minimal QTcpeak and nearly unchanged maximal QTc, the Tpeak-Tend interval consistently increased up to 25 min of occlusion and remained stable at this level thereafter.
According to correlation analysis, the alterations of the Tpeak-Tend intervals resulted from QTcpeak changes, not QTc changes. Determining the T-wave end timing usually presents a technical difficulty, and could, at least in part, account for the weak predictive value of repolarization ECG indices in respect to VF prognosis.4,11 The correlation between the behaviours of Tpeak-Tend and QTcpeak timing (with QTcpeak timing being much easier to measure than T-wave end) suggests that measurements of the Tpeak-Tend interval could be reliable in an acute ischaemic episode, and that this index can possibly be used as a VF predictor in this setting.
The VFs observed in the present study were clustered into two distinct subsets, categorized as 1A (‘early’) and 1B (‘delayed’) arrhythmias,17 which are believed to be caused by different mechanisms. In clinical settings, phase 1A arrhythmias usually occur long before a patient’s first contact with healthcare providers. Since progression of myocardial infarction in pigs is approximately 7 times faster than in humans,20 the delayed arrhythmias observed in the porcine model at approximately 20 min of coronary artery occlusion (1B phase) correspond to the arrhythmias in humans at approximately 2–2.5 h of myocardial infarction in clinical settings, and predicting VF in 1B period may be clinically relevant.
Among the studied variables, Tpeak-Tend intervals were longer in the VF-susceptible animals during the period preceding VF episodes. Originally, the Tpeak-Tend interval was proposed as an index of transmural dispersion of repolarization,6 but more recent studies have shown that it is a global dispersion of repolarization that is reflected in the Tpeak-Tend interval.21,22 The observation of the increased Tpeak-Tend intervals prior to arrhythmias allowed us to test Tpeak-Tend duration as a predictor of VF. In fact, in the group of the delayed arrhythmias the prolongation of the Tpeak-Tend interval greater than the cut-off value of 123 ms predicted VF occurrence. Phase 1B of ischaemic ventricular arrhythmias has been found to be associated with the period of the intercellular uncoupling23 leading to the activation slowing. The present study suggests that increased global dispersion of repolarization (estimated as prolongation of the Tpeak-Tend interval) could contribute to the arrhythmogenesis, possibly by facilitating the unidirectional conduction block development.
Limitations of the study
Our evaluation of predictors of ischaemia-induced VF was done with a predefined LAD occlusion site immediately distal to the first diagonal branch. Accordingly, we could not take into account the involvement of different ventricular regions. This approach allowed us to exclude the location of ischaemic damage as a contributing factor to arrhythmogenesis and to focus on the electrophysiological parameters. On the other hand, even in case of the definite occlusion site, the size of ischaemic damage varied between the individual pigs and the absence of differences in the IS or MaR between VF-susceptible and VF-resistant animals could have been the matter of statistical power. Autonomic influences on ventricular repolarization have been shown to affect T-wave indices and arrhythmic vulnerability in acute ischaemia.14 We did not assess the autonomic effects, and the laboratory animals were anesthetized. Therefore, any extrapolation of our findings observed in anesthetized experimental animals to clinical settings should be made with extreme caution.
Conclusions
In experimental myocardial infarction, dynamic increase of the Tpeak-Tend interval related to shortening of the QTpeak interval in ischaemia-related leads during ischaemia progression predicts VF and warrants further clinical studies for monitoring the immediate risk of VF in acute coronary syndromes.
Conflict of interest: none declared.
Funding
The study was supported by the scholarship to Dr Azarov by The Swedish Institute’s Visby Programme (# 00073/2015, Sweden); Dr Platonov received research grants from the Swedish Heart-Lung Foundation (grant #20110875, Sweden) as well as government funding of clinical research within the Swedish National Health Service (Sweden); Dr Demidova was supported by a research grant from Region Skåne (Sweden).
