


Introduction: Identification of areas for successful ablation in patients with persistent atrial fibrillation (persAF) remains challenging. We aim to improve ablation target identification using frequency and phase mapping to better understand the underlying mechanisms of persAF.
Methods: A quasi-real-time software platform with graphic user interface incorporating multiple parameters to guide EP studies in persAF patients was developed (Figure 1A). 10 patients undergoing left atrial (LA) persAF ablation targeting dominant frequency (DF) were enrolled. Virtual electrograms (VEGMs) from 2048 channels were collected for 5 mins (Ensite Array, St Jude Medical) and exported with LA geometry data into the software platform. The highest DF (HDF) areas were identified after the removal of ventricular farfield (with QRST substraction) from the VEGMs. Ablation was performed targeting HDF regions considering 30-second continuous data. Analysis was performed to identify recurrent HDF spatial patterns using an automated pattern-recognition algorithm over the continuous recording (Figure 1B). Frequency features inside and outside the most recurring dominant pattern (DP) time windows were compared. The phase of VEGMs was determined using Hilbert transform. Performance of three techniques used for automated phase singularity (PS) detection was compared. Optimised thresholds were found based on manual annotation. Rotor analysis was performed by detecting PSs using the optimised algorithm and tracking rotors in consecutive frames for > 50 ms. Features of ablated rotors were compared between ablation sites that terminate (terminators) compared to those that did not (non-terminators).
Results: 4 out of 10 patients terminated after DF-guided ablation before pulmonary vein isolation. The frequency in HDF regions during DP time windows was not different from non-DP (6.25±0.73 Hz vs 6.26±0.70 Hz, p = 0.92), but standard deviations of HDF regions among the DP windows was lower (0.18±0.06 Hz vs. 0.29±0.12 Hz, p < 0.05). The frequency organization of the VEGMs in HDF regions within DP windows was higher (0.35±0.03 vs 0.31±0.04, p < 0.05). PS histograms created using each method correlated poorly: structural similarity index=0.59±0.14, correlation coefficient= 0.30±0.12. With optimised thresholds, the average distances between the detected and manually annotated PSs for the three algorithms were 4.38±3.88 mm, 3.19±2.32 mm and 1.63±2.30 mm (p < 0.0001, Figure 1C). The DFs ablated at rotor cores were significantly lower at terminators than non-terminators (5.81±0.67 Hz vs 6.35±0.58 Hz, p < 0.0001). The difference between HDF and the DF at rotor cores were higher at terminators (3.09±1.10 vs 2.17±0.96, p < 0.0001).
Conclusion: Ablation of cyclical HDF regions in the LA seems to favour AF organisation. LA regions with recurrent DF patterns showed higher organisation, but not higher frequency. PS detection is dependent on the techniques and thresholds within algorithms, which may explain conflicting outcome of rotor-based ablation. Unified method with optimised thresholds are recommended in future EP studies. Rotor cores associated with AF termination with ablation were poorly correlated with HDF sites, and showed lower core frequency compared to non-terminators. These findings suggest that targeting LA regions hosting rotors with organised, recurring and lower DF could be more effective in terminating persAF during ablation.
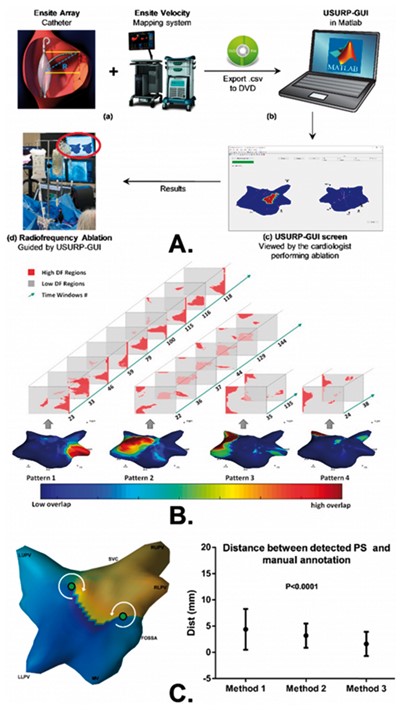
Figure I A. The workflow of using the proposed platform to guide catheter ablation: (a) NCM array and EnSite Velocity system used to collect the data; (b) information exported using DVD-RW disks to laptop running MATLAB; (c) USURP-GUI screen; (d) results exhibited to the cardiologist to help guide ablation. B. All recurrent patterns of a patient with the 2D HDF maps involved in each pattern and the corresponding time windows numbers, color-coded 3D geometry shows the overlap of all the pattern windows. C. Left: 3D phase map and its 2D representation with PS points (green circles); Right The shorted path/distances (average inter-electrode distance ∼3.5 mm) on the surface of 3D atrial mesh between PSs using manual annotation and the PSs using each method with revised thresholds.
