


Abstract
The aim was to provide comprehensive information on the use of cardiac implantable electronic device (CIED) and catheter ablation therapy in the European Society of Cardiology (ESC) area.
The European Heart Rhythm Association (EHRA) has collected data on use of invasive arrhythmia managements since 2008. Fifty-one of the 56 ESC member countries provided data for the EHRA White Book 2015. This analysis is based on the current and previous editions of the EHRA White Book. Up-to-date information on procedure rates for the last 5 years together with information on economic resources, reimbursement systems, and training requirements are presented for each country and the five geographical ESC regions. In 2014, the CIED implantation rates per million population were highest in the Western followed by the Southern and Northern European countries. The catheter ablation activity was largest in the Western followed by the Northern and Southern areas. Altogether the procedure rates were lowest in the Eastern European and in the non-European ESC countries. In the European ESC countries, the procedure rates were 3–10 times higher than in the non-European ESC countries. However, in some countries with a relatively low gross domestic product the procedure rates exceeded the average values indicating that utilization of arrhythmia therapies was not driven merely by the economic factors.
This analysis indicates that considerable heterogeneity in the availability and utilization of arrhythmia therapies still exist across the ESC area. The data will hopefully aid in directing future activities and promote harmonization of cardiac arrhythmia care in the ESC countries.
Introduction
The European Heart Rhythm Association (EHRA) White Book has been the key source for information on various electrophysiological procedure rates in the European Society of Cardiology (ESC) member countries since 2008. The objective of the current analysis is to provide comprehensive information on the trends in the use of cardiac implantable electronic device (CIED) and catheter ablation therapy in the ESC area over the last 5 years. The analysis provides each country with the ability to see its own data in an international context. As previously,1–3 we have provided not only statistics on a variety of electrophysiological procedures, but also information on the social, financial, and economic aspects in the constituent ESC countries. It is hoped that these data will help clarify whether financial restrictions influence the delivery of arrhythmia care. In addition to the collective data, statistics for the four geographical European (Northern, Western, Eastern, and Southern) ESC regions and for the non-European ESC countries are presented separately in order to facilitate comparisons between and within these geographical areas (Figure 1). Distribution of population within these regions over the last 5 years is presented in Table 1.
Populations in the five geographical ESC regions in 2010–14
| Region | Country | ISO code | 2010 | 2011 | 2012 | 2013 | 2014 |
|---|---|---|---|---|---|---|---|
| Northern Europe | Denmark | DK | 5 515 575 | 5 529 888 | 5 543 453 | 5 556 452 | 5 569 077 |
| Estonia | EE | 1 291 170 | 1 282 963 | 1 274 709 | 1 266 375 | 1 257 921 | |
| Finland | FI | 5 255 068 | 5 259 250 | 5 262 930 | 5 266 114 | 5 268 799 | |
| Iceland | IS | 308 910 | 311 058 | 313 183 | 315 281 | 317 351 | |
| Ireland | IE | 4 622 917 | 4 670 976 | 4 722 028 | 4 775 982 | 4 832 765 | |
| Latvia | LV | 2 083 703 | 2 204 708 | 2 191 580 | 2 178 443 | 2 165 165 | |
| Lithuania | LT | 3 545 319 | 3 535 547 | 3 525 761 | 3 515 858 | 3 505 738 | |
| Norway | NO | 4 676 305 | 4 691 849 | 5 000 000 | 5 085 582 | 5 147 792 | |
| Sweden | SE | 9 074 055 | 9 088 728 | 9 103 788 | 9 647 386 | 9 723 809 | |
| United Kingdom | GB | 62 348 447 | 62 698 362 | 63 047 162 | 63 395 574 | 63 742 977 | |
| Total | 98 721 469 | 99 273 329 | 99 984 594 | 101 003 047 | 101 531 394 | ||
| Western Europe | Austria | AT | 8 214 160 | 8 217 280 | 8 219 743 | 8 221 646 | 8 223 062 |
| Belgium | BE | 10 423 493 | 10 431 477 | 10 438 353 | 10 444 268 | 10 449 361 | |
| France | FR | 64 768 389 | 65 102 719 | 65 630 692 | 65 951 611 | 66 259 012 | |
| Germany | DE | 81 644 454 | 81 471 834 | 81 305 856 | 81 147 265 | 80 996 685 | |
| Luxembourg | LU | 497 538 | 503 302 | 509 074 | 514 862 | 520 672 | |
| Netherlands | NL | 16 783 092 | 16 653 734 | 16 730 632 | 16 805 037 | 16 877 351 | |
| Switzerland | CH | 7 623 438 | 7 639 961 | 7 925 517 | 7 996 026 | 8 061 516 | |
| Total | 189 954 564 | 190 020 307 | 190 759 867 | 191 080 715 | 191 387 659 | ||
| Eastern Europe | Belarus | BY | 9 612 632 | 9 577 552 | 9 643 566 | 9 625 888 | 9 608 058 |
| Bulgaria | BG | 7 148 785 | 7 093 635 | 7 037 935 | 6 981 642 | 6 924 716 | |
| Czech Republic | CZ | 10 201 707 | 10 190 213 | 10 177 300 | 10 609 762 | 10 627 448 | |
| Hungary | HU | 9 992 339 | 9 976 062 | 9 958 453 | 9 939 470 | 9 919 128 | |
| Moldova | MD | 3 731 799 | 3 694 121 | 3 656 843 | 3 619 925 | 3 583 288 | |
| Poland | PL | 38 463 689 | 38 441 588 | 38 415 284 | 38 383 809 | 38 346 279 | |
| Romania | RO | 21 959 278 | 21 904 551 | 21 848 504 | 21 790 479 | 21 729 871 | |
| Russian Federation | RU | 139 390 205 | 138 739 892 | 142 517 670 | 142 500 482 | 142 470 272 | |
| Slovakia | SK | 5 470 306 | 5 477 038 | 5 483 088 | 5 488 339 | 5 492 677 | |
| Ukraine | UA | 45 415 596 | 45 134 707 | 45 416 589 | 44 573 205 | 44 291 413 | |
| Total | 291 386 336 | 290 229 359 | 294 155 232 | 293 513 001 | 292 993 150 | ||
| Southern Europe | Albania | AL | 3 204 000 | 2 994 667 | 3 002 859 | 3 011 405 | 3 020 209 |
| Bosnia & Herzegovina | BA | 4 621 598 | 4 622 163 | 3 879 296 | 3 875 723 | 3 871 643 | |
| Croatia | HR | 4 486 881 | 4 483 804 | 4 480 043 | 4 475 611 | 4 470 534 | |
| Greece | GR | 10 749 943 | 10 760 136 | 10 767 827 | 10 772 967 | 10 775 557 | |
| Italy | IT | 60 748 965 | 61 016 804 | 61 261 254 | 61 482 297 | 61 680 122 | |
| Kosovo | XK | 1 815 048 | 1 825 632 | 1 836 529 | 1 847 708 | 1 859 203 | |
| Macedonia, FYR | MK | 2 072 086 | 2 077 328 | 2 082 370 | 2 087 171 | 2 091 719 | |
| Malta | MT | 406 771 | 408 333 | 409 836 | 411 277 | 412 655 | |
| Montenegro | ME | 666 730 | 661 807 | 657 394 | 653 474 | 650 036 | |
| Portugal | PT | 10 735 765 | 10 760 305 | 10 781 459 | 10 799 270 | 10 813 834 | |
| San Marino | SM | 31 477 | 31 817 | 32 140 | 32 448 | 32 742 | |
| Serbia | RS | 7 344 847 | 7 310 555 | 7 276 604 | 7 243 007 | 7 209 764 | |
| Slovenia | SI | 2 003 136 | 2 000 092 | 1 996 617 | 1 992 690 | 1 988 292 | |
| Spain | ES | 46 505 963 | 46 754 784 | 47 042 984 | 47 370 542 | 47 737 941 | |
| Total | 155 393 210 | 155 708 227 | 155 507 212 | 156 055 590 | 156 614 251 | ||
| Non-European ESC countries | Algeria | DZ | 33 769 669 | 34 994 937 | 37 367 226 | 38 087 812 | 38 813 722 |
| Armenia | AM | 2 966 802 | 2 967 975 | 2 970 495 | 3 064 267 | 3 060 927 | |
| Azerbaijan | AZ | 9 301 673 | 9 397 279 | 9 493 600 | 9 590 159 | 9 686 210 | |
| Cyprus | CY | 1 102 677 | 1 120 489 | 1 138 071 | 1 155 403 | 1 172 458 | |
| Egypt | EG | 80 471 869 | 82 079 636 | 83 688 164 | 85 294 388 | 86 895 099 | |
| Georgia | GE | 4 600 825 | 4 585 874 | 4 570 934 | 4 942 157 | 4 935 880 | |
| Israel | IL | 7 353 985 | 7 473 052 | 7 590 758 | 7 707 042 | 7 821 850 | |
| Kazakhstan | KZ | 17 084 817 | 17 304 513 | 17 736 896 | 17 736 896 | 17 948 816 | |
| Kyrgyzstan | KGZ | 5 410 468 | 5 450 776 | 5 496 737 | 5 548 042 | 5 604 212 | |
| Lebanon | LB | 4 125 247 | 4 143 101 | 4 140 289 | 4 131 583 | 4 136 895 | |
| Libya | LY | 6 173 579 | 6 597 960 | 5 613 380 | 6 002 347 | 6 244 174 | |
| Morocco | MA | 31 627 428 | 31 968 361 | 32 309 239 | 32 649 130 | 33 478 299 | |
| Syria | SY | 22 198 110 | 22 517 750 | 22 530 746 | 22 457 336 | 22 597 531 | |
| Tunisia | TN | 10 525 041 | 10 629 186 | 10 732 900 | 10 835 873 | 10 937 521 | |
| Turkey | TR | 77 804 122 | 78 785 548 | 79 749 461 | 80 694 485 | 81 619 392 | |
| Total | 314 516 312 | 320 016 437 | 325 128 896 | 329 896 920 | 334 952 986 | ||
| Total ESC countries | 56 | 1 049 971 891 | 1 055 247 659 | 1 065 535 801 | 1 071 549 273 | 1 077 479 440 |
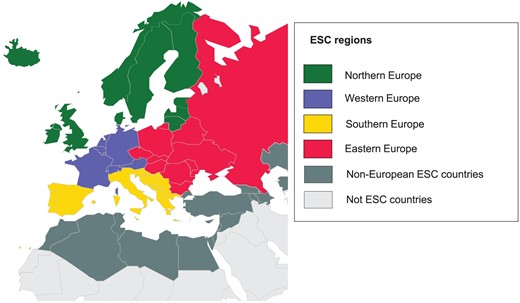
Geographic representation of the 56 ESC countries. The European regions were composed according to the UN Statistics Division (http://unstats.un.org/unsd/methods/m49/m49regin.htm).
Our analysis revealed that considerable differences in the CIED implantation and catheter ablation rates between the ESC member countries still exist. As in previous years, the mean CIED implantation and catheter ablation rates per million population were higher in the Western Europe than in the other regions. Altogether the mean numbers were lowest in the Eastern Europe and in the non-European ESC countries. However, in some countries with relative low gross domestic product (GDP) the procedure rates exceeded the average values by far suggesting that GDP is not the only driver for utilization of device therapies. In most non-European ESC countries, the number of catheter ablations was markedly lower than in the European ESC regions. Of particular interest was that the rate of atrial fibrillation (AF) catheter ablation was ∼10 times lower in the non-European vs. European ESC countries. Whether this is due to economic restrictions or to differences in patient selection criteria remains to be established.
European Heart Rhythm Association Certification and Training Fellowship Programmes play an important role with regard to EHRA's goal to promote unified standards for the training of cardiac rhythm management specialists and to assure high quality in arrhythmia care across the ESC area. Last year ∼300 physicians and allied professionals participated in the EHRA Certification Examination. The EHRA Training Fellowship committee awarded several grants for young physicians mainly from emerging economies to be trained in high-volume centres outside of their home country. In addition, last year a specific proctor programme was initiated in order to provide further education in the field of cardiac arrhythmia management.
European Heart Rhythm Association has collected information on the resources and characteristics of procedures performed throughout the ESC area in the field of cardiac arrhythmias for almost a decade. The White Book data have formed a backbone for many strategic initiatives and awareness activities of the EHRA. We hope that the current statistics together with economic information will help to us to direct more resources towards cardiac arrhythmia management and to promote EHRA's goal to champion equity of access to modern cardiac arrhythmia therapy.
Societal, financial, and economic aspects
In this section, we have provided an overview of the demographic and financial profile of the 56 ESC countries.
General information
Population and vital statistics and GDP in the 56 ESC countries are presented in Table 2. European Society of Cardiology countries are a heterogeneous group of nations with varying political, financial, and demographic characteristics. In addition, there are large variations in the organizational aspects of healthcare across the ESC member countries. Some countries provide national healthcare services with full coverage to the whole population while in others healthcare services are primarily delivered by commercial health insurance companies and coverage depends on private co-payments (Table 3).
Population and vital statistics and GPD in the 56 ESC SC countries
| Country | Population | Population growth rate (%) | Life expectancy at birth (years) | Death rate per 1000 population | GDP (×1000 billion USD) | GDP per capita (USD) | Total health expenditure as % of GDP | Total health expenditure per capita |
|---|---|---|---|---|---|---|---|---|
| Albania | 3 020 209 | 0.29 | 78.00 | 5.68 | 13.59 | 4900 | 5.98 | 293 |
| Algeria | 38 813 722 | 1.91 | 76.40 | N/A | 227.80 | 5886 | N/A | 59 |
| Armenia | 3 060 927 | −0.11 | 74.20 | 9.13 | 11.11 | 3373 | 4.50 | 152 |
| Austria | 8 223 062 | 0.02 | 80.20 | 9.12 | 436.07 | 51 183 | 11.48 | 5876 |
| Azerbaijan | 9 686 210 | 1.00 | 71.90 | 5.88 | 77.91 | 8303 | 5.40 | 448 |
| Belarus | 9 608 058 | −0.19 | 72.20 | 12.66 | 77.17 | 8195 | 5.04 | 413 |
| Belgium | 10 449 361 | 0.05 | 79.90 | 9.70 | 527.81 | 47 164 | 10.80 | 5094 |
| Bosnia & Herzegovina | 3 871 643 | −0.11 | 76.30 | 9.12 | 18.99 | 4905 | 9.90 | 486 |
| Bulgaria | 6 924 716 | −0.82 | 74.30 | 14.96 | 55.08 | 7648 | 7.42 | 567 |
| Croatia | 4 470 534 | −0.11 | 76.40 | 12.12 | 58.33 | 13 624 | 6.82 | 929 |
| Cyprus | 1 172 458 | 1.48 | 78.30 | 6.31 | 21.34 | 23 955 | 7.32 | 1753 |
| Czech Republic | 10 627 448 | 0.17 | 78.30 | 10.29 | 200.01 | 18 985 | 7.66 | 1454 |
| Denmark | 5 569 077 | 0.23 | 79.10 | 9.38 | 347.20 | 61 885 | 11.20 | 6931 |
| Egypt | 86 895 099 | 1.88 | 73.50 | N/A | 284.86 | 3337 | N/A | 33 |
| Estonia | 1 257 921 | −0.67 | 74.10 | 11.35 | 26.36 | 19 777 | 5.94 | 1175 |
| Finland | 5 268 799 | 0.05 | 79.70 | 9.38 | 276.28 | 50 451 | 9.16 | 4621 |
| France | 66 259 012 | 0.47 | 81.70 | 8.61 | 2902.33 | 45 384 | 11.76 | 5337 |
| Georgia | 4 935 880 | −0.13 | 75.70 | 10.71 | 16.13 | 3607 | 9.18 | 331 |
| Germany | 80 996 685 | −0.19 | 80.40 | 10.62 | 3820.46 | 47 201 | 11.28 | 5324 |
| Greece | 10 775 557 | 0.02 | 80.30 | 9.83 | 246.40 | 22 318 | 9.28 | 2071 |
| Hungary | 9 919 128 | −0.20 | 75.50 | 13.05 | 129.69 | 13 154 | 7.82 | 1029 |
| Iceland | 317 351 | 0.66 | 81.20 | 6.27 | 16.20 | 50 006 | 9.06 | 4531 |
| Ireland | 4 832 765 | 1.19 | 80.60 | 6.08 | 245.82 | 51 159 | 8.10 | 4144 |
| Israel | 7 821 850 | 1.49 | 81.30 | 5.24 | 304.98 | 37 914 | 7.52 | 2851 |
| Italy | 61 680 122 | 0.32 | 82.00 | 9.67 | 2129.28 | 35 512 | 9.18 | 3260 |
| Kazakhstan | 17 948 816 | 1.19 | 70.20 | 8.94 | 225.62 | 12 950 | 4.18 | 541 |
| Kosovo | 1 859 203 | 0.62 | 71.00 | N/A | 7.49 | N/A | N/A | 0 |
| Kyrgyzstan | 5 604 212 | 1.01 | 70.10 | 6.64 | 7.65 | 1342 | 7.14 | 96 |
| Latvia | 2 165 165 | −0.61 | 73.40 | 14.28 | 32.82 | 16 145 | 6.00 | 969 |
| Lebanon | 4 136 895 | 0.13 | 75.70 | N/A | 47.50 | 10 531 | N/A | 105 |
| Libyaa | 6 244 174 | 4.03 | 76.00 | N/A | 49.34 | 7942 | N/A | 79 |
| Lithuania | 3 505 738 | −0.29 | 76.00 | 12.81 | 48.72 | 16 476 | 6.66 | 1097 |
| Luxembourg | 520 672 | 1.13 | 80.00 | 7.18 | 63.93 | 116 752 | 6.86 | 8009 |
| FYR Macedonia | 2 091 719 | 0.22 | 75.80 | 9.30 | 10.92 | 5262 | 7.14 | 376 |
| Malta | 412 655 | 0.34 | 80.10 | 7.86 | 10.26 | 24 314 | 9.10 | 2213 |
| Moldovaa | 3 583 288 | −1.01 | 70.10 | 11.11 | 7.74 | 2176 | 11.72 | 255 |
| Montenegro | 650 036 | −0.53 | 78.30 | 9.29 | 4.66 | 7466 | 7.58 | 566 |
| Morocco | 33 478 299 | 2.54 | 76.50 | N/A | 112.55 | 3392 | 7.00 | 237 |
| Netherlands | 16 877 351 | 0.43 | 81.10 | 8.13 | 880.39 | 52 249 | 12.44 | 6500 |
| Norway | 5 147 792 | 1.22 | 81.60 | 8.35 | 511.60 | 99 295 | 9.02 | 8956 |
| Poland | 38 346 279 | −0.10 | 76.70 | 9.75 | 552.23 | 14 330 | 6.72 | 963 |
| Portugal | 10 813 834 | 0.13 | 79.00 | 9.77 | 228.17 | 21 748 | 9.46 | 2057 |
| Romania | 21 729 871 | −0.28 | 74.70 | 11.72 | 202.47 | 10 161 | 5.12 | 520 |
| Russian Federation | 142 470 272 | −0.02 | 70.20 | 14.20 | 2057.30 | 14 317 | 6.26 | 896 |
| San Marinoa | 32 742 | 0.91 | 83.20 | 7.34 | 1.86 | N/A | 6.54 | 0 |
| Serbia | 7 209 764 | −0.46 | 75.00 | 14.22 | 42.65 | 5924 | 10.48 | 621 |
| Slovakia | 5 492 677 | 0.08 | 76.40 | 9.84 | 100.11 | 18 480 | 7.80 | 1441 |
| Slovenia | 1 988 292 | −0.22 | 77.80 | 9.08 | 49.93 | 24 211 | 8.76 | 2121 |
| Spain | 47 737 941 | 0.78 | 81.50 | 8.41 | 1400.48 | 30 113 | 9.62 | 2897 |
| Sweden | 9 723 809 | 0.79 | 81.90 | 9.65 | 559.11 | 57 557 | 9.62 | 5537 |
| Switzerland | 8 061 516 | 0.82 | 82.40 | 8.01 | 679.03 | 84 344 | 11.30 | 9531 |
| Syriaa | 22 597 531 | 0.62 | 75.40 | N/A | N/A | N/A | N/A | 0 |
| Tunisia | 10 937 521 | 0.94 | 75.70 | N/A | 49.12 | 4467 | N/A | 45 |
| Turkey | 81 619 392 | 1.15 | 73.30 | 5.06 | 813.32 | 10 518 | 6.30 | 663 |
| Ukraine | 44 291 413 | −0.63 | 69.10 | 14.60 | 134.89 | 2979 | 7.56 | 225 |
| United Kingdom | 63 742 977 | 0.55 | 80.40 | 9.02 | 2847.60 | 44 141 | 9.44 | 4167 |
aThese four countries did not submit data for the EHRA White Book 2015.
Healthcare service and insurance systems in the 56 ESC countries
| Country | Basic insurance availability | Uninsured citizens (% of population) | Distribution of insurance modality (%) | Possibility to subscribe private health insurance plans | Co-payment necessary for therapies | ||||
|---|---|---|---|---|---|---|---|---|---|
| Public insurance | Private insurance | Private co-payment | ICD | PM | Ablation | ||||
| Albania | Yes | 30 | 100 | 0 | 0 | N/A | No | No | No |
| Algeria | Yes | 30 | 100 | 0 | 0 | Yes | No | No | No |
| Armenia | No | 75 | 0 | 100 | 0 | Yes | No | No | No |
| Austria | Yes | 2 | 65 | 0 | 35 | Yes | No | No | No |
| Azerbaijan | Yes | 0 | 80 | 10 | 10 | Yes | Yes | No | Yes |
| Belarus | Yes | 0 | 100 | N/A | N/A | Yes | No | No | No |
| Belgium | Yes | 1 | 90 | 0 | 10 | Yes | No | No | Yes |
| Bosnia & Herzegovina | No | 25 | 75 | 0 | 25 | No | N/A | N/A | N/A |
| Bulgaria | Yes | 20 | 75 | 1 | 24 | Yes | Yes | No | Yes |
| Croatia | Yes | 10 | 90 | 5 | 5 | Yes | No | No | No |
| Cyprus | Yes | 15 | 100 | 0 | 0 | Yes | No | No | No |
| Czech Republic | Yes | 0.1 | 99.8 | 0.1 | 0.1 | No | No | No | No |
| Denmark | Yes | 0 | 100 | 0 | 0 | Yes | No | No | No |
| Egypt | No | 33 | 64 | 1 | 35 | Yes | No | No | No |
| Estonia | Yes | 5 | 100 | 0 | 0 | Yes | No | No | No |
| Finland | Yes | 0 | 75.2 | 3 | 21.8 | Yes | No | No | No |
| France | Yes | 0 | 55 | 0 | 45 | No | No | No | No |
| Georgia | Yes | N/A | N/A | N/A | N/A | Yes | Yes | Yes | Yes |
| Germany | Yes | 1 | 87 | 11 | 2 | Yes | No | No | No |
| Greece | Yes | 20 | 89 | 10 | 1 | Yes | No | No | No |
| Hungary | Yes | 2 | 99 | 1 | 0 | Yes | No | No | No |
| Iceland | Yes | 0 | 100 | 0 | 0 | No | No | No | No |
| Ireland | Yes | 52 | 48 | 52 | 0 | Yes | No | No | No |
| Israel | Yes | 0 | 100 | 0 | 0 | Yes | No | No | No |
| Italy | Yes | 0 | 100 | 0 | 0 | Yes | No | No | No |
| Kazakhstan | No | N/A | N/A | N/A | N/A | Yes | No | No | No |
| Kosovo | No | N/A | N/A | N/A | N/A | N/A | N/A | N/A | N/A |
| Kyrgyzstan | Yes | N/A | N/A | N/A | N/A | No | Yes | Yes | Yes |
| Latvia | Yes | 0 | 82 | 18 | 0 | Yes | Yes | Yes | No |
| Lebanon | Yes | 30 | 25 | 25 | 10 | Yes | Yes | Yes | Yes |
| Libyaa | |||||||||
| Lithuania | Yes | N/A | N/A | N/A | N/A | Yes | No | No | No |
| Luxembourg | Yes | 0 | 100 | N/A | N/A | Yes | No | No | No |
| Macedonia, FYR | Yes | 10 | 80 | 10 | 10 | Yes | No | No | No |
| Malta | Yes | 0 | 90 | 0 | 10 | Yes | No | No | No |
| Moldovaa | |||||||||
| Montenegro | Yes | 0 | 100 | 0 | 0 | No | No | No | No |
| Morocco | No | 30 | 80 | 15 | 5 | Yes | No | No | No |
| Netherlands | Yes | 0 | 0 | 100 | 0 | Yes | No | No | No |
| Norway | Yes | 0 | 98 | 0 | 2 | Yes | No | No | No |
| Poland | Yes | 5 | 90 | 5 | 5 | Yes | No | No | No |
| Portugal | Yes | 0 | N/A | N/A | N/A | Yes | No | No | No |
| Romania | Yes | N/A | 100 | 0 | 0 | No | Yes | Yes | Yes |
| Russian Federation | Yes | N/A | 85 | 15 | N/A | Yes | No | Yes | No |
| San Marinoa | |||||||||
| Serbia | Yes | 0 | 100 | 0 | 0 | Yes | No | No | No |
| Slovakia | Yes | 0 | 72 | 28 | 0 | Yes | No | No | No |
| Slovenia | No | 1 | 4 | 0 | 96 | N/A | No | No | No |
| Spain | No | 5 | 83 | 15 | 2 | Yes | No | No | No |
| Sweden | Yes | 0 | 90 | 0 | 10 | Yes | No | No | No |
| Switzerland | Yes | 0 | 71 | 0 | 29 | Yes | No | No | No |
| Syriaa | |||||||||
| Tunisia | Yes | 10 | 90 | 5 | 5 | Yes | No | No | No |
| Turkey | Yes | 1 | 99 | 1 | N/A | Yes | No | No | No |
| Ukraine | No | N/A | N/A | N/A | N/A | Yes | No | No | No |
| United Kingdom | Yes | 0 | 89 | 11 | 0 | Yes | No | No | No |
aThese four countries did not submit data for the EHRA White Book 2015.
Medium to high quality data on cause of death are available in most ESC countries, although they are lacking in many other parts of the world.4 The World Health Organization (WHO) National Health Account Database5 has revealed important differences in the demographic and GDP data between the ESC countries. As an example, the life expectancy at birth varied from 69.1 years (Ukraine) to 83.2 years (San Marino). The death rate per 1000 population was lowest in Turkey (5.06%) and highest in Ukraine (14.60%). It is noteworthy that in most countries with life expectancy over 80 years, the GDP per capita is also relatively high (Table 2). Total GDP ranged from 2 (San Marino) to 3.820 (Germany) trillion US dollars (USD). The GDP per capita was almost 100 times higher in Luxembourg (116.752 USD) than in Kyrgyzstan (1.342 USD). Given these huge financial disparities, it was perhaps not surprising that there were large variations in device implantation rates and use of catheter ablation therapies across the ESC regions.
Healthcare resources
Healthcare expenditure per country is shown as percentage of the national GDP in Figure 2 and as expenditure per capita in Figure 3. In the ESC countries, the mean healthcare expenditure was 8.3% of the GDP. It was highest in the Netherlands (12.4%) and lowest in Kazakhstan (4.2%). Given the trend towards a progressive ageing of populations, there is pressure to increase the healthcare expenditure. Despite this, the mean healthcare expenditure per capita in the ESC area was reduced from 2.818 USD in 2011 to 2.509 USD in 2012. According to the WHO statistics, the healthcare expenditure per capita in the ESC area was highest in Switzerland (9531 USD) and lowest in Kyrgyzstan (96 USD). Hence, there was ∼100-fold difference between the lowest and the highest healthcare expenditure per capita.
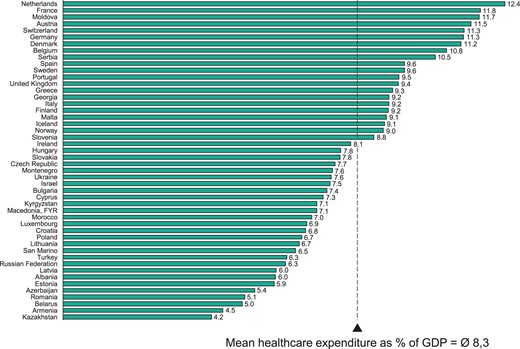
Healthcare expenditure as percentage of national GDP in the ESC member countries in 2012. The mean healthcare expenditure as % of GDP is weighted by population.
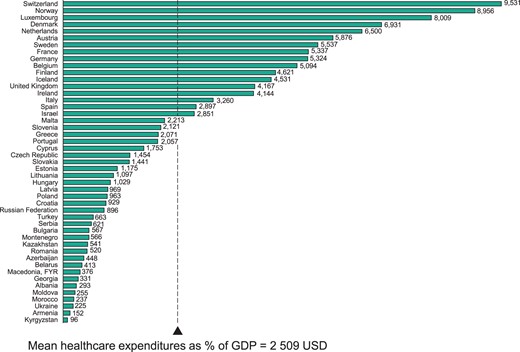
Healthcare expenditure per capita in the ESC countries in 2012. The mean number of expenditure is weighted by population.
The number of hospitals and hospital beds available for healthcare is shown in Figure 4. The number of hospitals and beds were not directly related to the financial profile of the countries or to healthcare expenditure. Rather, these data indicate that some countries have directed more resources towards hospital care than ambulatory and home care. For example, the number of beds per 100 000 inhabitants was 822 in Germany and only 271 in Sweden, despite the relatively high GDP and healthcare expenditure in both countries.
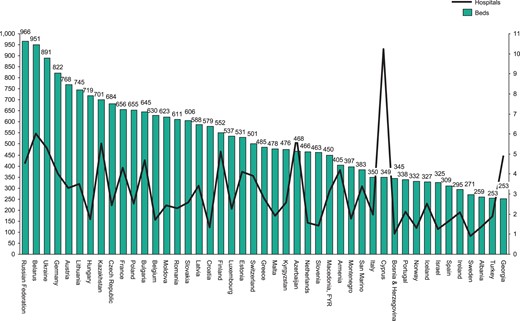
Hospitals and hospital beds per 100 000 inhabitants in the ESC countries.
In most ESC countries, patients provide minimum-to-no co-payment for invasive electrophysiology (EP) procedures (Table 3). In countries where a co-payment exists, it may be one of the factors limiting access to CIED and catheter ablation therapies. However, as both the financial profile and the organization of healthcare in the ESC countries are heterogeneous, the impact of co-payment to implementation of interventional electrophysiological procedures in clinical practice is rather difficult to evaluate.
Certification of professional excellence
General information
In 2014, 48 countries (86% of the ESC member countries) provided data on certification of physicians and allied professionals in device therapy and invasive EP for the EHRA White Book 2015.6 A national certification programme for device therapy for physicians was in use in 25 countries, and certification was mandatory in 12 countries (Figure 5). A national certification programme for invasive EP was available in 24 countries, and certification was an obligatory practice requirement in 13 countries (Figure 6). As shown in Figure 7, a national certification for allied professionals was available in 16 countries and was required for practice in 12 countries. Training centres were accredited in 17 (30%) countries, and certification of training centres was mandatory in order to train fellows in 9 countries (Figure 8). Several centres in various regions were available as training centres for the EHRA Training Fellowship Programme and allowed many young physicians from emerging economies to be trained in high-volume centres abroad.
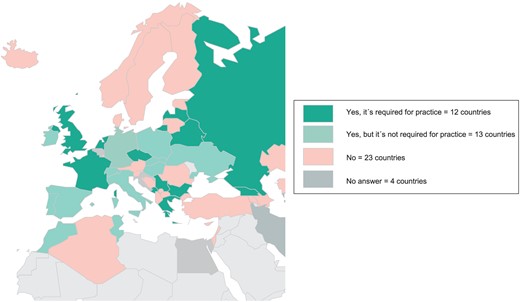
Certification for CIED therapy in the ESC countries in 2014.
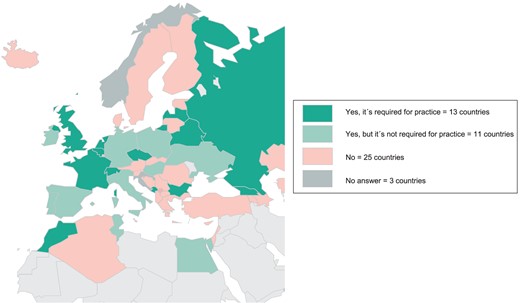
Certification for invasive EP in the ESC countries in 2014.
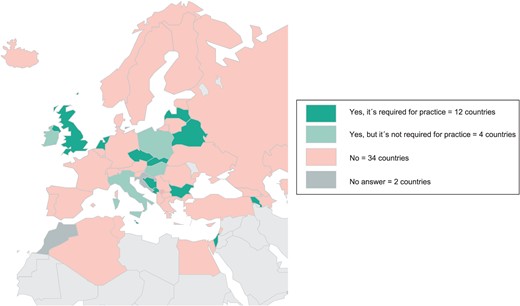
Certification for allied professionals in the ESC countries in 2014.
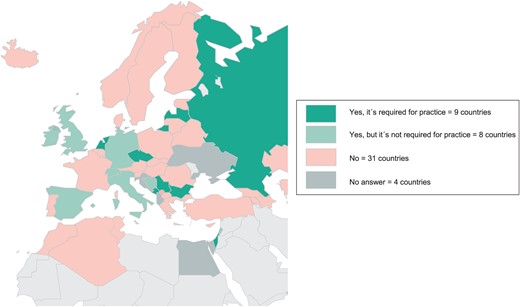
Certification for training centres in the ESC countries in 2014.
European Heart Rhythm Association certification
The EHRA certification programme is the first European certification of professional excellence in the field of CIED therapies and invasive EP. The programme is designed to test theoretical knowledge and practical experience of professionals in cardiac device therapy and EP. Between 2005 and 2014, more than 1900 physicians [1138 in cardiac pacing and implantable cardioverter-defibrillators (ICDs) and 792 in invasive cardiac EP] from 58 countries have participated in the EHRA examination. In 2014, the majority of the 115 participants was male (77% in the invasive EP examination and 80% in the CIED programme) and had 31–40 years of age. Over the years, the proportion of female candidates has increased from <10% to ∼25% (Figure 9). Last year, the highest number of candidates participating in the cardiac device therapy examination was from the Netherlands (27 candidates), Germany (17), and Switzerland (16). In the invasive EP examination, the highest numbers of participants were from Germany (18), Italy (17), and Spain (13).
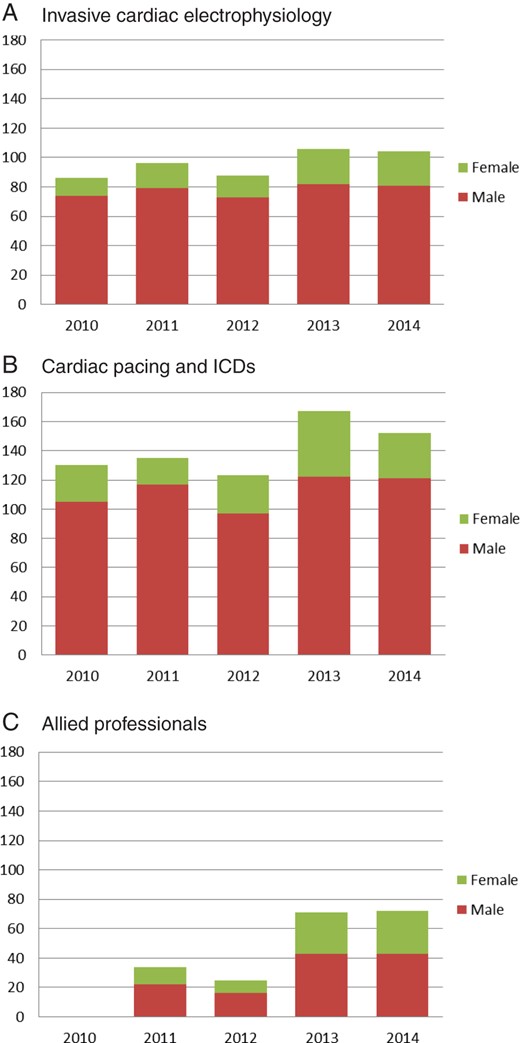
Number of participants in the EHRA examination during the last 5 years. ICD, implantable cardioverter-defibrillator.
The pass rate was 49% for physicians participating in the invasive EP examination and was 51% for those participating in the cardiac device therapy examination. These numbers are somewhat lower than the pass rates from previous years. For example, in 2013, the corresponding pass rates for invasive EP and cardiac device therapy were 62% and 71%, respectively. Since the introduction of the EHRA examination, more than 1000 physicians (659 in cardiac device therapy and 361 in invasive EP) have passed the exam and have reached first level certification. More than two-thirds of them have submitted the case logbook within the required time period and subsequently achieved full (level 2) certification.
Since the introduction in 2011 of the EHRA certification programme for allied professionals in cardiac device therapy, 144 candidates from 14 countries have participated in the EHRA examination and 116 of them passed the examination and achieved full certification. Last year, the pass rate in the allied professional exam was 78%, which was markedly higher than in 2013 (61%). Every year, most participants have been from the Netherlands. For allied professionals, the examination is currently available in six languages (English, Spanish, French, German, Italian, and Greek).
In summary, the EHRA White Book data indicate that there are still significant differences in training and certification requirements between the ESC countries. Accordingly, there is a need to involve more physicians and allied professionals in the EHRA certification system to assure uniform and high level theoretical and practical training for all healthcare professionals, regardless of their country of origin. This is especially important in the EU because of the freedom of movement for doctors and allied professionals within the EU area.
Pacemakers
General information
The 51 countries (91% of all ESC member countries) which submitted the requested data on pacemaker (PM) implantation for the EHRA White Book are listed in Table 4. A national registry for PM implantations existed in 20 countries (Table 4). The vast majority of implants was performed by cardiologists, and the remaining implantations were performed by physicians with various training backgrounds, including surgeons, anaesthesiologists, paediatricians, and internists. In four countries (Austria, Iceland, Slovenia, and Ukraine), the proportion of implanting cardiologists was 50% or less (Table 5).
Pacemaker implantation facilities and implantation rates in 2014 and comparison to four previous years
| Country | ISO code | National registry for PM implants | Number of PM implanting centres 2014 | PM implantations 2014 | Development potential—target number of PM implantations | PM implantations per mil inhabitants | |||||||
|---|---|---|---|---|---|---|---|---|---|---|---|---|---|
| Absolute number | Per mil inhabitants | Absolute number | Per mil inhabitants | To attain mean ESC area level | To attain mean EU28 level | 2010 | 2011 | 2012 | 2013 | 2014 | |||
| Albania | AL | No | 4 | 1 | 134 | 44 | 1528 | 2616 | N/A | N/A | N/A | N/A | 44 |
| Algeria | DZ | No | 19 | 0 | 2508 | 65 | 19 635 | 33 619 | N/A | N/A | N/A | 65 | 65 |
| Armenia | AM | No | 3 | 1 | 129 | 42 | 1548 | 2651 | 129 | 133 | 74 | 31 | 42 |
| Austria | AT | Yes | 57 | 7 | 8272 | 1006 | – | – | 939 | 950 | 957 | 967 | 1006 |
| Azerbaijan | AZ | No | 10 | 1 | 184 | 19 | 4900 | 8390 | N/A | 15 | N/A | 14 | 19 |
| Belarus | BY | Yes | 10 | 1 | 2970 | 309 | 4861 | 8322 | 237 | 258 | 275 | 292 | 309 |
| Belgium | BE | Yes | 104 | 10 | 12 912 | 1236 | – | – | 862 | N/A | 1228 | 1218 | 1236 |
| Bosnia & Herzegovina | BA | No | 5 | 1 | 831 | 215 | 1959 | 3353 | 167 | 138 | 234 | 224 | 215 |
| Bulgaria | BG | Yes | 17 | 2 | 3726 | 538 | – | 5998 | 345 | 385 | 448 | 503 | 538 |
| Croatia | HR | No | 18 | 4 | 2601 | 582 | – | 3872 | 522 | 565 | 561 | 540 | 582 |
| Cyprus | CY | No | 5 | 4 | 250 | 213 | 593 | 1016 | 209 | 223 | 211 | 216 | 213 |
| Czech Republic | CZ | Yes | 37 | 3 | 9447 | 889 | – | – | 873 | 881 | 899 | 887 | 889 |
| Denmark | DK | Yes | 11 | 2 | 4823 | 866 | – | 4824 | 749 | 795 | 841 | 850 | 866 |
| Egypt | EG | No | 33 | 0 | 3320 | 38 | 43 959 | 75 265 | 19 | N/A | 30 | 33 | 38 |
| Estonia | EE | No | 5 | 4 | 1054 | 838 | – | 1090 | 774 | 766 | 748 | 912 | 838 |
| Finland | FI | No | 20 | 4 | 5536 | 1051 | – | – | 936 | 923 | 990 | 1020 | 1051 |
| France | FR | No | 451 | 7 | 67 000 | 1011 | – | – | 991 | 969 | 958 | 910 | 1011 |
| Georgia | GE | No | 9 | 2 | 608 | 123 | 2497 | 4275 | 67 | 84 | 102 | 125 | 123 |
| Germany | DE | No | 980 | 12 | 93 315 | 1152 | – | – | 1267 | 1313 | 1311 | 1152 | 1152 |
| Greece | GR | No | 56 | 5 | 8000 | 742 | – | 9333 | 753 | 701 | 691 | 724 | 742 |
| Hungary | HU | Yes | 18 | 2 | 6393 | 645 | – | 8592 | 539 | 584 | 607 | 618 | 645 |
| Iceland | IS | No | 2 | 6 | 298 | 939 | – | – | 858 | 1006 | 967 | 996 | 939 |
| Ireland | IE | Yes | 17 | 4 | N/A | N/A | N/A | N/A | 404 | 507 | 451 | 479 | N/A |
| Israel | IL | No | 20 | 3 | 4200 | 537 | – | 6775 | N/A | 500 | 558 | 515 | 537 |
| Italy | IT | Yes | 433 | 7 | 63 442 | 1029 | – | – | 1044 | 1034 | 1001 | 1012 | 1029 |
| Kazakhstan | KZ | No | 22 | 1 | 2355 | 131 | 9080 | 15 547 | N/A | N/A | 69 | 84 | 131 |
| Kosovo | XK | No | 2 | 1 | 127 | 68 | 941 | 1610 | N/A | N/A | N/A | N/A | 68 |
| Kyrgyzstan | KGZ | N/A | 2 | 0 | 126 | 22 | 2835 | 4854 | N/A | N/A | N/A | N/A | 22 |
| Latvia | LV | Yes | 3 | 1 | 1236 | 571 | – | 1875 | 529 | 550 | 548 | 591 | 571 |
| Lebanon | LB | No | 15 | 4 | 900 | 218 | 2093 | 3583 | N/A | N/A | N/A | 218 | 218 |
| Libyaa | LY | N/A | N/A | N/A | N/A | N/A | N/A | N/A | N/A | N/A | N/A | N/A | N/A |
| Lithuania | LT | No | 4 | 1 | 2767 | 789 | – | 3037 | 671 | 714 | 756 | 772 | 789 |
| Luxembourg | LU | No | 5 | 10 | 349 | 670 | – | 451 | 183 | 336 | 621 | 365 | 670 |
| Macedonia, FYR | MK | No | 3 | 1 | 356 | 170 | 1058 | 1812 | 150 | 174 | 166 | 154 | 170 |
| Malta | MT | No | 1 | 2 | 366 | 887 | – | – | 703 | 740 | 644 | 552 | 887 |
| Moldovaa | MD | N/A | N/A | N/A | N/A | N/A | N/A | N/A | N/A | N/A | N/A | 79 | N/A |
| Montenegro | ME | No | 1 | 2 | 182 | 280 | 329 | 563 | 243 | 264 | 218 | 312 | 280 |
| Morocco | MA | Yes | 11 | 0 | 1465 | 44 | 16 936 | 28 998 | 35 | 39 | 38 | 34 | 44 |
| Netherlands | NL | Yes | 83 | 5 | 10 132 | 600 | – | 14 619 | 594 | 585 | 560 | 605 | 600 |
| Norway | NO | Yes | 23 | 4 | 3887 | 755 | – | 4459 | 708 | 675 | 691 | 680 | 755 |
| Poland | PL | No | 150 | 4 | 28 470 | 742 | – | 33 214 | 715 | 710 | 716 | 716 | 742 |
| Portugal | PT | Yes | 39 | 4 | 8830 | 817 | – | 9367 | 759 | 595 | 825 | 814 | 817 |
| Romania | RO | No | 24 | 1 | 4258 | 196 | 10 993 | 18 822 | 114 | 139 | 144 | 110 | 196 |
| Russian Federation | RU | Yes | 140 | 1 | 37 832 | 266 | 72 073 | 123 403 | 193 | 216 | 212 | 244 | 266 |
| San Marinoa | SM | N/A | N/A | N/A | N/A | N/A | N/A | N/A | 699 | 503 | 809 | 431 | N/A |
| Serbia | RS | Yes | 17 | 2 | 3657 | 507 | – | 6245 | 434 | 448 | 431 | 546 | 507 |
| Slovakia | SK | Yes | 13 | 2 | 3326 | 606 | – | 4758 | 547 | 617 | 567 | 630 | 606 |
| Slovenia | SI | Yes | 7 | 4 | 1464 | 736 | – | 1722 | 576 | 647 | 668 | 646 | 736 |
| Spain | ES | Yes | 230 | 5 | 36 322 | 761 | – | 41 349 | 755 | 734 | 738 | 749 | 761 |
| Sweden | SE | Yes | 45 | 5 | 9421 | 969 | – | – | 1005 | N/A | 1041 | 995 | 969 |
| Switzerland | CH | Yes | 76 | 9 | 6543 | 812 | – | 6983 | 745 | 791 | 753 | 763 | 812 |
| Syriaa | SY | N/A | N/A | N/A | N/A | N/A | N/A | N/A | N/A | N/A | N/A | N/A | N/A |
| Tunisia | TN | No | 20 | 2 | 2200 | 201 | 5533 | 9474 | 143 | 155 | 233 | N/A | 201 |
| Turkey | TR | No | N/A | N/A | 7300 | 89 | 41 290 | 70 696 | N/A | N/A | N/A | N/A | 89 |
| Ukraine | UA | No | 36 | 1 | 5258 | 119 | 22 406 | 38 364 | 103 | 112 | 121 | 148 | 119 |
| United Kingdom | GB | Yes | 207 | 3 | 45 131 | 708 | – | 55 212 | 597 | 610 | 615 | 702 | 708 |
| Total ESC countries | 56 | 3523 | 526 213 | ||||||||||
aThese four countries did not submit data for the EHRA White Book 2015.
Specialty of physicians performing device implantations and LEs in the 56 ESC countries
| Country | ISO code | Specialist performing PM implantations (%) | Specialist performing ICD implantations (%) | Specialist performing CRT implantations (%) | Specialist performing loop recorder implantations (%) | Specialist performing LEs (%) | ||||||||||
|---|---|---|---|---|---|---|---|---|---|---|---|---|---|---|---|---|
| Cardiologists | Surgeons | Other | Cardiologists | Surgeons | Other | Cardiologists | Surgeons | Other | Cardiologists | Surgeons | Other | Cardiologists | Surgeons | Other | ||
| Albania | AL | 100 | 0 | 0 | 100 | 0 | 0 | 100 | 0 | 0 | 0 | 0 | 0 | 0 | 0 | 0 |
| Algeria | DZ | 99 | 1 | 0 | 100 | 0 | 0 | 100 | 0 | 0 | 100 | 0 | 0 | 95 | 5 | 0 |
| Armenia | AM | 100 | 0 | 0 | 100 | 0 | 0 | 100 | 0 | 0 | 100 | 0 | 0 | 0 | 0 | 0 |
| Austria | AT | 50 | 50 | 0 | 10 | 90 | 0 | 50 | 50 | 0 | 80 | 20 | 0 | 10 | 90 | 0 |
| Azerbaijan | AZ | 64 | 36 | 0 | 100 | 0 | 0 | 100 | 0 | 0 | 100 | 0 | 0 | 100 | 0 | 0 |
| Belarus | BY | 0 | 100 | 0 | 0 | 100 | 0 | 0 | 100 | 0 | 0 | 100 | 0 | 0 | 100 | 0 |
| Belgium | BE | N/A | N/A | N/A | N/A | N/A | 0 | N/A | N/A | N/A | N/A | N/A | N/A | N/A | N/A | N/A |
| Bosnia & Herzegovina | BA | 80 | 20 | 0 | 80 | 20 | 0 | 100 | 0 | 0 | 100 | 0 | 0 | 50 | 50 | 0 |
| Bulgaria | BG | 99 | 1 | 0 | 100 | 0 | 0 | 100 | 0 | 0 | 100 | 0 | 0 | 100 | 0 | 0 |
| Croatia | HR | 91 | 9 | 0 | 100 | 0 | 0 | 94 | 6 | 0 | 100 | 0 | 0 | 67 | 33 | 0 |
| Cyprus | CY | 100 | 0 | 0 | 100 | 0 | 0 | 100 | 0 | 0 | 100 | 0 | 0 | 100 | 0 | 0 |
| Czech Republic | CZ | 90 | 10 | 0 | 95 | 5 | 0 | 97 | 3 | 0 | 100 | 0 | 0 | 80 | 20 | 0 |
| Denmark | DK | 100 | 0 | 0 | 100 | 0 | 0 | 100 | 0 | 0 | 100 | 0 | 0 | 85 | 15 | 0 |
| Egypt | EG | 76 | 2 | 22 | 90 | 0 | 10 | 70 | 0 | 30 | 80 | 0 | 20 | 80 | 0 | 20 |
| Estonia | EE | 100 | 0 | 0 | 100 | 0 | 0 | 100 | 0 | 0 | 100 | 0 | 0 | 100 | 0 | 0 |
| Finland | FI | 95 | 5 | 0 | 100 | 0 | 0 | 100 | 0 | 0 | 100 | 0 | 0 | 50 | 50 | 0 |
| France | FR | 95 | 5 | 0 | 100 | 0 | 0 | 100 | 0 | 0 | 100 | 0 | 0 | 80 | 20 | 0 |
| Georgia | GE | 90 | 10 | 0 | 100 | 0 | 0 | 100 | 0 | 0 | 100 | 0 | 0 | 100 | 0 | 0 |
| Germany | DE | N/A | N/A | 0 | N/A | N/A | N/A | N/A | N/A | N/A | N/A | N/A | N/A | N/A | N/A | N/A |
| Greece | GR | 97 | 3 | 0 | 98 | 2 | 0 | 98 | 2 | 0 | 100 | 0 | 0 | 90 | 10 | 0 |
| Hungary | HU | 90 | 5 | 5 | 95 | 2 | 3 | 95 | 2 | 3 | 100 | 0 | 0 | 95 | 5 | 0 |
| Iceland | IS | 50 | 50 | 0 | 50 | 50 | 0 | 75 | 25 | 0 | 100 | 0 | 0 | 50 | 50 | 0 |
| Ireland | IE | 100 | 0 | 0 | 100 | 0 | 0 | 100 | 0 | 0 | 100 | 0 | 0 | 50 | 50 | 0 |
| Israel | IL | 98 | 2 | 0 | 100 | 0 | 0 | 100 | 0 | 0 | 100 | 0 | 0 | 80 | 20 | 0 |
| Italy | IT | 100 | 0 | 0 | 100 | 0 | 0 | 100 | 0 | 0 | 100 | 0 | 0 | 100 | 0 | 0 |
| Kazakhstan | KZ | N/A | N/A | N/A | N/A | N/A | N/A | N/A | N/A | N/A | N/A | N/A | N/A | 0 | 0 | 0 |
| Kosovo | XK | 100 | 0 | 0 | 60 | 0 | 40 | 0 | 0 | 0 | 0 | 0 | 0 | 0 | 0 | 0 |
| Kyrgyzstan | KGZ | N/A | N/A | N/A | N/A | N/A | N/A | N/A | N/A | N/A | N/A | N/A | N/A | N/A | N/A | N/A |
| Latvia | LV | 70 | 30 | 0 | 70 | 30 | 0 | 70 | 30 | 0 | 70 | 30 | 0 | 0 | 100 | 0 |
| Lebanon | LB | 75 | 20 | 5 | 75 | 25 | 0 | 100 | 0 | 0 | 100 | 0 | 0 | 80 | 20 | 0 |
| Libyaa | LY | N/A | N/A | N/A | N/A | N/A | N/A | N/A | N/A | N/A | N/A | N/A | N/A | N/A | N/A | N/A |
| Lithuania | LT | 99 | 1 | 0 | 100 | 0 | 0 | 100 | 0 | 0 | 100 | 0 | 0 | 83 | 17 | 0 |
| Luxembourg | LU | 85 | 15 | 0 | 97 | 3 | 0 | 95 | 5 | 0 | 100 | 0 | 0 | 0 | 100 | 0 |
| Macedonia, FYR | MK | 100 | 0 | 0 | 100 | 0 | 0 | 100 | 0 | 0 | 100 | 0 | 0 | 0 | 100 | 0 |
| Malta | MT | 100 | 0 | 0 | 100 | 0 | 0 | 100 | 0 | 0 | 100 | 0 | 0 | 100 | 0 | 0 |
| Moldovaa | MD | N/A | N/A | N/A | N/A | N/A | N/A | N/A | N/A | N/A | N/A | N/A | N/A | N/A | N/A | N/A |
| Montenegro | ME | 60 | 40 | 0 | 50 | 50 | 0 | 100 | 0 | 0 | 50 | 50 | 0 | 0 | 0 | 0 |
| Morocco | MA | 98 | 2 | 0 | 98 | 2 | 0 | 99 | 1 | 0 | N/A | N/A | N/A | 99 | 1 | 0 |
| Netherlands | NL | 90 | 5 | 5 | 90 | 5 | 5 | 90 | 5 | 5 | 80 | 0 | 20 | 90 | 10 | 0 |
| Norway | NO | 99.55 | 0.45 | 0 | 100 | 0 | 0 | 100 | 0 | 0 | N/A | N/A | N/A | 100 | 0 | 0 |
| Poland | PL | 98 | 1 | 1 | 100 | 0 | 0 | 99 | 1 | 0 | 100 | 0 | 0 | 95 | 5 | 0 |
| Portugal | PT | 99 | 1 | 0 | 99 | 1 | 0 | 100 | 0 | 0 | 100 | 0 | 0 | N/A | N/A | 0 |
| Romania | RO | 99 | 1 | 0 | 100 | 0 | 0 | 100 | 0 | 0 | 100 | 0 | 0 | 100 | 0 | 0 |
| Russian Federation | RU | 70 | 30 | 0 | 70 | 30 | 0 | 60 | 40 | 0 | N/A | N/A | N/A | N/A | N/A | N/A |
| San Marinoa | SM | N/A | N/A | N/A | N/A | N/A | N/A | N/A | N/A | N/A | N/A | N/A | N/A | N/A | N/A | N/A |
| Serbia | RS | 95 | 5 | 0 | 100 | 0 | 0 | 100 | 0 | 0 | 100 | 0 | 0 | 80 | 20 | 0 |
| Slovakia | SK | 70 | 30 | 0 | 100 | 0 | 0 | 100 | 0 | 0 | 100 | 0 | 0 | 100 | 0 | 0 |
| Slovenia | SI | 10 | 90 | 0 | 35 | 65 | 0 | 100 | 0 | 0 | N/A | N/A | N/A | 0 | 100 | 0 |
| Spain | ES | 72 | 24 | 4 | 92 | 8 | 0 | 98 | 2 | 0 | 100 | 0 | 0 | 20 | 80 | 0 |
| Sweden | SE | N/A | N/A | N/A | N/A | N/A | N/A | N/A | N/A | N/A | N/A | N/A | N/A | N/A | N/A | N/A |
| Switzerland | CH | 98 | 2 | 0 | 99 | 1 | 0 | 100 | 0 | 0 | N/A | N/A | N/A | 50 | 50 | N/A |
| Syriaa | SY | N/A | N/A | N/A | N/A | N/A | N/A | N/A | N/A | N/A | N/A | N/A | N/A | N/A | N/A | N/A |
| Tunisia | TN | 95 | 5 | 0 | 100 | 0 | 0 | 100 | 0 | 0 | 100 | 0 | 0 | 40 | 60 | 0 |
| Turkey | TR | 97 | 3 | 0 | 99 | 1 | 0 | 99 | 1 | 0 | 100 | 0 | 0 | 75 | 25 | 0 |
| Ukraine | UA | 10.3 | 89.7 | 0 | 0 | 100 | 0 | 0 | 100 | 0 | 0 | 100 | 0 | 0 | 100 | 0 |
| United Kingdom | GB | 99 | 1 | 0 | 98 | 2 | 0 | 99 | 1 | 0 | 100 | 0 | 0 | N/A | N/A | N/A |
aThese four countries did not submit data for the EHRA White Book 2015.
Pacemaker facilities and procedure rate
It was reported that in 3523 centres, a total of 526 213 PMs were implanted in 2014 (Table 4) slightly up from last year. The mean number of centres implanting PMs per million inhabitants was 3.7 slightly lower than the preceding year (Figure 10). The country with the highest density of implanting facilities was Germany (12.1 per million in habitants) followed by Belgium (10.0) and those with the lowest density were Egypt and Kyrgyzstan both with 0.4 per million and Morocco with 0.3 implanting centres per million inhabitants.
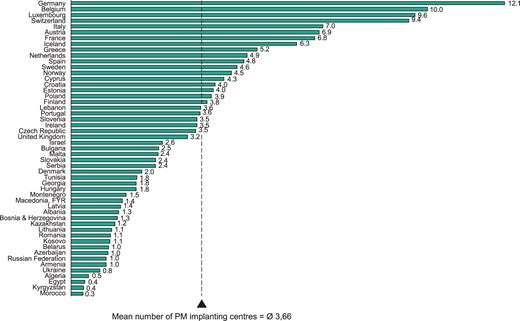
Number of PM implanting centres per million inhabitants in the ESC countries in 2014. The mean number of implantation centres is weighted by population.
In 2014, the mean PM implantation rate in the participating ESC countries was 506 PM units per million inhabitants. The implantation rates were highest in Belgium (1.236) and Germany (1.152), the two countries with the lowest implantation rate were Kyrgyzstan (22) and Azerbaijan (19). An overview of the PM implantation rate per million inhabitants for each country is shown in Figures 11 and 12. Across the 51 countries, marked heterogeneity was observed in the distribution of PM implantation rate per million inhabitants. This is in accordance with the White Book PM data from previous years.
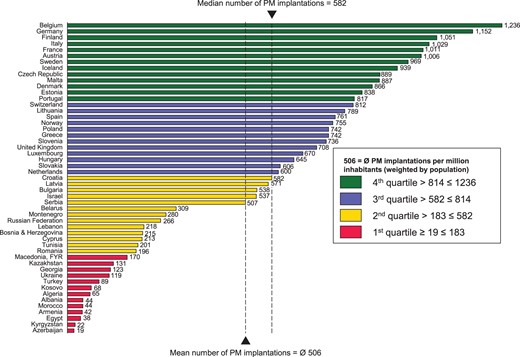
Pacemaker implantations per million inhabitants in the ESC countries in 2014. The mean number of implantations is weighted by population.
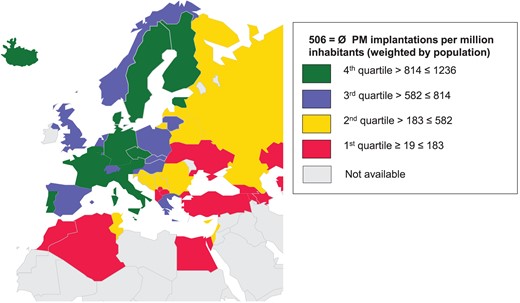
Pacemaker implantations per million inhabitants in the ESC countries in 2014. The mean number of implantations is weighted by population.
The number of PM implantations according to the five ESC regions and the trend in implantation rate with comparison to the 28 European Union member countries (EU28) and the whole ESC area from 2009 to 2013 are shown in Figure 13. Countries with the highest and lowest activities in each region as well as yearly trends are shown in Figures 14–18. The number of PM implantations per million inhabitants was highest in the Western Europe, and lowest in the Eastern Europe and in the non-European ESC countries. The most active countries in each region were Belgium (1.218 per million inhabitants), Finland (1.051), Italy (1.029), Czech Republic (887), and Israel (537). These countries were also the most active last year.
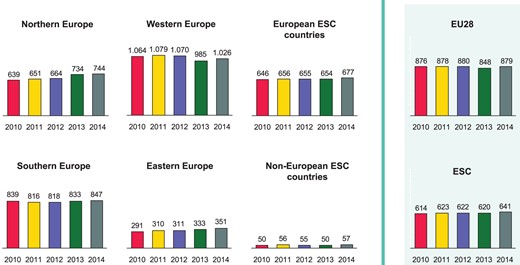
Pacemaker implantations per million inhabitants 2010–14 in the five geographical regions of the ESC and comparison to the total ESC area and the 28 member countries of the European Union (EU28).
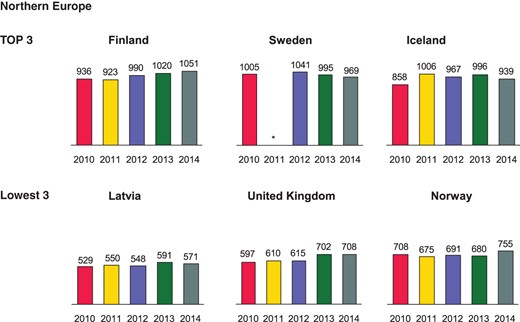
Pacemaker implantations per million inhabitants 2010–14 in Northern Europe. *No data available.
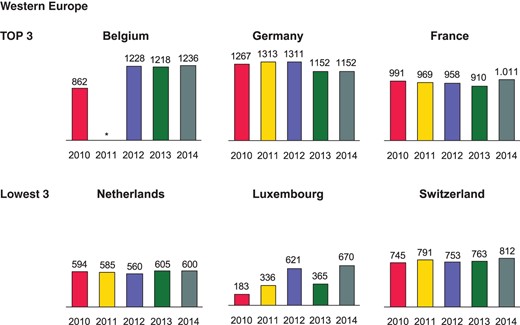
Pacemaker implantations per million inhabitants 2010–14 in Western Europe. *No data available.
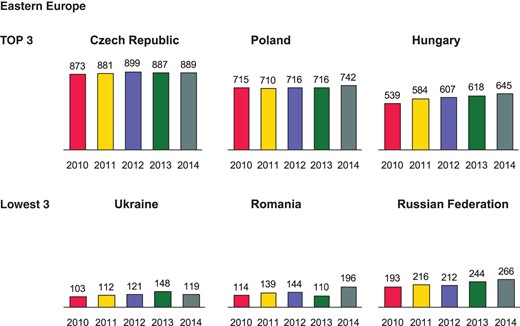
Pacemaker implantations per million inhabitants 2010–14 in Eastern Europe.
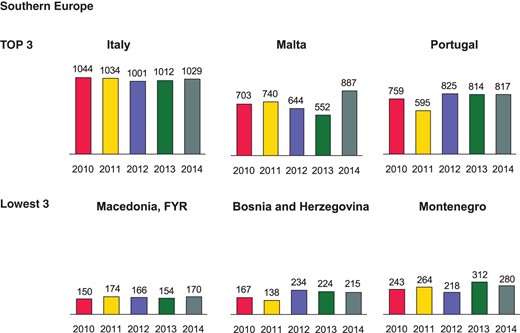
Pacemaker implantations per million inhabitants 2010–14 in Southern Europe.
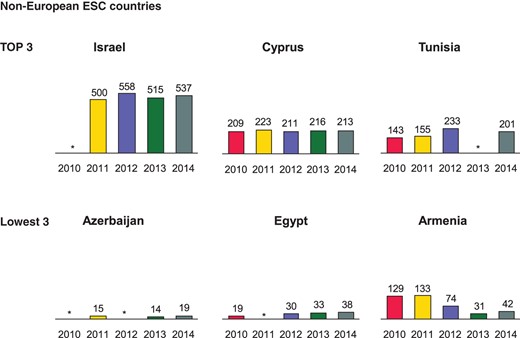
Pacemaker implantations per million inhabitants 2010–14 in the non-European ESC countries. *No data available.
The change in the number of implanting centres from 2013 to 2014 is presented in Table 6 and Figure 19, and the change in the number of PM implantations per million inhabitants during the same period is presented in Table 7 and Figure 20. The increase in the number of PM implantations was highest in Luxembourg (83.6%), Romania (77.9%), and Malta (60.7%). On the other hand, there was a 19.6% drop in the number of devices implanted in the Ukraine. The changes in the de novo PM implantation rate are shown separately in Figure 21 and for PM generator replacements in Figure 22. The relationship between the mean annual PM implantation rate per million inhabitants and the number of PM implanting centres per million inhabitants in the 56 ESC countries and in the EU28 is shown in Figure 23.
Changes in the number of PM implantation centres in year 2013 vs. 2014
| Country | ISO code | Number of PM implanting centres 2013 | Number of PM implanting centres 2014 | Change % | ||
|---|---|---|---|---|---|---|
| Absolute number | Per mil inhabitants | Absolute number | Per mil inhabitants | |||
| Albania | AL | N/A | N/A | 4 | 1.32 | N/A |
| Algeria | DZ | 19 | 0.50 | 19 | 0.49 | −1.9 |
| Armenia | AM | 2 | 0.65 | 3 | 0.98 | 50.2 |
| Austria | AT | 57 | 6.93 | 57 | 6.93 | 0.0 |
| Azerbaijan | AZ | 6 | 0.63 | 10 | 1.03 | 65.0 |
| Belarus | BY | 10 | 1.04 | 10 | 1.04 | 0.2 |
| Belgium | BE | 105 | 10.05 | 104 | 9.95 | −1.0 |
| Bosnia & Herzegovina | BA | 6 | 1.55 | 5 | 1.29 | −16.6 |
| Bulgaria | BG | 17 | 2.43 | 17 | 2.45 | 0.8 |
| Croatia | HR | 18 | 4.02 | 18 | 4.03 | 0.1 |
| Cyprus | CY | 5 | 4.33 | 5 | 4.26 | −1.5 |
| Czech Republic | CZ | 37 | 3.49 | 37 | 3.48 | −0.2 |
| Denmark | DK | 11 | 1.98 | 11 | 1.98 | −0.2 |
| Egypt | EG | 28 | 0.33 | 33 | 0.38 | 15.7 |
| Estonia | EE | 5 | 3.95 | 5 | 3.97 | 0.7 |
| Finland | FI | 20 | 3.80 | 20 | 3.80 | −0.1 |
| France | FR | 500 | 7.58 | 451 | 6.81 | −10.2 |
| Georgia | GE | 9 | 1.82 | 9 | 1.82 | 0.1 |
| Germany | DE | 1010 | 12.45 | 980 | 12.10 | −2.8 |
| Greece | GR | 56 | 5.20 | 56 | 5.20 | 0.0 |
| Hungary | HU | 17 | 1.71 | 18 | 1.81 | 6.1 |
| Iceland | IS | 2 | 6.34 | 2 | 6.30 | −0.7 |
| Ireland | IE | 17 | 3.56 | 17 | 3.52 | −1.2 |
| Israel | IL | 20 | 2.60 | 20 | 2.56 | −1.5 |
| Italy | IT | 420 | 6.83 | 433 | 7.02 | 2.8 |
| Kazakhstan | KZ | 27 | 1.52 | 22 | 1.23 | −19.5 |
| Kosovo | XK | N/A | N/A | 2 | 1.08 | N/A |
| Kyrgyzstan | KGZ | N/A | N/A | 2 | 0.36 | N/A |
| Latvia | LV | 3 | 1.38 | 3 | 1.39 | 0.6 |
| Lebanon | LB | 15 | 3.63 | 15 | 3.63 | −0.1 |
| Libyaa | LY | N/A | N/A | N/A | N/A | N/A |
| Lithuania | LT | 4 | 1.14 | 4 | 1.14 | 0.3 |
| Luxembourg | LU | 5 | 9.71 | 5 | 9.60 | −1.1 |
| Macedonia, FYR | MK | 2 | 0.96 | 3 | 1.43 | 49.7 |
| Malta | MT | 2 | 4.86 | 1 | 2.42 | −50.2 |
| Moldovaa | MD | 1 | 0.28 | N/A | N/A | N/A |
| Montenegro | ME | 1 | 1.53 | 1 | 1.54 | 0.5 |
| Morocco | MA | 11 | 0.34 | 11 | 0.33 | −2.5 |
| Netherlands | NL | 90 | 5.36 | 83 | 4.92 | −8.2 |
| Norway | NO | 23 | 4.52 | 23 | 4.47 | −1.2 |
| Poland | PL | 145 | 3.78 | 150 | 3.91 | 3.5 |
| Portugal | PT | 40 | 3.70 | 39 | 3.61 | −2.6 |
| Romania | RO | 22 | 1.01 | 24 | 1.10 | 9.4 |
| Russian Federation | RU | 140 | 0.98 | 140 | 0.98 | 0.0 |
| San Marinoa | SM | 1 | 30.82 | N/A | N/A | N/A |
| Serbia | RS | 18 | 2.49 | 17 | 2.36 | −5.1 |
| Slovakia | SK | 14 | 2.55 | 13 | 2.37 | −7.2 |
| Slovenia | SI | 8 | 4.01 | 7 | 3.52 | −12.3 |
| Spain | ES | 230 | 4.86 | 230 | 4.82 | −0.8 |
| Sweden | SE | 42 | 4.35 | 45 | 4.63 | 6.3 |
| Switzerland | CH | 76 | 9.50 | 76 | 9.43 | −0.8 |
| Syriaa | SY | N/A | N/A | N/A | N/A | N/A |
| Tunisia | TN | N/A | N/A | 20 | 1.83 | N/A |
| Turkey | TR | N/A | N/A | N/A | N/A | N/A |
| Ukraine | UA | 36 | 0.81 | 36 | 0.81 | 0.6 |
| United Kingdom | GB | 227 | 3.58 | 207 | 3.25 | −9.3 |
aThese four countries did not submit data for the EHRA White Book 2015.
Changes in the number of PM implantations in year 2013 vs. 2014
| Country | ISO code | Number of PM implantations 2013 | Number of PM implantations 2014 | Change % | ||
|---|---|---|---|---|---|---|
| Absolute number | Per mil inhabitants | Absolute number | Per mil inhabitants | |||
| Albania | AL | N/A | N/A | 134 | 44 | N/A |
| Algeria | DZ | 2480 | 65 | 2508 | 65 | −0.8 |
| Armenia | AM | 94 | 31 | 129 | 42 | 37.4 |
| Austria | AT | 7950 | 967 | 8272 | 1006 | 4.0 |
| Azerbaijan | AZ | 131 | 14 | 184 | 19 | 39.1 |
| Belarus | BY | 2813 | 292 | 2970 | 309 | 5.8 |
| Belgium | BE | 12 725 | 1218 | 12 912 | 1236 | 1.4 |
| Bosnia & Herzegovina | BA | 868 | 224 | 831 | 215 | −4.2 |
| Bulgaria | BG | 3511 | 503 | 3726 | 538 | 7.0 |
| Croatia | HR | 2418 | 540 | 2601 | 582 | 7.7 |
| Cyprus | CY | 250 | 216 | 250 | 213 | −1.5 |
| Czech Republic | CZ | 9416 | 887 | 9447 | 889 | 0.2 |
| Denmark | DK | 4725 | 850 | 4823 | 866 | 1.8 |
| Egypt | EG | 2850 | 33 | 3320 | 38 | 14.3 |
| Estonia | EE | 1155 | 912 | 1054 | 838 | −8.1 |
| Finland | FI | 5369 | 1020 | 5536 | 1051 | 3.1 |
| France | FR | 60 000 | 910 | 67 000 | 1011 | 11.1 |
| Georgia | GE | 620 | 125 | 608 | 123 | −1.8 |
| Germany | DE | 93 520 | 1152 | 93 315 | 1152 | 0.0 |
| Greece | GR | 7800 | 724 | 8000 | 742 | 2.5 |
| Hungary | HU | 6143 | 618 | 6393 | 645 | 4.3 |
| Iceland | IS | 314 | 996 | 298 | 939 | −5.7 |
| Ireland | IE | 2288 | 479 | N/A | N/A | N/A |
| Israel | IL | 3966 | 515 | 4200 | 537 | 4.3 |
| Italy | IT | 62 198 | 1012 | 63 442 | 1029 | 1.7 |
| Kazakhstan | KZ | 1489 | 84 | 2355 | 131 | 56.3 |
| Kosovo | XK | N/A | N/A | 127 | 68 | N/A |
| Kyrgyzstan | KGZ | N/A | N/A | 126 | 22 | N/A |
| Latvia | LV | 1288 | 591 | 1236 | 571 | −3.4 |
| Lebanon | LB | 900 | 218 | 900 | 218 | −0.1 |
| Libyaa | LY | N/A | N/A | N/A | N/A | N/A |
| Lithuania | LT | 2716 | 772 | 2767 | 789 | 2.2 |
| Luxembourg | LU | 188 | 365 | 349 | 670 | 83.6 |
| Macedonia, FYR | MK | 322 | 154 | 356 | 170 | 10.3 |
| Malta | MT | 227 | 552 | 366 | 887 | 60.7 |
| Moldovaa | MD | 287 | 79 | N/A | N/A | N/A |
| Montenegro | ME | 204 | 312 | 182 | 280 | −10.3 |
| Morocco | MA | 1109 | 34 | 1465 | 44 | 28.8 |
| Netherlands | NL | 10 174 | 605 | 10 132 | 600 | −0.8 |
| Norway | NO | 3459 | 680 | 3887 | 755 | 11.0 |
| Poland | PL | 27 500 | 716 | 28 470 | 742 | 3.6 |
| Portugal | PT | 8790 | 814 | 8830 | 817 | 0.3 |
| Romania | RO | 2400 | 110 | 4258 | 196 | 77.9 |
| Russian Federation | RU | 34 758 | 244 | 37 832 | 266 | 8.9 |
| San Marinoa | SM | 14 | 431 | N/A | N/A | N/A |
| Serbia | RS | 3958 | 546 | 3657 | 507 | −7.2 |
| Slovakia | SK | 3456 | 630 | 3326 | 606 | −3.8 |
| Slovenia | SI | 1287 | 646 | 1464 | 736 | 14.0 |
| Spain | ES | 35 500 | 749 | 36 322 | 761 | 1.5 |
| Sweden | SE | 9602 | 995 | 9421 | 969 | −2.7 |
| Switzerland | CH | 6097 | 763 | 6543 | 812 | 6.4 |
| Syriaa | SY | N/A | N/A | N/A | N/A | N/A |
| Tunisia | TN | N/A | N/A | 2200 | 201 | N/A |
| Turkey | TR | N/A | N/A | 7300 | 89 | N/A |
| Ukraine | UA | 6579 | 148 | 5258 | 119 | −19.6 |
| United Kingdom | GB | 44 503 | 702 | 45 131 | 708 | 0.9 |
aThese four countries did not submit data for the EHRA White Book 2015.
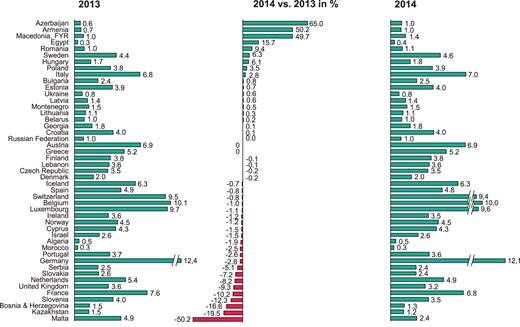
Change in the number of PM implanting centres per million inhabitants 2013–14.

Change in the number of PM implantations per million inhabitants 2013–14.
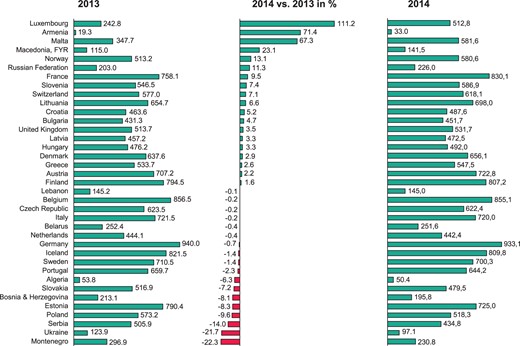
Change in the number of new PM implantations per million inhabitants 2013–14.
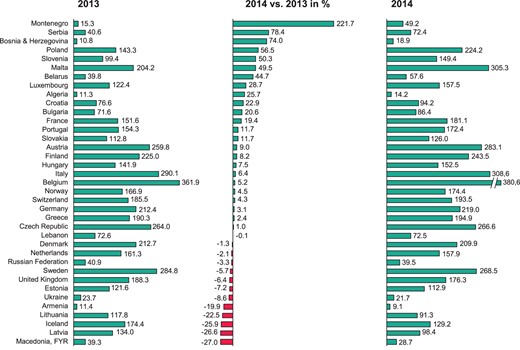
Change in the number of PM replacements per million inhabitants 2013–14.
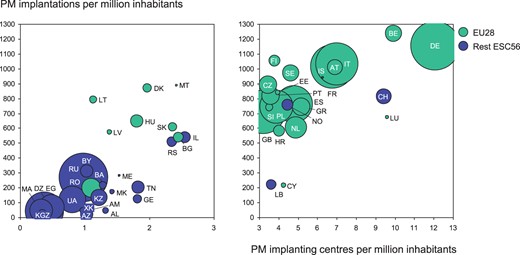
Pacemaker implantation centres and rates in the ESC and European Union (EU28) member countries in 2014. Bubble size is related to population in the country. The ISO codes of the countries are explained in Table 1.
Implantable cardioverter-defibrillators
General information
The 51 countries which submitted data for the EHRA White Book on ICDs in 2014 are listed in Table 8. Ireland, Libya, Moldova, San Marino, and Syria did not report data related to ICD implantations. In 25 countries, a national registry for ICD implantations was in use. The vast majority of implants was performed by cardiologists, and the remaining implantations were performed by physicians having various other training backgrounds, mainly surgical. However, in some countries (Austria, Slovenia, and Ukraine), the proportion of implanting cardiologists was <50% (Table 5).
Implantable cardioverter-defibrillator implantation facilities and rates in 2014 and comparison to four previous years
| Country | ISO code | National registry for ICD implants | Number of ICD implanting centres 2014 | ICD implantations 2014 | Development potential—target number of ICD implantations | ICD implantations per mil inhabitants | |||||||
|---|---|---|---|---|---|---|---|---|---|---|---|---|---|
| Absolute number | Per mil inhabitants | Absolute number | Per mil inhabitants | To attain mean ESC area level | To attain mean EU28 level | 2010 | 2011 | 2012 | 2013 | 2014 | |||
| Albania | AL | No | 2 | 0.66 | 4 | 1 | 306 | 543 | N/A | N/A | N/A | N/A | 1 |
| Algeria | DZ | No | 8 | 0.21 | 60 | 2 | 3933 | 6973 | N/A | N/A | N/A | 1 | 2 |
| Armenia | AM | No | 3 | 0.98 | 25 | 8 | 310 | 550 | 11 | 12 | N/A | 9 | 8 |
| Austria | AT | Yes | 21 | 2.55 | 1362 | 166 | – | 1477 | 154 | 220 | 145 | 158 | 166 |
| Azerbaijan | AZ | No | 7 | 0.72 | 20 | 2 | 981 | 1740 | 2 | 2 | N/A | 1 | 2 |
| Belarus | BY | Yes | 10 | 1.04 | 172 | 18 | 974 | 1726 | 6 | 14 | 12 | 16 | 18 |
| Belgium | BE | Yes | 23 | 2.20 | 1611 | 154 | – | 1877 | 194 | 197 | 210 | 163 | 154 |
| Bosnia & Herzegovina | BA | No | 5 | 1.29 | 55 | 14 | 392 | 696 | 7 | 13 | 14 | 17 | 14 |
| Bulgaria | BG | Yes | 9 | 1.30 | 47 | 7 | 702 | 1244 | 2 | 8 | 7 | 5 | 7 |
| Croatia | HR | No | 12 | 2.68 | 173 | 39 | 453 | 803 | 18 | 19 | 26 | 35 | 39 |
| Cyprus | CY | No | 4 | 3.41 | 73 | 62 | 119 | 211 | 44 | 58 | 46 | 52 | 62 |
| Czech Republic | CZ | Yes | 17 | 1.60 | 2138 | 201 | – | – | 258 | 270 | 277 | 301 | 201 |
| Denmark | DK | Yes | 6 | 1.08 | 1208 | 217 | – | – | 195 | 198 | 218 | 231 | 217 |
| Egypt | EG | No | 16 | 0.18 | 236 | 3 | 8805 | 15 611 | 1 | N/A | 2 | 2 | 3 |
| Estonia | EE | No | 2 | 1.59 | 96 | 76 | 127 | 226 | 40 | 45 | 79 | 82 | 76 |
| Finland | FI | No | 19 | 3.61 | 1161 | 220 | – | – | 154 | 134 | 166 | 194 | 220 |
| France | FR | No | 162 | 2.44 | 13 700 | 207 | – | – | 91 | 102 | 106 | N/A | 207 |
| Georgia | GE | No | 8 | 1.62 | 104 | 21 | 500 | 887 | 3 | 5 | 12 | 12 | 21 |
| Germany | DE | No | 670 | 8.27 | 23 898 | 295 | – | – | 307 | 326 | 326 | 336 | 295 |
| Greece | GR | No | 24 | 2.23 | 1080 | 100 | 1092 | 1936 | 90 | 83 | 87 | 97 | 100 |
| Hungary | HU | Yes | 13 | 1.31 | 956 | 96 | 1005 | 1782 | 72 | 80 | 85 | 95 | 96 |
| Iceland | IS | No | 1 | 3.15 | 59 | 186 | – | – | 81 | 113 | 134 | 171 | 186 |
| Ireland | IE | Yes | 17 | 3.52 | N/A | N/A | N/A | N/A | 130 | 140 | 144 | 153 | N/A |
| Israel | IL | Yes | 20 | 2.56 | 1685 | 215 | – | – | 180 | 156 | 137 | 166 | 215 |
| Italy | IT | Yes | 397 | 6.44 | 13 729 | 223 | – | – | 183 | 196 | 196 | 204 | 223 |
| Kazakhstan | KZ | No | 15 | 0.84 | 402 | 22 | 1819 | 3225 | N/A | N/A | 7 | 12 | 22 |
| Kosovo | XK | No | 1 | 0.54 | 3 | 2 | 188 | 334 | N/A | N/A | N/A | N/A | 2 |
| Kyrgyzstan | KGZ | N/A | 0 | 0.00 | 0 | 0 | 568 | 1007 | N/A | N/A | N/A | N/A | N/A |
| Latvia | LV | Yes | 3 | 1.39 | 75 | 35 | 219 | 389 | 21 | 29 | 32 | 40 | 35 |
| Lebanon | LB | No | 15 | 3.63 | 300 | 73 | 419 | 743 | N/A | N/A | N/A | 73 | 73 |
| Libyaa | LY | N/A | N/A | N/A | N/A | N/A | N/A | N/A | N/A | N/A | N/A | N/A | N/A |
| Lithuania | LT | No | 3 | 0.86 | 134 | 38 | 355 | 630 | 25 | 33 | 42 | 35 | 38 |
| Luxembourg | LU | Yes | 1 | 1.92 | 62 | 119 | – | 94 | 74 | 99 | 149 | 138 | 119 |
| Macedonia, FYR | MK | Yes | 2 | 0.96 | 11 | 5 | 42 | 74 | 7 | 13 | 7 | 6 | 5 |
| Malta | MT | No | 1 | 2.42 | 36 | 87 | 66 | 117 | 74 | 71 | 132 | 163 | 87 |
| Moldovaa | MD | N/A | N/A | N/A | N/A | N/A | N/A | N/A | N/A | N/A | N/A | 0 | N/A |
| Montenegro | ME | No | 1 | 1.54 | 41 | 63 | 1710 | 3032 | 27 | 47 | 44 | 58 | 63 |
| Morocco | MA | Yes | 7 | 0.21 | 27 | 1 | 522 | 925 | 1 | 1 | 1 | 1 | 1 |
| Netherlands | NL | Yes | 28 | 1.66 | 3577 | 212 | – | – | 169 | 155 | 160 | 244 | 212 |
| Norway | NO | Yes | 11 | 2.14 | 1134 | 220 | – | – | 130 | 184 | 199 | 214 | 220 |
| Poland | PL | No | 120 | 3.13 | 8399 | 219 | – | – | 183 | 157 | 182 | 234 | 219 |
| Portugal | PT | Yes | 31 | 2.87 | N/A | N/A | N/A | N/A | 75 | 95 | 92 | N/A | N/A |
| Romania | RO | No | 15 | 0.69 | 332 | 15 | 14 436 | 25 596 | 8 | 8 | 8 | 9 | 15 |
| Russian Federation | RU | Yes | 55 | 0.39 | 1769 | 12 | 3 | 6 | 4 | 10 | 11 | 13 | 12 |
| San Marinoa | SM | N/A | N/A | N/A | N/A | N/A | N/A | N/A | 635 | 597 | 404 | 616 | N/A |
| Serbia | RS | Yes | 10 | 1.39 | 457 | 63 | 557 | 987 | 38 | 44 | 38 | 62 | 63 |
| Slovakia | SK | Yes | 4 | 0.73 | 658 | 120 | – | 357 | 90 | 100 | 105 | 108 | 120 |
| Slovenia | SI | Yes | 2 | 1.01 | 174 | 88 | 4837 | 8576 | 50 | 72 | 61 | 71 | 88 |
| Spain | ES | Yes | 112 | 2.35 | 3869 | 81 | 985 | 1747 | 70 | 74 | 73 | 82 | 81 |
| Sweden | SE | Yes | 35 | 3.60 | 2097 | 216 | – | – | 118 | N/A | 193 | 198 | 216 |
| Switzerland | CH | Yes | 52 | 6.45 | 1341 | 166 | – | 4060 | 205 | 142 | 195 | 201 | 166 |
| Syriaa | SY | N/A | N/A | N/A | N/A | N/A | N/A | N/A | N/A | N/A | N/A | N/A | N/A |
| Tunisia | TN | No | 8 | 0.73 | 140 | 13 | 1108 | 1965 | 8 | 8 | 9 | N/A | 13 |
| Turkey | TR | No | N/A | N/A | 6300 | 77 | 8270 | 14 663 | N/A | N/A | N/A | N/A | 77 |
| Ukraine | UA | No | 8 | 0.18 | 57 | 1 | 4488 | 7957 | 1 | 1 | 1 | 2 | 1 |
| United Kingdom | GB | Yes | 126 | 1.98 | 6474 | 102 | – | 11 452 | 83 | 86 | 91 | 92 | 102 |
| Total ESC countries | 56 | 2142 | 101 521 | ||||||||||
aThese four countries did not submit data for the EHRA White Book 2015.
Implantable cardioverter-defibrillator facilities and procedure rates
It was reported that in 2142 national centres, a total of 101 521 ICDs (16% more than in 2013) were implanted in 2014 (Table 8). Table 8 also shows a comparison to previous years in each country. As seen in Figure 24, the mean number of implanting centres in the ESC area was 2.2 per country. In the ESC area, the mean number of ICD implantations per million inhabitants in 2014 was 99. In Figures 25 and 26, the ESC countries are grouped into quartiles according to the number of ICD implantations per million inhabitants. Germany (295 per million inhabitants), Italy (223), Finland (220), and Norway (220) had the highest implant rates while the lowest reported were in Albania, Morocco, and the Ukraine (1 per million inhabitants for each). Kyrgyzstan did not report any ICD implantations in 2014 (Table 8 and Figure 25).
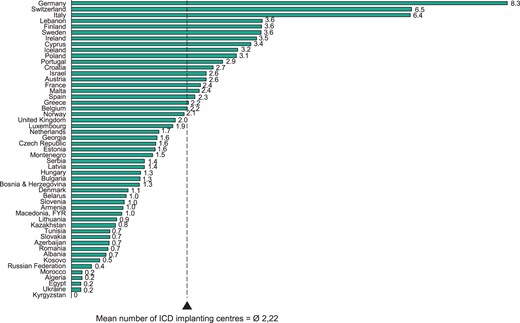
Implantable cardioverter-defibrillator implanting centres per million inhabitants in 2014. The mean number of implantation centres is weighted by population.
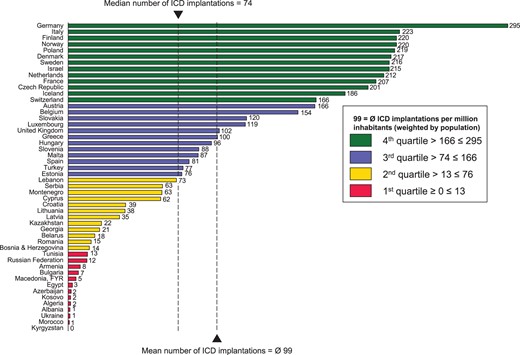
Implantable cardioverter-defibrillator implantations per million inhabitants in 2014. The mean number of implantations is weighted by population.
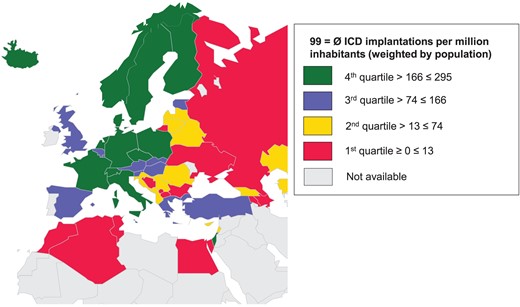
Implantable cardioverter-defibrillator implantations per million inhabitants in the ESC countries in 2014.
The number of ICD implantations according to the five ESC regions and the trend from 2009 to 2013, compared with the EU28 and the whole ESC area, are shown in Figure 27. In Western Europe (255), the number of ICD implantations per million inhabitants was almost twice as high as in any other ESC region. Implantable cardioverter-defibrillator implantation rate also exceed 100 per million population in the Southern (139) and Northern (119) European regions. The top and bottom three countries within the five ESC region are shown in Figures 28–32. The most active countries in each region were Germany (295 per million inhabitants), Finland and Norway (both 220), Poland (219), Italy (223), and Israel (215).
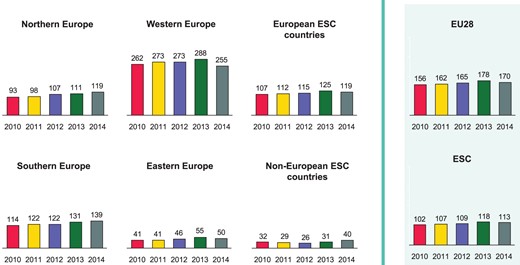
Implantable cardioverter-defibrillator implantations per million inhabitants 2010–14 in the five geographical regions of the ESC and comparison to the total ESC area and the 28 member countries of the European Union (EU28).
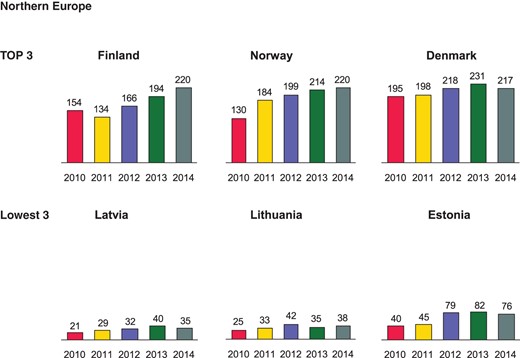
Implantable cardioverter-defibrillator implantations per million inhabitants 2010–14 in Northern Europe.
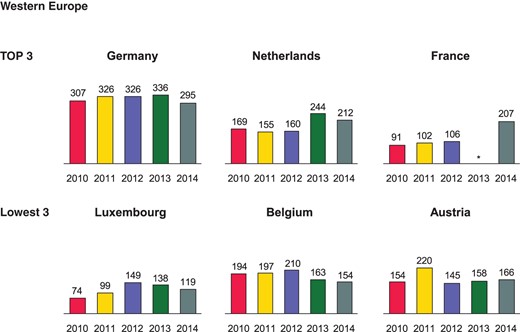
Implantable cardioverter-defibrillator implantations per million inhabitants 2010–14 in Western Europe. *No data available.
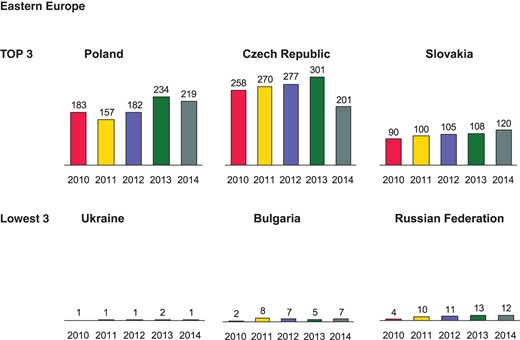
Implantable cardioverter-defibrillator implantations per million inhabitants 2010–14 in Eastern Europe.
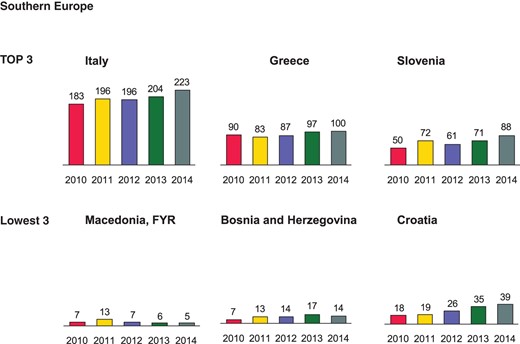
Implantable cardioverter-defibrillator implantations per million inhabitants 2010–14 in Southern Europe.
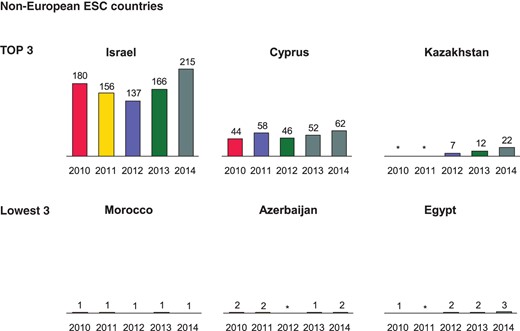
Implantable cardioverter-defibrillator implantations per million inhabitants 2010–14 in non-European ESC countries. *No data available.
The change in the number of implanting centres from 2013 to 2014 is shown in Table 9 and Figure 33, and the change in the number of ICD implantations per million inhabitants during the same period is presented in Table 10 and Figure 34. These numbers are divided into de novo implantations and ICD generator replacements in Figures 35 and 36. The increase in ICD implantations per million inhabitants was greatest in Kazakhstan. Georgia, Romania, Algeria, and Azerbaijan also reported a more than 50% increase in ICD implantations. On the other hand, four countries (Malta, the Czech Republic, Ukraine, and Morocco) reported a more than 20% drop in the ICD implantation rate per million population (Table 10 and Figure 34).
Changes in the number of ICD implantation centres in year 2013 vs. 2014
| Country | ISO code | Number of ICD implanting centres 2013 | Number of ICD implanting centres 2014 | Change % | ||
|---|---|---|---|---|---|---|
| Absolute number | Per mil inhabitants | Absolute number | Per mil inhabitants | |||
| Albania | AL | N/A | N/A | 2 | 0.66 | N/A |
| Algeria | DZ | 8 | 0.21 | 8 | 0.21 | −1.9 |
| Armenia | AM | 2 | 0.65 | 3 | 0.98 | 50.2 |
| Austria | AT | 21 | 2.55 | 21 | 2.55 | 0.0 |
| Azerbaijan | AZ | 2 | 0.21 | 7 | 0.72 | 246.5 |
| Belarus | BY | 10 | 1.04 | 10 | 1.04 | 0.2 |
| Belgium | BE | 23 | 2.20 | 23 | 2.20 | 0.0 |
| Bosnia & Herzegovina | BA | 5 | 1.29 | 5 | 1.29 | 0.1 |
| Bulgaria | BG | 8 | 1.15 | 9 | 1.30 | 13.4 |
| Croatia | HR | 12 | 2.68 | 12 | 2.68 | 0.1 |
| Cyprus | CY | 3 | 2.60 | 4 | 3.41 | 31.4 |
| Czech Republic | CZ | 17 | 1.60 | 17 | 1.60 | −0.2 |
| Denmark | DK | 6 | 1.08 | 6 | 1.08 | −0.2 |
| Egypt | EG | 13 | 0.15 | 16 | 0.18 | 20.8 |
| Estonia | EE | 2 | 1.58 | 2 | 1.59 | 0.7 |
| Finland | FI | 19 | 3.61 | 19 | 3.61 | −0.1 |
| France | FR | 148 | 2.24 | 162 | 2.44 | 9.0 |
| Georgia | GE | 7 | 1.42 | 8 | 1.62 | 14.4 |
| Germany | DE | 654 | 8.06 | 670 | 8.27 | 2.6 |
| Greece | GR | 24 | 2.23 | 24 | 2.23 | 0.0 |
| Hungary | HU | 14 | 1.41 | 13 | 1.31 | −7.0 |
| Iceland | IS | 1 | 3.17 | 1 | 3.15 | −0.7 |
| Ireland | IE | 17 | 3.56 | 17 | 3.52 | −1.2 |
| Israel | IL | 20 | 2.60 | 20 | 2.56 | −1.5 |
| Italy | IT | 365 | 5.94 | 397 | 6.44 | 8.4 |
| Kazakhstan | KZ | 12 | 0.68 | 15 | 0.84 | 23.5 |
| Kosovo | XK | N/A | N/A | 1 | 0.54 | N/A |
| Kyrgyzstan | KGZ | N/A | N/A | 0 | 0.00 | N/A |
| Latvia | LV | 2 | 0.92 | 3 | 1.39 | 50.9 |
| Lebanon | LB | 10 | 2.42 | 15 | 3.63 | 49.8 |
| Libyaa | LY | N/A | N/A | N/A | N/A | N/A |
| Lithuania | LT | 3 | 0.85 | 3 | 0.86 | 0.3 |
| Luxembourg | LU | 1 | 1.94 | 1 | 1.92 | −1.1 |
| Macedonia, FYR | MK | 2 | 0.96 | 2 | 0.96 | −0.2 |
| Malta | MT | 1 | 2.43 | 1 | 2.42 | −0.3 |
| Moldovaa | MD | 0 | 0.00 | N/A | N/A | N/A |
| Montenegro | ME | 1 | 1.53 | 1 | 1.54 | 0.5 |
| Morocco | MA | 5 | 0.15 | 7 | 0.21 | 36.5 |
| Netherlands | NL | 31 | 1.84 | 28 | 1.66 | −10.1 |
| Norway | NO | 11 | 2.16 | 11 | 2.14 | −1.2 |
| Poland | PL | 118 | 3.07 | 120 | 3.13 | 1.8 |
| Portugal | PT | 27 | 2.50 | 31 | 2.87 | 14.7 |
| Romania | RO | 17 | 0.78 | 15 | 0.69 | −11.5 |
| Russian Federation | RU | 57 | 0.40 | 55 | 0.39 | −3.5 |
| San Marinoa | SM | 1 | 30.82 | N/A | N/A | N/A |
| Serbia | RS | 8 | 1.10 | 10 | 1.39 | 25.6 |
| Slovakia | SK | 4 | 0.73 | 4 | 0.73 | −0.1 |
| Slovenia | SI | 2 | 1.00 | 2 | 1.01 | 0.2 |
| Spain | ES | 153 | 3.23 | 112 | 2.35 | −27.4 |
| Sweden | SE | 29 | 3.01 | 35 | 3.60 | 19.7 |
| Switzerland | CH | 46 | 5.75 | 52 | 6.45 | 12.1 |
| Syriaa | SY | N/A | N/A | N/A | N/A | N/A |
| Tunisia | TN | N/A | N/A | 8 | 0.73 | N/A |
| Turkey | TR | N/A | N/A | N/A | N/A | N/A |
| Ukraine | UA | 17 | 0.38 | 8 | 0.18 | −52.6 |
| United Kingdom | GB | 106 | 1.67 | 126 | 1.98 | 18.2 |
aThese four countries did not submit data for the EHRA White Book 2015.
Changes in the number of ICD implantations in year 2013 vs. 2014
| Country | ISO code | Number of ICD implants 2013 | Number of ICD implants 2014 | Change % | ||
|---|---|---|---|---|---|---|
| Absolute number | Per mil inhabitants | Absolute number | Per mil inhabitants | |||
| Albania | AL | N/A | N/A | 4 | 1.32 | N/A |
| Algeria | DZ | 38 | 1.00 | 60 | 1.55 | 54.9 |
| Armenia | AM | 28 | 9.14 | 25 | 8.17 | −10.6 |
| Austria | AT | 1296 | 157.63 | 1362 | 165.63 | 5.1 |
| Azerbaijan | AZ | 13 | 1.36 | 20 | 2.06 | 52.3 |
| Belarus | BY | 153 | 15.89 | 172 | 17.90 | 12.6 |
| Belgium | BE | 1704 | 163.15 | 1611 | 154.17 | −5.5 |
| Bosnia & Herzegovina | BA | 65 | 16.77 | 55 | 14.21 | −15.3 |
| Bulgaria | BG | 32 | 4.58 | 47 | 6.79 | 48.1 |
| Croatia | HR | 156 | 34.86 | 173 | 38.70 | 11.0 |
| Cyprus | CY | 60 | 51.93 | 73 | 62.26 | 19.9 |
| Czech Republic | CZ | 3196 | 301.23 | 2138 | 201.18 | −33.2 |
| Denmark | DK | 1285 | 231.26 | 1208 | 216.91 | −6.2 |
| Egypt | EG | 178 | 2.09 | 236 | 2.72 | 30.1 |
| Estonia | EE | 104 | 82.12 | 96 | 76.32 | −7.1 |
| Finland | FI | 1020 | 193.69 | 1161 | 220.35 | 13.8 |
| France | FR | N/A | N/A | 13 700 | 206.76 | N/A |
| Georgia | GE | 59 | 11.94 | 104 | 21.07 | 76.5 |
| Germany | DE | 27 241 | 335.70 | 23 898 | 295.05 | −12.1 |
| Greece | GR | 1050 | 97.47 | 1080 | 100.23 | 2.8 |
| Hungary | HU | 940 | 94.57 | 956 | 96.38 | 1.9 |
| Iceland | IS | 54 | 171.28 | 59 | 185.91 | 8.5 |
| Ireland | IE | 732 | 153.27 | N/A | N/A | N/A |
| Israel | IL | 1277 | 165.69 | 1685 | 215.42 | 30.0 |
| Italy | IT | 12 556 | 204.22 | 13 729 | 222.58 | 9.0 |
| Kazakhstan | KZ | 221 | 12.46 | 402 | 22.40 | 79.8 |
| Kosovo | XK | N/A | N/A | 3 | 1.61 | N/A |
| Kyrgyzstan | KGZ | N/A | N/A | 0 | 0.00 | N/A |
| Latvia | LV | 88 | 40.40 | 75 | 34.64 | −14.3 |
| Lebanon | LB | 300 | 72.61 | 300 | 72.52 | −0.1 |
| Libyaa | LY | N/A | N/A | N/A | N/A | N/A |
| Lithuania | LT | 124 | 35.27 | 134 | 38.22 | 8.4 |
| Luxembourg | LU | 71 | 137.90 | 62 | 119.08 | −13.7 |
| Macedonia, FYR | MK | 12 | 5.75 | 11 | 5.26 | −8.5 |
| Malta | MT | 67 | 162.91 | 36 | 87.24 | −46.4 |
| Moldovaa | MD | 0 | 0.00 | N/A | N/A | N/A |
| Montenegro | ME | 38 | 58.15 | 41 | 63.07 | 8.5 |
| Morocco | MA | 34 | 1.04 | 27 | 0.81 | −22.6 |
| Netherlands | NL | 4096 | 243.74 | 3577 | 211.94 | −13.0 |
| Norway | NO | 1089 | 214.13 | 1134 | 220.29 | 2.9 |
| Poland | PL | 8978 | 233.90 | 8399 | 219.03 | −6.4 |
| Portugal | PT | N/A | N/A | N/A | N/A | N/A |
| Romania | RO | 200 | 9.18 | 332 | 15.28 | 66.5 |
| Russian Federation | RU | 1870 | 13.12 | 1769 | 12.42 | −5.4 |
| San Marinoa | SM | 20 | 616.37 | N/A | N/A | N/A |
| Serbia | RS | 448 | 61.85 | 457 | 63.39 | 2.5 |
| Slovakia | SK | 591 | 107.68 | 658 | 119.80 | 11.2 |
| Slovenia | SI | 142 | 71.26 | 174 | 87.51 | 22.8 |
| Spain | ES | 3885 | 82.01 | 3869 | 81.05 | −1.2 |
| Sweden | SE | 1911 | 198.08 | 2097 | 215.66 | 8.9 |
| Switzerland | CH | 1604 | 200.60 | 1341 | 166.35 | −17.1 |
| Syriaa | SY | N/A | N/A | N/A | N/A | N/A |
| Tunisia | TN | N/A | N/A | 140 | 12.80 | N/A |
| Turkey | TR | N/A | N/A | 6300 | 77.19 | N/A |
| Ukraine | UA | 85 | 1.91 | 57 | 1.29 | −32.5 |
| United Kingdom | GB | 5809 | 91.63 | 6474 | 101.56 | 10.8 |
| Total ESC countries | 56 | |||||
aThese four countries did not submit data for the EHRA White Book 2015.
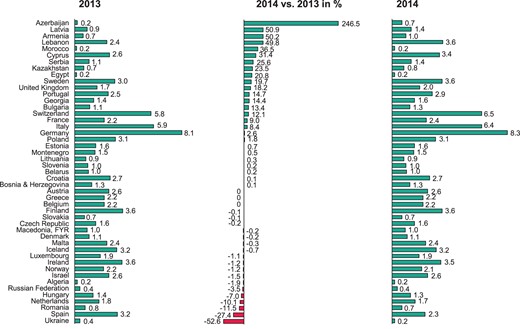
Change in the number of ICD implanting centres per million inhabitants from 2013 to 2014.
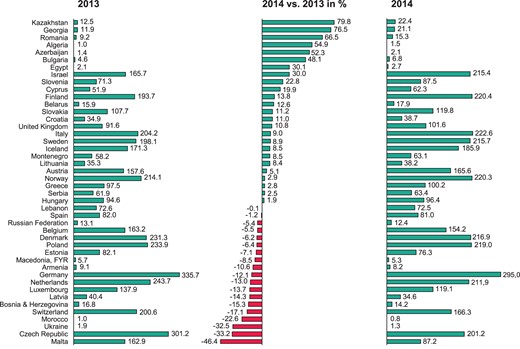
Change in the number of ICD implantations per million inhabitants from 2013 to 2014.
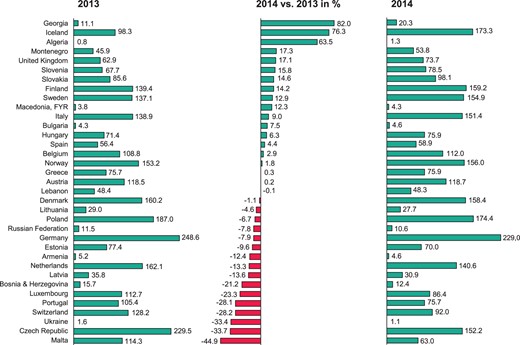
Change in the number of new ICD implantations per million inhabitants from 2013 to 2014.
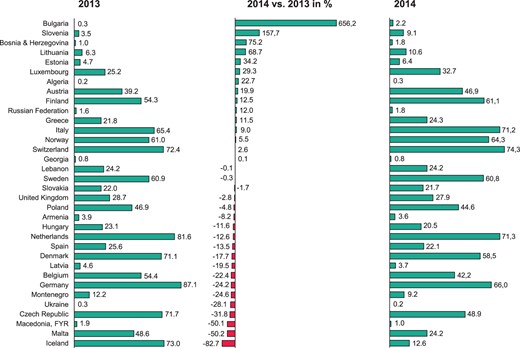
Change in the number of ICD replacements per million inhabitants from 2013 to 2014.
The relationship between the annual ICD implantation rate per million inhabitants and the number of ICD implanting centres per million inhabitants in the EU28 countries and the ESC area is shown in Figure 37.
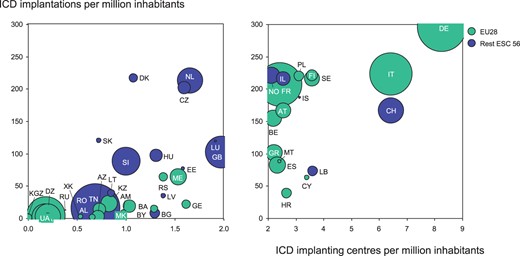
Implantable cardioverter-defibrillator implantation centres and rates in the ESC and European Union (EU28) member countries in 2014. Bubble size is related to population in the country. The ISO codes of the countries are explained in Table 1.
Cardiac resynchronization therapy devices
General information
The 51 countries which submitted data on cardiac resynchronization therapy (CRT) for the EHRA White Book 2015 are listed in Table 11. Ireland, Libya, San Marino, Moldova, and Syria did not report any data related to CRT therapy. The vast majority of implants was performed by cardiologists (Table 5), and the remaining implantations were performed by physicians having various other training backgrounds, mainly surgeons. In Ukraine, however, all implants were done by surgeons (Table 5).
Cardiac resynchronization therapy device (CRT-P and CRT-D) implantation facilities and rates in the ESC countries in 2014 and comparison to four previous years
| Country | ISO code | Number of CRT implanting centres 2014 | CRT implantations 2014 | Total CRT implantations 2014 | Development potential—target number of CRT implantations | CRT implantations per mil inhabitants | ||||||||
|---|---|---|---|---|---|---|---|---|---|---|---|---|---|---|
| Absolute number | Per mil inhabitants | CRT-P implantations Absolute number | CRT-D implantations Absolute number | Absolute number | Per mil inhabitants | To attain mean ESC area level | To attain mean EU28 level | 2010 | 2011 | 2012 | 2013 | 2014 | ||
| Albania | AL | 1 | 0.33 | 2 | 0 | 2 | 1 | 200 | 365 | N/A | N/A | N/A | N/A | 1 |
| Algeria | DZ | 8 | 0.21 | 20 | 36 | 56 | 1 | 2571 | 4694 | N/A | N/A | N/A | 2 | 1 |
| Armenia | AM | 3 | 0.98 | 0 | 4 | 4 | 1 | 203 | 370 | 2 | 3 | 6 | 3 | 1 |
| Austria | AT | 18 | 2.19 | 420 | 816 | 1236 | 150 | – | – | 122 | 117 | 107 | 143 | 150 |
| Azerbaijan | AZ | 3 | 0.31 | 0 | 18 | 18 | 2 | 642 | 1172 | 2 | 2 | N/A | 2 | 2 |
| Belarus | BY | 6 | 0.62 | N/A | N/A | 49 | 5 | 637 | 1162 | 4 | 5 | 4 | 6 | 5 |
| Belgium | BE | 40 | 3.83 | 458 | 874 | 1332 | 127 | – | – | 51 | 58 | 82 | 117 | 127 |
| Bosnia & Herzegovina | BA | 2 | 0.52 | 13 | 10 | 23 | 6 | 256 | 468 | 2 | 6 | 5 | 6 | 6 |
| Bulgaria | BG | 7 | 1.01 | 268 | 35 | 303 | 44 | 459 | 838 | 11 | 12 | 28 | 37 | 44 |
| Croatia | HR | 11 | 2.46 | 85 | 39 | 124 | 28 | 296 | 541 | 10 | 12 | 13 | 18 | 28 |
| Cyprus | CY | 4 | 3.41 | N/A | N/A | 29 | 25 | 78 | 142 | 29 | 21 | 25 | 22 | 25 |
| Czech Republic | CZ | 17 | 1.60 | 416 | 1456 | 1872 | 176 | – | – | 122 | 143 | 127 | 162 | 176 |
| Denmark | DK | 5 | 0.90 | 415 | 550 | 965 | 173 | – | – | 102 | 158 | 170 | 180 | 173 |
| Egypt | EG | 16 | 0.18 | 420 | 110 | 530 | 6 | 5757 | 10 510 | 3 | N/A | 4 | 5 | 6 |
| Estonia | EE | 2 | 1.59 | 27 | 24 | 51 | 41 | 83 | 152 | 40 | 58 | 53 | 55 | 41 |
| Finland | FI | 15 | 2.85 | 181 | 345 | 526 | 100 | – | 637 | 51 | 62 | 72 | 83 | 100 |
| France | FR | 146 | 2.20 | 3500 | 6070 | 9570 | 144 | – | – | 114 | 123 | 131 | N/A | 144 |
| Georgia | GE | 7 | 1.42 | 11 | 44 | 55 | 11 | 327 | 597 | 3 | 3 | 7 | 8 | 11 |
| Germany | DE | 670 | 8.27 | 3289 | 16 300 | 19 589 | 242 | – | – | 178 | 202 | 221 | 109 | 242 |
| Greece | GR | 16 | 1.48 | 80 | 500 | 580 | 54 | 714 | 1303 | 35 | 37 | 45 | 46 | 54 |
| Hungary | HU | 13 | 1.31 | 471 | 470 | 941 | 95 | – | 1200 | 83 | 81 | 89 | 99 | 95 |
| Iceland | IS | 1 | 3.15 | 16 | 10 | 26 | 82 | – | 38 | 36 | 48 | 32 | 44 | 82 |
| Ireland | IE | 17 | 3.52 | N/A | N/A | N/A | N/A | N/A | N/A | 48 | 57 | 61 | 79 | N/A |
| Israel | IL | 20 | 2.56 | 80 | 1250 | 1330 | 170 | – | – | 112 | 97 | 118 | 158 | 170 |
| Italy | IT | 378 | 6.13 | 2112 | 10 224 | 12 336 | 200 | – | – | 194 | 203 | 194 | 198 | 200 |
| Kazakhstan | KZ | 13 | 0.72 | N/A | N/A | 262 | 15 | 1189 | 2171 | N/A | N/A | 9 | 12 | 15 |
| Kosovo | XK | 0 | 0.00 | 0 | 0 | 0 | 0 | 123 | 225 | N/A | N/A | N/A | N/A | 0 |
| Kyrgyzstan | KGZ | 0 | 0.00 | 0 | 0 | 0 | 0 | 371 | 678 | N/A | N/A | N/A | N/A | 0 |
| Latvia | LV | 2 | 0.92 | 28 | 77 | 105 | 48 | 143 | 262 | 31 | 24 | 35 | 29 | 48 |
| Lebanon | LB | 15 | 3.63 | 10 | 150 | 160 | 39 | 274 | 500 | N/A | N/A | N/A | 24 | 39 |
| Libyaa | LY | N/A | N/A | N/A | N/A | N/A | N/A | N/A | N/A | N/A | N/A | N/A | N/A | N/A |
| Lithuania | LT | 3 | 0.86 | 160 | 32 | 192 | 55 | 232 | 424 | 20 | 31 | 39 | 47 | 55 |
| Luxembourg | LU | 1 | 1.92 | 10 | 24 | 34 | 65 | 34 | 63 | 40 | 40 | 59 | 43 | 65 |
| Macedonia, FYR | MK | 2 | 0.96 | 25 | 3 | 28 | 13 | 139 | 253 | 4 | 13 | 5 | 8 | 13 |
| Malta | MT | 1 | 2.42 | 5 | 43 | 48 | 116 | – | 50 | 61 | 56 | 83 | 39 | 116 |
| Moldovaa | MD | N/A | N/A | N/A | N/A | N/A | N/A | N/A | N/A | N/A | N/A | N/A | 0 | N/A |
| Montenegro | ME | 1 | 1.54 | 12 | 10 | 22 | 34 | 43 | 79 | 25 | 21 | 29 | 15 | 34 |
| Morocco | MA | 7 | 0.21 | 45 | 17 | 62 | 2 | 2218 | 4049 | N/A | N/A | 2 | 2 | 2 |
| Netherlands | NL | 31 | 1.84 | 514 | 1417 | 1931 | 114 | – | 2041 | 127 | 130 | 124 | 123 | 114 |
| Norway | NO | 10 | 1.94 | 197 | 317 | 514 | 100 | – | 623 | 72 | 88 | 77 | 84 | 100 |
| Poland | PL | 35 | 0.91 | 717 | 3001 | 3718 | 97 | – | 4638 | 61 | 66 | 73 | 78 | 97 |
| Portugal | PT | 24 | 2.22 | 178 | 518 | 696 | 64 | 716 | 1308 | 42 | 41 | 52 | N/A | 64 |
| Romania | RO | 12 | 0.55 | 166 | 123 | 289 | 13 | 1440 | 2628 | 10 | 10 | 7 | 9 | 13 |
| Russian Federation | RU | 42 | 0.29 | 45 | 818 | 863 | 6 | 9439 | 17 232 | 3 | 6 | 6 | 7 | 6 |
| San Marinoa | SM | N/A | N/A | N/A | N/A | N/A | N/A | N/A | N/A | 127 | 94 | 62 | 0 | N/A |
| Serbia | RS | 6 | 0.83 | 243 | 78 | 321 | 45 | 478 | 872 | 19 | 40 | 42 | 45 | 45 |
| Slovakia | SK | 6 | 1.09 | 136 | 393 | 529 | 96 | – | 664 | 74 | 60 | 61 | 82 | 96 |
| Slovenia | SI | 2 | 1.01 | 57 | 93 | 150 | 75 | – | 240 | 46 | 45 | 70 | 66 | 75 |
| Spain | ES | 130 | 2.72 | 949 | 2025 | 2974 | 62 | 3163 | 5774 | 41 | 56 | 53 | 54 | 62 |
| Sweden | SE | 15 | 1.54 | 308 | 546 | 854 | 88 | – | 1176 | 84 | N/A | 49 | 100 | 88 |
| Switzerland | CH | 48 | 5.95 | 208 | 375 | 583 | 72 | – | 975 | 74 | 74 | 66 | 60 | 72 |
| Syriaa | SY | N/A | N/A | N/A | N/A | N/A | N/A | N/A | N/A | N/A | N/A | N/A | N/A | N/A |
| Tunisia | TN | 8 | 0.73 | 120 | 60 | 180 | 16 | 725 | 1323 | 8 | 8 | 23 | N/A | 16 |
| Turkey | TR | N/A | N/A | 310 | 2150 | 2460 | 30 | 5407 | 9872 | N/A | N/A | N/A | N/A | 30 |
| Ukraine | UA | 9 | 0.20 | 72 | 13 | 85 | 2 | 2934 | 5357 | 1 | 1 | 1 | 2 | 2 |
| United Kingdom | GB | 129 | 2.02 | 4144 | 5372 | 9516 | 149 | – | – | 105 | 105 | 110 | 122 | 149 |
| TOTAL | 56 | 1978 | 20 943 | 56 840 | 78 123 | |||||||||
aThese four countries did not submit data for the EHRA White Book 2015.
Cardiac resynchronization therapy facilities and procedure rates
It was reported that in 2014, a total of 78 123 CRT devices were implanted in 1978 national centres (Table 11). There was an increase in both absolute numbers of implants and the rate of implants per million inhabitants compared with 2013 (Table 11). The absence of the French data in 2013 was likely a factor in this respect. The number of CRT implanting centres per million inhabitants in the ESC countries is shown in Figure 38. The mean number of implanting centres was 2.05 per country, which is a slight increase from the previous year. Germany (8.27), Italy (6.13), and Switzerland (5.95) had the highest density of centres implanting CRT devices.
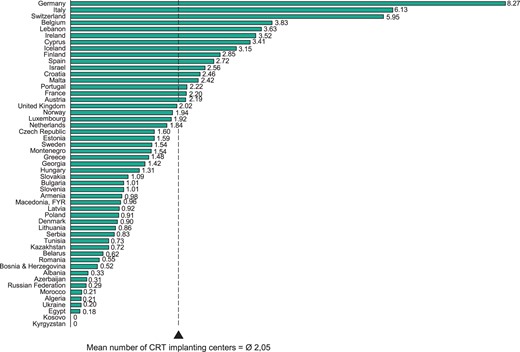
Cardiac resynchronization therapy device implanting centres per million inhabitants in 2014. The mean number of CRT implantation centres is weighted by population.
Implantation rates with the countries divided into quartiles are shown as a bar graph in Figure 39 and as a geographical map in Figure 40. Figures 41 and 42 show the corresponding numbers for CRT pacemakers (CRT-Ps) and CRT defibrillators (CRT-Ds). The ratio of CRT-D/CRT-P implants was 2.67 with a mean of 56 CRT-Ds and 21 CRT-Ps per million inhabitants. Cardiac resynchronization therapy defibrillator implantation rate was highest in Germany (201 per million inhabitants) followed by Italy (166), Israel (160), and the Czech Republic (137). Denmark had the highest rate of CRT-P implantations (75 per million inhabitants) followed by the United Kingdom, France, and Austria (Figure 41 and 42).
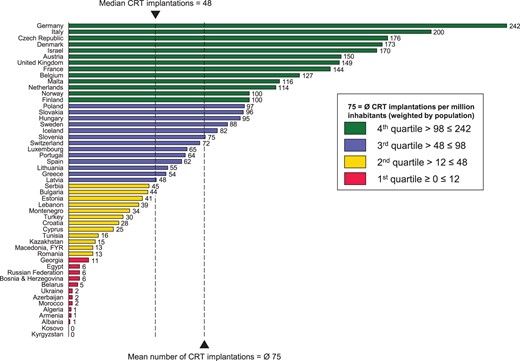
Cardiac resynchronization therapy device implantations per million inhabitants 2014. The mean number of CRT implantations is weighted by population.
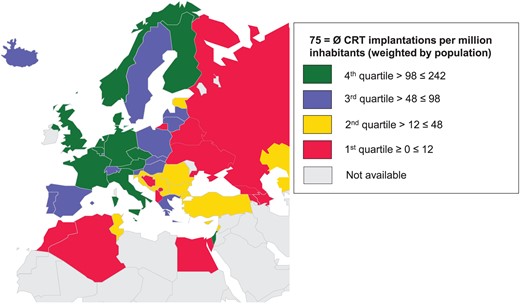
Cardiac resynchronization therapy device implantations per million inhabitants in the ESC countries in 2014.

Cardiac resynchronization therapy pacemaker implantations per million inhabitants in 2014. The mean number of implantations is weighted by population.
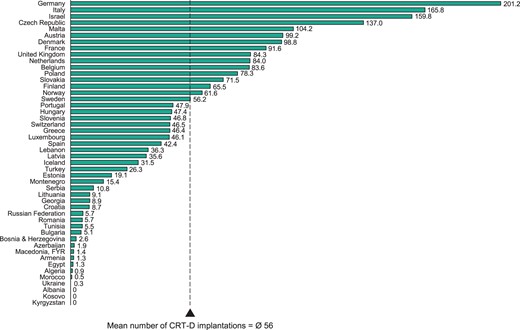
Cardiac resynchronization therapy defibrillator implantations per million inhabitants in 2014. The mean number of implantations is weighted by population.
The distribution of CRT implantations within the five geographical ESC regions is shown in Figure 43 and further data within each region are shown in Figures 44–48. The most active countries within each region were Germany (242 per million inhabitants), Denmark (173), the Czech Republic (176), Italy (200), and Israel (170).
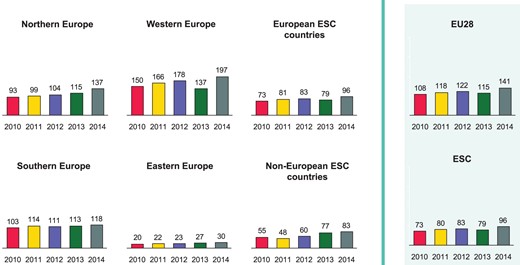
Cardiac resynchronization therapy device implantations per million inhabitants 2010–14 in the five geographical regions of the ESC and comparison to the total ESC area and the 28 member countries of the European Union (EU28).

Cardiac resynchronization therapy implantations per million inhabitants 2010–14 in Northern Europe.
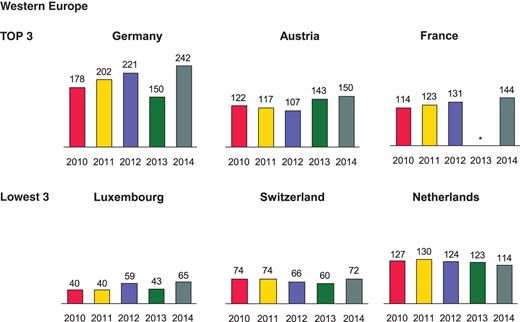
Cardiac resynchronization therapy implantations per million inhabitants 2010–14 in Western Europe. *No data available.
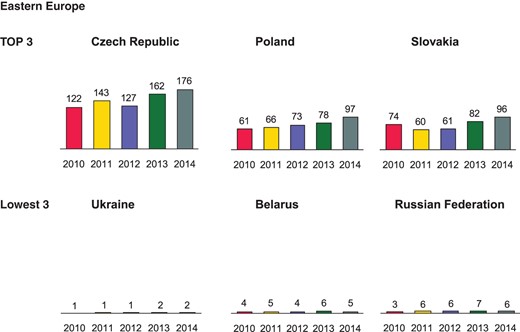
Cardiac resynchronization therapy implantations per million inhabitants 2010–14 in Eastern Europe.
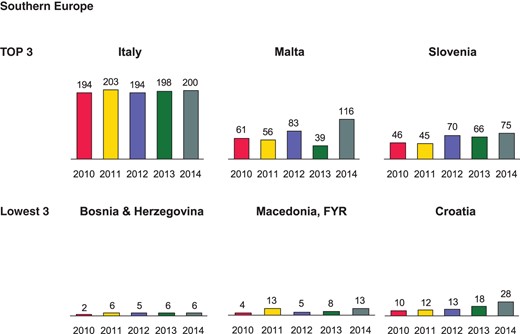
Cardiac resynchronization therapy implantations per million inhabitants 2010–14 in Southern Europe.
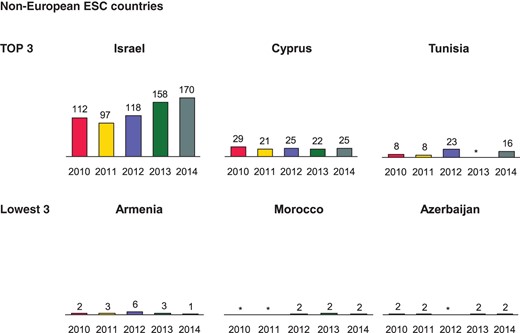
Cardiac resynchronization therapy implantations per million inhabitants 2010–14 in non-European ESC countries. *No data available.
The changes in the number of implanting centres per million inhabitants between 2013 and 2014 are shown in Table 12 and Figure 49. The changes between 2013 and 2014 in the number of total CRT implantations are shown in Table 13 and Figure 50, and the change according to CRT device type is shown in Figures 51 and 52. By far the highest growth rate in CRT device implantations per million was in Malta, with a reported almost 200% increase between the last 2 years. Montenegro (121.2%) and Iceland (84.5%) both reported significant increases in the number of CRT device implantations. In contrast, the number of CRT implantations decreased by 60% in Armenia and by 26.7% in Estonia.
Changes in the number of CRT device implanting centres in year 2013 vs. 2014
| Country | ISO code | Number of CRT implanting centres 2013 | Number of CRT implanting centres 2014 | Change % | ||
|---|---|---|---|---|---|---|
| Absolute number | Per mil inhabitants | Absolute number | Per mil inhabitants | |||
| Albania | AL | N/A | N/A | 1 | 0.33 | N/A |
| Algeria | DZ | 8 | 0.21 | 8 | 0.21 | −1.9 |
| Armenia | AM | 2 | 0.65 | 3 | 0.98 | 50.2 |
| Austria | AT | 18 | 2.19 | 18 | 2.19 | 0.0 |
| Azerbaijan | AZ | 2 | 0.21 | 3 | 0.31 | 48.5 |
| Belarus | BY | 5 | 0.52 | 6 | 0.62 | 20.2 |
| Belgium | BE | 35 | 3.35 | 40 | 3.83 | 14.2 |
| Bosnia & Herzegovina | BA | 2 | 0.52 | 2 | 0.52 | 0.1 |
| Bulgaria | BG | 8 | 1.15 | 7 | 1.01 | −11.8 |
| Croatia | HR | 7 | 1.56 | 11 | 2.46 | 57.3 |
| Cyprus | CY | 3 | 2.60 | 4 | 3.41 | 31.4 |
| Czech Republic | CZ | 17 | 1.60 | 17 | 1.60 | −0.2 |
| Denmark | DK | 5 | 0.90 | 5 | 0.90 | −0.2 |
| Egypt | EG | 13 | 0.15 | 16 | 0.18 | 20.8 |
| Estonia | EE | 2 | 1.58 | 2 | 1.59 | 0.7 |
| Finland | FI | 14 | 2.66 | 15 | 2.85 | 7.1 |
| France | FR | 159 | 2.41 | 146 | 2.20 | −8.6 |
| Georgia | GE | 6 | 1.21 | 7 | 1.42 | 16.8 |
| Germany | DE | 465 | 5.73 | 670 | 8.27 | 44.4 |
| Greece | GR | 16 | 1.49 | 16 | 1.48 | 0.0 |
| Hungary | HU | 13 | 1.31 | 13 | 1.31 | 0.2 |
| Iceland | IS | 1 | 3.17 | 1 | 3.15 | −0.7 |
| Ireland | IE | 17 | 3.56 | 17 | 3.52 | −1.2 |
| Israel | IL | 20 | 2.60 | 20 | 2.56 | −1.5 |
| Italy | IT | 361 | 5.87 | 378 | 6.13 | 4.4 |
| Kazakhstan | KZ | 9 | 0.51 | 13 | 0.72 | 42.7 |
| Kosovo | XK | N/A | N/A | 0 | 0.00 | N/A |
| Kyrgyzstan | KGZ | N/A | N/A | 0 | 0.00 | N/A |
| Latvia | LV | 2 | 0.92 | 2 | 0.92 | 0.6 |
| Lebanon | LB | 5 | 1.21 | 15 | 3.63 | 199.6 |
| Libyaa | LY | N/A | N/A | N/A | N/A | N/A |
| Lithuania | LT | 3 | 0.85 | 3 | 0.86 | 0.3 |
| Luxembourg | LU | 1 | 1.94 | 1 | 1.92 | −1.1 |
| Macedonia, FYR | MK | 2 | 0.96 | 2 | 0.96 | −0.2 |
| Malta | MT | 1 | 2.43 | 1 | 2.42 | −0.3 |
| Moldovaa | MD | 0 | 0.00 | N/A | N/A | N/A |
| Montenegro | ME | 1 | 1.53 | 1 | 1.54 | 0.5 |
| Morocco | MA | 5 | 0.15 | 7 | 0.21 | 36.5 |
| Netherlands | NL | 57 | 3.39 | 31 | 1.84 | −45.8 |
| Norway | NO | 9 | 1.77 | 10 | 1.94 | 9.8 |
| Poland | PL | 25 | 0.65 | 35 | 0.91 | 40.1 |
| Portugal | PT | 26 | 2.41 | 24 | 2.22 | −7.8 |
| Romania | RO | 17 | 0.78 | 12 | 0.55 | −29.2 |
| Russian Federation | RU | 42 | 0.29 | 42 | 0.29 | 0.0 |
| San Marinoa | SM | 1 | 30.82 | N/A | N/A | N/A |
| Serbia | RS | 6 | 0.83 | 6 | 0.83 | 0.5 |
| Slovakia | SK | 5 | 0.91 | 6 | 1.09 | 19.9 |
| Slovenia | SI | 2 | 1.00 | 2 | 1.01 | 0.2 |
| Spain | ES | 130 | 2.74 | 130 | 2.72 | −0.8 |
| Sweden | SE | N/A | N/A | 15 | 1.54 | N/A |
| Switzerland | CH | 31 | 3.88 | 48 | 5.95 | 53.6 |
| Syriaa | SY | N/A | N/A | N/A | N/A | N/A |
| Tunisia | TN | N/A | N/A | 8 | 0.73 | N/A |
| Turkeya | TR | N/A | N/A | N/A | N/A | N/A |
| Ukraine | UA | 13 | 0.29 | 9 | 0.20 | −30.3 |
| United Kingdom | GB | 109 | 1.72 | 129 | 2.02 | 17.7 |
aThese five countries did not submit data on CRT implantation centres for the EHRA White Book 2015.
Change in the number of total CRT device implantations in year 2013 vs. 2014
| Country | ISO code | Total CRT implantations 2013 | Total CRT implantations 2014 | Change % | ||
|---|---|---|---|---|---|---|
| Absolute number | Per mil inhabitants | Absolute number | Per mil inhabitants | |||
| Albania | AL | N/A | N/A | 2 | 0.66 | N/A |
| Algeria | DZ | 64 | 1.68 | 56 | 1.44 | −14.1 |
| Armenia | AM | 10 | 3.26 | 4 | 1.31 | −60.0 |
| Austria | AT | 1178 | 143.28 | 1236 | 150.31 | 4.9 |
| Azerbaijan | AZ | 17 | 1.77 | 18 | 1.86 | 4.8 |
| Belarus | BY | 54 | 5.61 | 49 | 5.10 | −9.1 |
| Belgium | BE | 1221 | 116.91 | 1332 | 127.47 | 9.0 |
| Bosnia & Herzegovina | BA | 25 | 6.45 | 23 | 5.94 | −7.9 |
| Bulgaria | BG | 260 | 37.24 | 303 | 43.76 | 17.5 |
| Croatia | HR | 81 | 18.10 | 124 | 27.74 | 53.3 |
| Cyprus | CY | 25 | 21.64 | 29 | 24.73 | 14.3 |
| Czech Republic | CZ | 1716 | 161.74 | 1872 | 176.15 | 8.9 |
| Denmark | DK | 1001 | 180.15 | 965 | 173.28 | −3.8 |
| Egypt | EG | 414 | 4.85 | 530 | 6.10 | 25.7 |
| Estonia | EE | 70 | 55.28 | 51 | 40.54 | −26.7 |
| Finland | FI | 437 | 82.98 | 526 | 99.83 | 20.3 |
| France | FR | N/A | N/A | 9570 | 144.43 | N/A |
| Georgia | GE | 40 | 8.09 | 55 | 11.14 | 37.7 |
| Germany | DE | 8859 | 109.17 | 19 589 | 241.85 | 121.5 |
| Greece | GR | 500 | 46.41 | 580 | 53.83 | 16.0 |
| Hungary | HU | 984 | 99.00 | 941 | 94.87 | −4.2 |
| Iceland | IS | 14 | 44.40 | 26 | 81.93 | 84.5 |
| Irelanda | IE | 378 | 79.15 | N/A | N/A | N/A |
| Israel | IL | 1216 | 157.78 | 1330 | 170.04 | 7.8 |
| Italy | IT | 12 148 | 197.59 | 12 336 | 200.00 | 1.2 |
| Kazakhstan | KZ | 209 | 11.78 | 262 | 14.60 | 23.9 |
| Kosovo | XK | N/A | N/A | 0 | 0.00 | N/A |
| Kyrgyzstan | KGZ | N/A | N/A | 0 | 0.00 | N/A |
| Latvia | LV | 63 | 28.92 | 105 | 48.50 | 67.7 |
| Lebanon | LB | 100 | 24.20 | 160 | 38.68 | 59.8 |
| Libyaa | LY | N/A | N/A | N/A | N/A | N/A |
| Lithuania | LT | 165 | 46.93 | 192 | 54.77 | 16.7 |
| Luxembourg | LU | 22 | 42.73 | 34 | 65.30 | 52.8 |
| Macedonia, FYR | MK | 16 | 7.67 | 28 | 13.39 | 74.6 |
| Malta | MT | 16 | 38.90 | 48 | 116.32 | 199.0 |
| Moldovaa | MD | 0 | 0.00 | N/A | N/A | N/A |
| Montenegro | ME | 10 | 15.30 | 22 | 33.84 | 121.2 |
| Morocco | MA | 75 | 2.30 | 62 | 1.85 | −19.4 |
| Netherlands | NL | 2069 | 123.12 | 1931 | 114.41 | −7.1 |
| Norway | NO | 426 | 83.77 | 514 | 99.85 | 19.2 |
| Poland | PL | 3000 | 78.16 | 3718 | 96.96 | 24.1 |
| Portugal | PT | N/A | N/A | 696 | 64.36 | N/A |
| Romania | RO | 200 | 9.18 | 289 | 13.30 | 44.9 |
| Russian Federation | RU | 1012 | 7.10 | 863 | 6.06 | −14.7 |
| San Marinoa | SM | 0 | 0.00 | N/A | N/A | N/A |
| Serbia | RS | 329 | 45.42 | 321 | 44.52 | −2.0 |
| Slovakia | SK | 452 | 82.36 | 529 | 96.31 | 16.9 |
| Slovenia | SI | 131 | 65.74 | 150 | 75.44 | 14.8 |
| Spain | ES | 2545 | 53.73 | 2974 | 62.30 | 16.0 |
| Sweden | SE | 967 | 100.23 | 854 | 87.83 | −12.4 |
| Switzerland | CH | 477 | 59.65 | 583 | 72.32 | 21.2 |
| Syriaa | SY | N/A | N/A | N/A | N/A | N/A |
| Tunisia | TN | N/A | N/A | 180 | 16.46 | N/A |
| Turkey | TR | N/A | N/A | 2460 | 30.14 | N/A |
| Ukraine | UA | 89 | 2.00 | 85 | 1.92 | −3.9 |
| United Kingdom | GB | 7762 | 122.44 | 9516 | 149.29 | 21.9 |
aThese five countries did not submit data on CRT implantations for the EHRA White Book 2015.

Change in the number of CRT implanting centres per million inhabitants from 2013 to 2014.
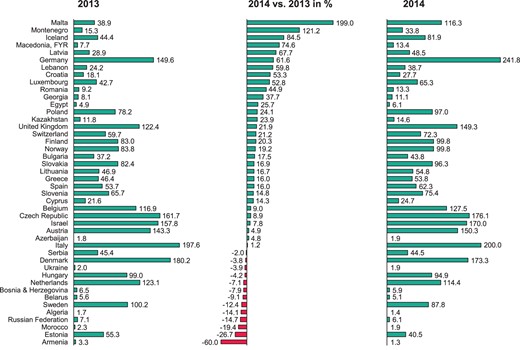
Change in the number of CRT implantations per million inhabitants from 2013 to 2014.
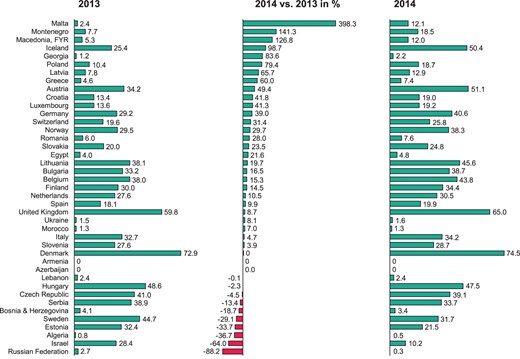
Change in the number of CRT-P implantations per million inhabitants from 2013 to 2014.
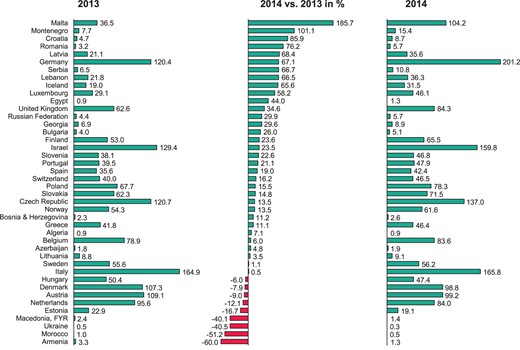
Change in the number of CRT-D implantations per million inhabitants from 2013 to 2014.
The relationship between the annual CRT implantation rate and the number of CRT implanting centres per million population in the EU28 countries and the ESC area is shown in Figure 53.
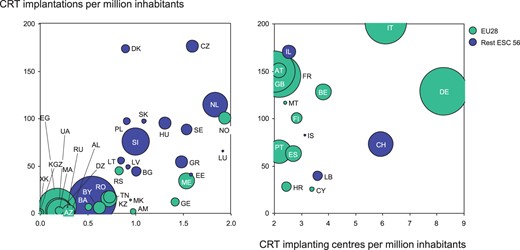
Cardiac resynchronization therapy implantation centres and rates in the ESC and European Union (EU28) member countries in 2014. Bubble size is related to population in the country. The ISO codes of the countries are explained in Table 1.
Lead extraction
General information
This was the third year that information on lead extractions (LEs) was included in the EHRA White Book. The number of countries submitting data on LE procedures increased from 30 in 2013 to 43 in 2014 (Table 14), but some countries submitted incomplete data and 13 countries did not give any information on LE. For example, Denmark gave the number of LE centres but not the number of the procedures. In most countries, the primary operator in LE procedures was a cardiologist.
Lead extraction facilities and rates in 2014 and comparison to the previous years
| Country | ISO code | Number of LE centres 2014 | Number of LE procedures 2014 | Development potential—target number of LE procedures | LE procedures per mil inhabitants | |||||
|---|---|---|---|---|---|---|---|---|---|---|
| Absolute number | Per mil inhabitants | Absolute number | Per mil inhabitants | To attain mean ESC area level | To attain mean EU28 level | 2012 | 2013 | 2014 | ||
| Albaniaa | AL | N/A | N/A | N/A | N/A | N/A | N/A | N/A | N/A | N/A |
| Algeria | DZ | 2 | 0.05 | 56 | 1.44 | 597 | 1222 | N/A | N/A | 1 |
| Armenia | AM | 0 | 0.00 | 0 | 0.00 | 47 | 96 | 0 | 1 | 0 |
| Austria | AT | 5 | 0.61 | 280 | 34.05 | – | – | 27 | 30 | 34 |
| Azerbaijan | AZ | 1 | 0.10 | 8 | 0.83 | 149 | 305 | N/A | 1 | 1 |
| Belarus | BY | 10 | 1.04 | 6 | 0.62 | 148 | 303 | 4 | N/A | 1 |
| Belgiuma | BE | N/A | N/A | N/A | N/A | N/A | N/A | N/A | N/A | N/A |
| Bosnia & Herzegovina | BA | 0 | 0.00 | 0 | 0.00 | 60 | 122 | N/A | 0 | 0 |
| Bulgaria | BG | 0 | 0.00 | 0 | 0.00 | 106 | 218 | N/A | 2 | 0 |
| Croatia | HR | 6 | 1.34 | 31 | 6.93 | 69 | 141 | 2 | 0 | 7 |
| Cyprus | CY | 1 | 0.85 | 3 | 2.56 | 18 | 37 | 0 | 2 | 3 |
| Czech Republic | CZ | 5 | 0.47 | 180 | 16.94 | – | 335 | 29 | 30 | 17 |
| Denmarkb | DK | 4 | 0.72 | N/A | N/A | N/A | N/A | N/A | N/A | N/A |
| Egypt | EG | 4 | 0.05 | 28 | 0.32 | 1336 | 2736 | 0 | 0 | 0 |
| Estoniaa | EE | N/A | N/A | N/A | N/A | N/A | N/A | N/A | N/A | N/A |
| Finland | FI | 5 | 0.95 | 17 | 3.23 | 81 | 166 | N/A | N/A | 3 |
| France | FR | 50 | 0.75 | 2200 | 33.20 | – | – | 30 | N/A | 33 |
| Georgia | GE | 1 | 0.20 | 3 | 0.61 | 76 | 155 | N/A | 0 | 1 |
| Germany | DE | 560 | 6.91 | 4963 | 61.27 | – | – | 10 | N/A | 61 |
| Greece | GR | 4 | 0.37 | 50 | 4.64 | 166 | 339 | 2 | 3 | 5 |
| Hungary | HU | 8 | 0.81 | 97 | 9.78 | 153 | 312 | 7 | 13 | 10 |
| Iceland | IS | 1 | 3.15 | 1 | 3.15 | 5 | 10 | 0 | 0 | 3 |
| Irelandb | IE | 2 | 0.41 | N/A | N/A | N/A | N/A | N/A | N/A | N/A |
| Israel | IL | 5 | 0.64 | 80 | 10.23 | 120 | 246 | 0 | N/A | 10 |
| Italya | IT | N/A | N/A | N/A | N/A | N/A | N/A | N/A | N/A | N/A |
| Kazakhstan | KZ | 0 | 0.00 | 0 | 0.00 | 276 | 565 | 0 | N/A | 0 |
| Kosovo | XK | 0 | 0.00 | 0 | 0.00 | 29 | 59 | N/A | N/A | 0 |
| Kyrgyzstana | KGZ | N/A | N/A | N/A | N/A | N/A | N/A | 0 | N/A | N/A |
| Latvia | LV | 1 | 0.46 | 10 | 4.62 | 33 | 68 | 3 | 4 | 5 |
| Lebanonb | LB | 5 | 1.21 | N/A | N/A | N/A | N/A | N/A | N/A | N/A |
| Libyaa | LY | N/A | N/A | N/A | N/A | N/A | N/A | N/A | N/A | N/A |
| Lithuania | LT | 2 | 0.57 | 12 | 3.42 | 54 | 110 | 3 | 3 | 3 |
| Luxembourg | LU | 1 | 1.92 | 7 | 13.44 | 8 | 16 | 18 | N/A | 13 |
| Macedonia, FYR | MK | 2 | 0.96 | 0 | 0.00 | 32 | 66 | 3 | 0 | 0 |
| Malta | MT | 1 | 2.42 | 7 | 16.96 | – | 13 | 0 | 0 | 17 |
| Moldovaa | MD | N/A | N/A | N/A | N/A | N/A | N/A | N/A | 1 | N/A |
| Montenegro | ME | 0 | 0.00 | 0 | 0.00 | 10 | 20 | 0 | 0 | 0 |
| Morocco | MA | 2 | 0.06 | 10 | 0.30 | 515 | 1054 | 0 | 0 | 0 |
| Netherlands | NL | 12 | 0.71 | 500 | 29.63 | – | 531 | N/A | 24 | 30 |
| Norway | NO | 3 | 0.58 | 219 | 42.54 | – | – | 36 | 42 | 43 |
| Poland | PL | 10 | 0.26 | 600 | 15.65 | – | 1207 | 14 | 12 | 16 |
| Portugalb | PT | 5 | 0.46 | N/A | N/A | N/A | N/A | N/A | N/A | N/A |
| Romania | RO | 2 | 0.09 | 10 | 0.46 | 334 | 684 | 0 | 0 | 0 |
| Russian Federationa | RU | N/A | N/A | N/A | N/A | N/A | N/A | N/A | N/A | N/A |
| San Marinoa | SM | N/A | N/A | N/A | N/A | N/A | N/A | 0 | 0 | N/A |
| Serbia | RS | 5 | 0.69 | 62 | 8.60 | 111 | 227 | 7 | 5 | 9 |
| Slovakia | SK | 3 | 0.55 | 136 | 24.76 | – | 173 | 25 | 20 | 25 |
| Sloveniaa | SI | N/A | N/A | N/A | N/A | N/A | N/A | N/A | N/A | N/A |
| Spainb | ES | 16 | 0.34 | N/A | N/A | N/A | N/A | N/A | N/A | N/A |
| Sweden | SE | 5 | 0.51 | 450 | 46.28 | – | – | 22 | 51 | 46 |
| Switzerland | CH | 5 | 0.62 | 87 | 10.79 | 124 | 254 | N/A | 11 | 11 |
| Syriaa | SY | N/A | N/A | N/A | N/A | N/A | N/A | N/A | N/A | N/A |
| Tunisia | TN | 3 | 0.27 | 20 | 1.83 | 168 | 344 | 7 | N/A | 2 |
| Turkey | TR | N/A | N/A | 311 | 3.81 | 1255 | 2570 | N/A | N/A | 4 |
| Ukraine | UA | 7 | 0.16 | 38 | 0.86 | 681 | 1395 | 1 | 1 | 1 |
| United Kingdoma | GB | N/A | N/A | N/A | N/A | N/A | N/A | N/A | N/A | N/A |
| Total ESC countries | 56 | 764 | 10 482 | |||||||
aThese 12 countries did not submit data on LEs.
bThese four countries gave only the number of LE centres for the EHRA White Book 2015.
Lead extraction facilities and procedure rates
A total of 10 482 LE procedures (Table 14) were performed in 764 LE centres in 2014. The density of the LE centres (6.9 per million inhabitants) was highest in Germany (Figure 54). Six countries had no LE centres (Armenia, Bosnia & Herzegovina, Bulgaria, Kazakhstan, Kosovo, and Montenegro). It has been proposed that in an active centre the minimum annual number of LE should be at least 15 per million inhabitants.7–9 Assuming that each centre treated an equivalent number of patients it can be calculated that in 2014 the numbers for LE per centre were lower than recommended in most of the countries. The mean number of LE was highest in Germany (61.3 per million population) followed by Sweden (46.3) and Norway (42.5) (Figure 55). Owing to missing or incomplete data and a very low LE rate in some countries, interpretation of regional LE data is difficult. Therefore, we chose not to present regional data for LE.
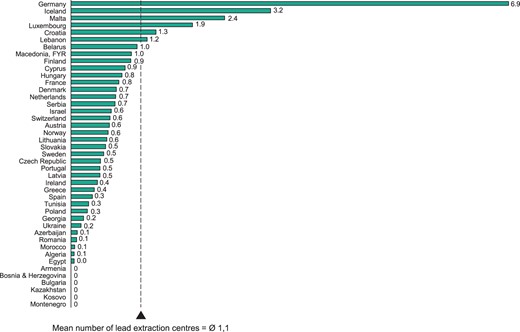
Lead extraction centres per million inhabitants in 2014. The mean number of LE centres is weighted by population.
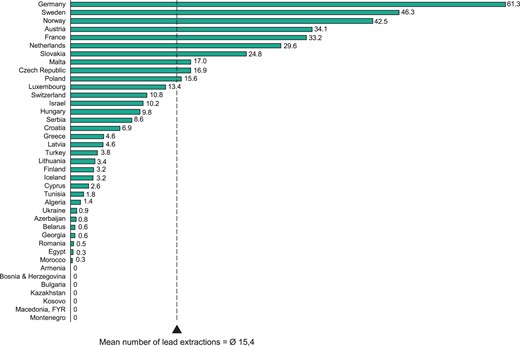
Lead extractions per million inhabitants in 2014. The mean number of LEs is weighted by population.
Catheter ablation
General information
A total of 48 countries (86% of the ESC countries) submitted data on catheter ablation facilities and procedures to the EHRA White Book (Table 15). Twenty had a national registry on catheter ablation and in the remainder the numbers originated from a survey or an estimate by the national working groups. In 2014, a total of 1 077 479 440 people lived in the ESC countries. After excluding those countries that did not report the number of ablations or ablation centres, the population covered by the EHRA White Book for ablation procedures was 967 666 759, which is ∼22% more than in the previous year. A major problem in 2014 was that no ablation data were received from Italy, which is known to have well developed catheter ablation programmes.
Catheter ablation facilities and rates in 2014 and comparison to four previous years
| Country | ISO code | National registry for EP | Number of ablation centres 2014 | Ablation procedures 2014 | Development potential—target number of ablation procedures | Ablation procedures per mil inhabitants | |||||||
|---|---|---|---|---|---|---|---|---|---|---|---|---|---|
| Absolute number | Per mil inhabitants | Absolute number | Per mil inhabitants | To attain mean ESC area level | To attain mean EU28 level | 2010 | 2011 | 2012 | 2013 | 2014 | |||
| Albania | AL | No | 1 | 0.33 | N/A | N/A | N/A | N/A | N/A | N/A | N/A | N/A | N/A |
| Algeria | DZ | No | 2 | 0.05 | 240 | 6 | 9458 | 15 933 | N/A | N/A | N/A | 6 | 6 |
| Armenia | AM | No | 3 | 0.98 | 132 | 43 | 746 | 1256 | 17 | 33 | 23 | 46 | 43 |
| Austria | AT | Yes | 17 | 2.07 | 2622 | 319 | – | 3375 | 219 | 220 | 339 | 294 | 319 |
| Azerbaijan | AZ | No | 3 | 0.31 | 384 | 40 | 2360 | 3976 | 7 | 20 | N/A | 24 | 40 |
| Belarus | BY | No | 6 | 0.62 | 807 | 84 | 2341 | 3944 | 51 | 61 | 54 | 76 | 84 |
| Belgium | BE | Yes | 44 | 4.21 | 6126 | 586 | – | – | 487 | 534 | 564 | 580 | 586 |
| Bosnia & Herzegovina | BA | No | 0 | 0.00 | 0 | 0 | 943 | 1589 | 3 | 5 | 1 | 0 | 0 |
| Bulgaria | BG | Yes | 4 | 0.58 | 663 | 96 | 1687 | 2843 | 42 | 39 | 60 | 54 | 96 |
| Croatia | HR | No | 5 | 1.12 | 852 | 191 | 1089 | 1835 | N/A | 101 | 132 | 183 | 191 |
| Cyprus | CY | No | 3 | 2.56 | 142 | 121 | 286 | 481 | 27 | 36 | 35 | 39 | 121 |
| Czech Republic | CZ | Yes | 22 | 2.07 | 5855 | 551 | – | – | 428 | 440 | 474 | 482 | 551 |
| Denmark | DK | Yes | 6 | 1.08 | 3867 | 694 | – | – | 494 | 457 | 590 | 652 | 694 |
| Egypt | EG | No | 15 | 0.17 | 1354 | 16 | 21 174 | 35 669 | 10 | N/A | 11 | 12 | 16 |
| Estonia | EE | No | 2 | 1.59 | 411 | 327 | – | 516 | 346 | 300 | 260 | 302 | 327 |
| Finland | FI | No | 9 | 1.71 | 2222 | 422 | – | – | 289 | 362 | 415 | 418 | 422 |
| France | FR | No | 130 | 1.96 | 33 300 | 503 | – | – | 445 | 479 | 472 | N/A | 503 |
| Georgia | GE | No | 7 | 1.42 | 356 | 72 | 1203 | 2026 | 40 | 55 | 75 | 54 | 72 |
| Germany | DE | No | 100 | 1.23 | 60 000 | 741 | – | – | 514 | 614 | 467 | 412 | 741 |
| Greece | GR | Yes | 29 | 2.69 | 1653 | 153 | 2626 | 4423 | 122 | 130 | 131 | 134 | 153 |
| Hungary | HU | No | 11 | 1.11 | 3469 | 350 | – | 4072 | 266 | 293 | 314 | 338 | 350 |
| Iceland | IS | No | 1 | 3.15 | 76 | 239 | 77 | 130 | 227 | 203 | 239 | 254 | 239 |
| Ireland | IE | No | 12 | 2.48 | N/A | N/A | N/A | N/A | 173 | 214 | 212 | 209 | N/A |
| Israel | IL | No | 16 | 2.05 | N/A | N/A | N/A | N/A | N/A | N/A | N/A | N/A | N/A |
| Italy | IT | Yes | N/A | N/A | N/A | N/A | N/A | N/A | N/A | 311 | N/A | N/A | N/A |
| Kazakhstan | KZ | No | 9 | 0.50 | 2018 | 112 | 4374 | 7368 | N/A | N/A | 57 | 83 | 112 |
| Kosovo | XK | No | 0 | 0.00 | 0 | 0 | 453 | 763 | N/A | N/A | N/A | N/A | 0 |
| Kyrgyzstan | KGZ | N/A | 2 | 0.36 | 58 | 10 | 1366 | 2300 | N/A | N/A | N/A | N/A | 10 |
| Latvia | LV | Yes | 2 | 0.92 | 638 | 295 | – | 889 | 190 | 247 | 269 | 238 | 295 |
| Lebanon | LB | No | 5 | 1.21 | 150 | 36 | 1008 | 1698 | N/A | N/A | N/A | 24 | 36 |
| Libyaa | LY | N/A | N/A | N/A | N/A | N/A | N/A | N/A | N/A | N/A | N/A | N/A | N/A |
| Lithuania | LT | No | 3 | 0.86 | 885 | 252 | – | 1439 | 227 | 227 | 243 | 239 | 252 |
| Luxembourg | LU | Yes | 1 | 1.92 | 158 | 303 | – | 214 | 187 | 252 | 301 | 251 | 303 |
| Macedonia, FYR | MK | No | 3 | 1.43 | 105 | 50 | 510 | 859 | 14 | 26 | 30 | 38 | 50 |
| Malta | MT | Yes | 1 | 2.42 | 30 | 73 | 101 | 169 | 32 | 20 | 24 | 29 | 73 |
| Moldovaa | MD | N/A | N/A | N/A | N/A | N/A | N/A | N/A | N/A | N/A | N/A | 0 | N/A |
| Montenegro | ME | No | 1 | 1.54 | 66 | 102 | 158 | 267 | 0 | 11 | 149 | 69 | 102 |
| Morocco | MA | Yes | 5 | 0.15 | 170 | 5 | 8158 | 13 742 | 2 | 3 | 7 | 5 | 5 |
| Netherlands | NL | Yes | 16 | 0.95 | 8358 | 495 | – | – | 341 | N/A | 382 | N/A | 495 |
| Norway | NO | No | 5 | 0.97 | 2959 | 575 | – | – | 274 | 487 | 530 | 507 | 575 |
| Poland | PL | No | 83 | 2.16 | 10 922 | 285 | – | 15 741 | 199 | 214 | 229 | 248 | 285 |
| Portugal | PT | Yes | 24 | 2.22 | 2324 | 215 | 2635 | 4439 | 152 | 187 | 186 | 191 | 215 |
| Romania | RO | No | 12 | 0.55 | 1358 | 62 | 5295 | 8920 | 46 | 50 | 50 | 60 | 62 |
| Russian Federation | RU | Yes | 81 | 0.57 | 23 874 | 168 | 34 716 | 58 482 | 101 | 118 | 120 | 149 | 168 |
| San Marinoa | SM | N/A | N/A | N/A | N/A | N/A | N/A | N/A | 0 | 0 | 0 | 0 | N/A |
| Serbia | RS | No | 2 | 0.28 | 815 | 113 | 1757 | 2960 | 112 | 125 | 133 | 139 | 113 |
| Slovakia | SK | Yes | 4 | 0.73 | 1111 | 202 | 1338 | 2255 | 175 | 177 | 168 | 195 | 202 |
| Slovenia | SI | Yes | 3 | 1.51 | 437 | 220 | 484 | 816 | 131 | 162 | 136 | 140 | 220 |
| Spain | ES | Yes | 85 | 1.78 | 12 871 | 270 | – | 19 596 | 188 | 188 | 205 | 253 | 270 |
| Sweden | SE | Yes | 10 | 1.03 | 4803 | 494 | – | – | 390 | 450 | 478 | 465 | 494 |
| Switzerland | CH | Yes | 23 | 2.85 | 5135 | 637 | – | – | 514 | 612 | 598 | 566 | 637 |
| Syriaa | SY | N/A | N/A | N/A | N/A | N/A | N/A | N/A | N/A | N/A | N/A | N/A | N/A |
| Tunisia | TN | No | 9 | 0.82 | 850 | 78 | 2665 | 4490 | 48 | 56 | 47 | N/A | 78 |
| Turkey | TR | No | N/A | N/A | 11 218 | 137 | 19 888 | 33 504 | N/A | N/A | N/A | N/A | 137 |
| Ukraine | UA | No | 8 | 0.18 | 2371 | 54 | 10 793 | 18 181 | 41 | 47 | 55 | 60 | 54 |
| United Kingdom | GB | Yes | 61 | 0.96 | 17 578 | 276 | – | 26 166 | 228 | 240 | 254 | 251 | 276 |
| Total ESC countries | 56 | 906 | 235 793 | ||||||||||
aThese four countries did not submit data for the EHRA White Book 2015.
Catheter ablation facilities and procedure rates
In 2014, the total number of ablation centres in the countries which submitted data for the EHRA White Book was 906 (Table 15), and the mean number of ablation centres per million population was 1.1 (Figure 56). These numbers were higher than in the previous year, mainly because the French data were not available in 2013. The changes in the number or ablation centres in from 2013 to 2014 are shown in Figure 57.
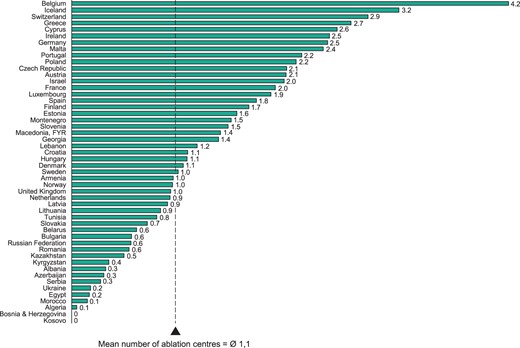
Catheter ablation centres per million inhabitants in 2014. The mean number of catheter ablation centres is weighted by population.
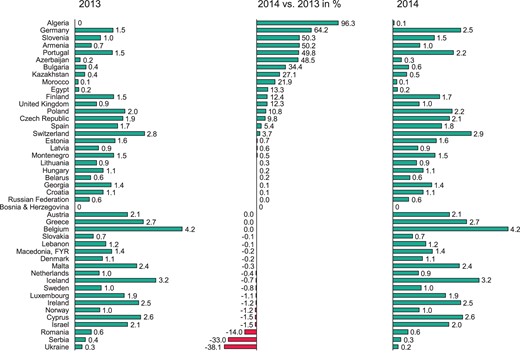
Change in the number of catheter ablation centres per million inhabitants from 2013 to 2014.
Total number of catheter ablations in the ESC area in 2014 was 235 793 (Table 15), which was 63% more than that reported in 2013 (144 782). The mean number of ablations done per million population was also higher in 2014 (244) than in 2013 (184). The increase in ablation rates is mainly due to the fact that data from France were available for 2014 but not for 2013, and Germany reported a substantial increase in catheter ablations in 2014.
The number of catheter ablations per million inhabitants is shown in Figures 58 and 59. In these figures, the ESC countries are grouped in quartiles according to their ablation activities. As in previous years, most countries in the top quartile were from Northern and Western Europe. European Society of Cardiology countries outside Europe had low ablation activity and they are mostly found in the lowest (first) quartile. Eastern European countries had a heterogeneous distribution, which spanned over all four quartiles. Data on the number of catheter ablations during the last 5 years are shown in Table 15, and detailed information on the changes in the number of ablation procedures from 2013 to 2014 is presented in Figure 60. The mean number of ablations performed per centre increased from 193 in 2013 to 260 in 2014 indicating the centres that reported their numbers were more active than in the previous year. The relationship between the annual catheter ablation rate and the number of ablation centres per million population in the EU28 countries and the whole ESC area is shown in Figure 61.
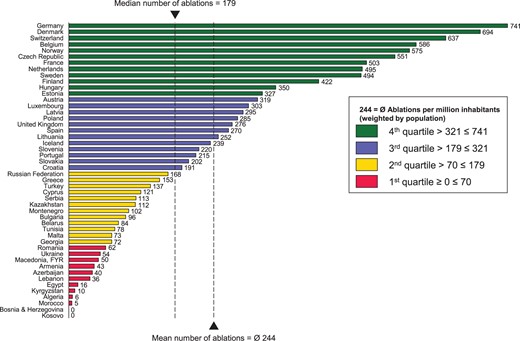
Catheter ablations per million inhabitants in 2014. The mean number of ablations is weighted by population.
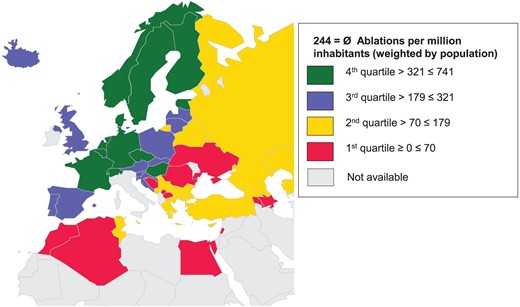
Catheter ablations per million inhabitants in the ESC countries in 2014.
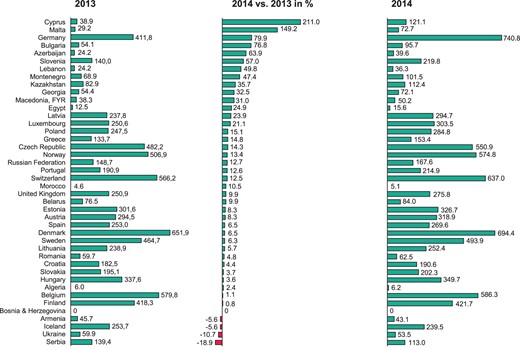
Change in the number of catheter ablations per million inhabitants from 2013 to 2014.
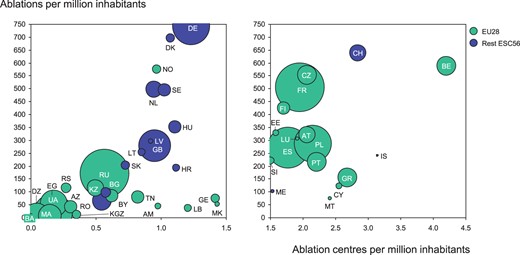
Catheter ablation centres and rates in the ESC and European Union (EU28) member countries in 2014. Bubble size is related to population in the country. The ISO codes of the countries are explained in Table 1.
More detailed data on ablation activity in the five geographical ESC regions are presented in Figure 62. The mean number of ablations per million inhabitants was higher in the Western and Northern Europe than in the Southern and Eastern Europe. In the non-European ESC countries, catheter ablation rate was markedly lower than in the European ESC countries (69 vs. 304 per million population). In 2014, the most active countries were Germany and Denmark with 741 and 694 ablations per million population, respectively (Table 15 and Figure 58). In some of the smaller countries, no ablations were performed. Data for the last 5 years from the three most active and three least active countries in the different ESC regions are presented in Figures 63–67. The most active countries in the Northern, Western, Southern, and Eastern Europe were Denmark (694 ablation per million inhabitants), Germany (741), Spain (270), and the Czech Republic (551), respectively. Among the non-European ESC countries, Cyprus was the most active with 121 catheter ablations per million population. In 2014, the rate of ablations per million population increased in all other ESC countries except for Bosnia & Herzegovina, Armenia, Iceland, Ukraine, and Serbia. The growth in the mean ablation rate per million population was highest in the Eastern and Southern European region. In Cyprus, the increase in ablation rate was 211%, whereas in Serbia the ablation rate decreased by ∼19% (Figure 60).
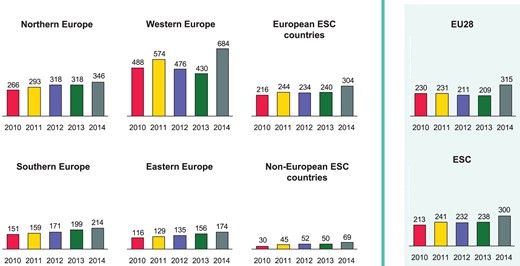
Catheter ablations per million inhabitants 2010–14 in the five geographical regions of the ESC and comparison to the total ESC area and the 28 member countries of the European Union (EU28).
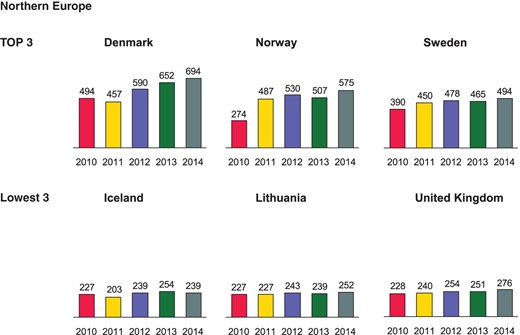
Catheter ablations per million inhabitants 2010–14 in Northern Europe.
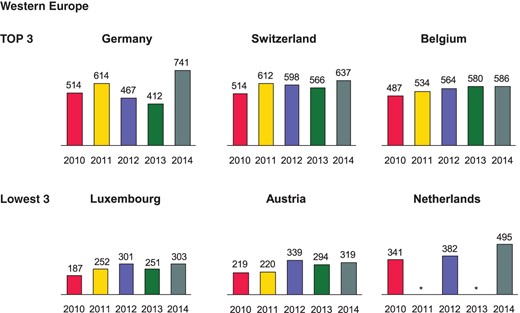
Catheter ablations per million inhabitants 2010–14 in Western Europe. *No data available.
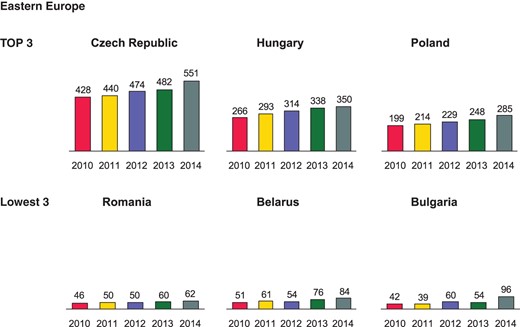
Catheter ablations per million inhabitants 2010–14 in Eastern Europe.
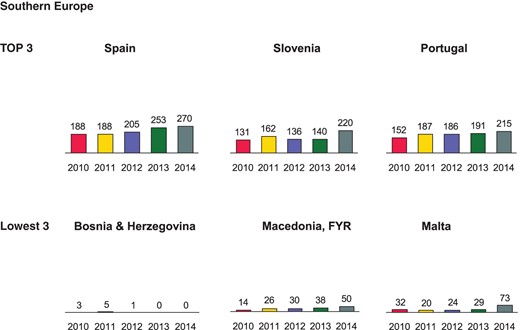
Catheter ablations per million inhabitants 2010–14 in Southern Europe.
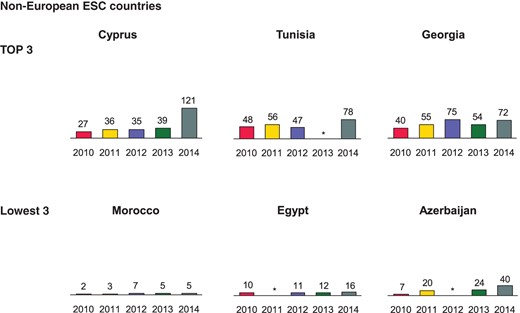
Catheter ablations per million inhabitants 2010–14 in the non-European ESC countries. *No data available.
Atrial fibrillation ablation rates
In 2014, a total of 91 895 AF ablations were performed in the 46 ESC countries that submitted AF ablation data for the EHRA White Book (Table 16). In Figures 68 and 69, countries performing AF ablations are grouped in quartiles according to their activity. The mean number of AF ablations per million inhabitants was 93, which is ∼60% more than in 2013 (58 per million). The most active countries were Germany (432 AF ablations per million population), Denmark (305), and Norway (278). Like 2013, most countries in the top quartile were from Northern and Western European region, and the countries with the lowest activity (first and second quartiles) were mainly from the Southern Europe and from the non-European ESC region. In the Eastern region, the AF ablations activity was extremely heterogeneous. The growth in AF ablation rate per million population was highest in Cyprus (771%), Germany (200%), and Lithuania (147%), whereas in Romania, Slovakia, and Slovenia the AF ablation rate decreased by 27, 14, and 10%, respectively (Figure 70). In Algeria, Bosnia & Herzegovina, Kosovo, Malta, and FYR Macedonia, no AF ablations were performed in 2014.
Atrial fibrillation ablations in 2014 and comparison to four previous years
| Country | ISO code | AF Ablation procedures 2014 | Development potential—target number of AF ablation procedures | AF ablation procedures per mil inhabitants | ||||||
|---|---|---|---|---|---|---|---|---|---|---|
| Absolute number | Per mil inhabitants | To attain mean ESC area level | To attain mean EU28 level | 2010 | 2011 | 2012 | 2013 | 2014 | ||
| Albania | AL | N/A | N/A | N/A | N/A | N/A | N/A | N/A | N/A | N/A |
| Algeria | DZ | 0 | 0 | 3826 | 6882 | N/A | N/A | N/A | 0 | 0 |
| Armenia | AM | 11 | 4 | 302 | 543 | 1 | 1 | 3 | 3 | 4 |
| Austria | AT | 878 | 107 | – | 1458 | 55 | 62 | 122 | 94 | 107 |
| Azerbaijan | AZ | 2 | 0 | 955 | 1717 | 0 | 0 | N/A | 0 | 0 |
| Belarus | BY | 69 | 7 | 947 | 1704 | 6 | 4 | 6 | 7 | 7 |
| Belgium | BE | 2560 | 245 | – | – | 176 | 182 | 224 | 225 | 245 |
| Bosnia & Herzegovina | BA | 0 | 0 | 382 | 686 | 0 | 0 | 0 | 0 | 0 |
| Bulgaria | BG | 79 | 11 | 683 | 1228 | 2 | 0 | 7 | 7 | 11 |
| Croatia | HR | 223 | 50 | 441 | 793 | 0 | 10 | 18 | 38 | 50 |
| Cyprus | CY | 53 | 45 | 116 | 208 | 0 | 3 | 5 | 5 | 45 |
| Czech Republic | CZ | 2297 | 216 | – | – | 119 | 156 | 177 | 196 | 216 |
| Denmark | DK | 1698 | 305 | – | – | 234 | 194 | 262 | 290 | 305 |
| Egypt | EG | 60 | 1 | 8565 | 15 407 | 0 | N/A | 0 | 0 | 1 |
| Estonia | EE | 98 | 78 | 124 | 223 | 87 | 90 | 27 | 56 | 78 |
| Finland | FI | 736 | 140 | – | 934 | 74 | 91 | 110 | 124 | 140 |
| France | FR | 11 000 | 166 | – | 11 748 | 114 | 100 | 130 | N/A | 166 |
| Georgia | GE | 50 | 10 | 487 | 875 | 10 | 9 | 11 | 7 | 10 |
| Germany | DE | 40 000 | 494 | – | – | 147 | 184 | 172 | 144 | 494 |
| Greece | GR | 560 | 52 | 1062 | 1911 | 23 | 32 | 37 | 40 | 52 |
| Hungary | HU | 1081 | 109 | – | 1759 | 49 | 61 | 75 | 86 | 109 |
| Iceland | IS | 33 | 104 | – | 56 | 42 | 48 | 77 | 73 | 104 |
| Ireland | IE | N/A | N/A | N/A | N/A | 76 | 96 | 95 | 94 | N/A |
| Israel | IL | 550 | 70 | 771 | 1387 | N/A | N/A | 0 | N/A | 70 |
| Italy | IT | N/A | N/A | N/A | N/A | N/A | N/A | 0 | N/A | N/A |
| Kazakhstan | KZ | 524 | 29 | 1769 | 3182 | N/A | 6 | 11 | 15 | 29 |
| Kosovo | XK | 0 | 0 | 183 | 330 | N/A | N/A | N/A | N/A | 0 |
| Kyrgyzstan | KGZ | N/A | N/A | N/A | N/A | N/A | N/A | N/A | N/A | N/A |
| Latvia | LV | 75 | 35 | 213 | 384 | 17 | 31 | 26 | 29 | 35 |
| Lebanon | LB | N/A | N/A | N/A | N/A | N/A | N/A | N/A | N/A | N/A |
| Libyaa | LY | N/A | N/A | N/A | N/A | N/A | N/A | N/A | N/A | N/A |
| Lithuania | LT | 74 | 21 | 346 | 622 | 21 | 19 | 8 | 9 | 21 |
| Luxembourg | LU | 57 | 109 | – | 92 | 24 | 54 | 61 | 60 | 109 |
| Macedonia, FYR | MK | 0 | 0 | 206 | 371 | 0 | 0 | 0 | 0 | 0 |
| Malta | MT | 0 | 0 | 41 | 73 | 0 | 0 | 0 | 2 | 0 |
| Moldovaa | MD | N/A | N/A | N/A | N/A | N/A | N/A | N/A | 0 | N/A |
| Montenegro | ME | 17 | 26 | 64 | 115 | 0 | 0 | 0 | 0 | 26 |
| Morocco | MA | N/A | N/A | N/A | N/A | 0 | 0 | 0 | N/A | N/A |
| Netherlands | NL | 3413 | 202 | – | – | 128 | N/A | 156 | N/A | 202 |
| Norway | NO | 1432 | 278 | – | – | 89 | 242 | 249 | 293 | 278 |
| Poland | PL | 2169 | 57 | 3780 | 6799 | 31 | N/A | 44 | 50 | 57 |
| Portugal | PT | 684 | 63 | 1066 | 1917 | 33 | 43 | 49 | 51 | 63 |
| Romania | RO | 88 | 4 | 2142 | 3853 | 1 | 3 | 4 | 6 | 4 |
| Russian Federation | RU | 6462 | 45 | 14 043 | 25 261 | 22 | 27 | 27 | 41 | 45 |
| San Marinoa | SM | N/A | N/A | N/A | N/A | 0 | 0 | 0 | 0 | N/A |
| Serbia | RS | 236 | 33 | 711 | 1278 | 7 | 8 | 14 | 17 | 33 |
| Slovakia | SK | 129 | 23 | 541 | 974 | 24 | 17 | 18 | 27 | 23 |
| Slovenia | SI | 149 | 75 | 196 | 353 | 45 | 59 | 55 | 83 | 75 |
| Spain | ES | 2498 | 52 | 4706 | 8464 | 28 | 31 | 33 | 46 | 52 |
| Sweden | SE | 1791 | 184 | – | – | 126 | 157 | 178 | 179 | 184 |
| Switzerland | CH | 1684 | 209 | – | – | 166 | 209 | 193 | 184 | 209 |
| Syriaa | SY | N/A | N/A | N/A | N/A | N/A | N/A | N/A | N/A | N/A |
| Tunisia | TN | 40 | 4 | 1078 | 1939 | 2 | 2 | 3 | N/A | 4 |
| Turkey | TR | 1208 | 15 | 8045 | 14 471 | N/A | N/A | N/A | N/A | 15 |
| Ukraine | UA | 622 | 14 | 4366 | 7853 | 9 | 11 | 14 | 15 | 14 |
| United Kingdom | GB | 6505 | 102 | – | 11 302 | 60 | 74 | 80 | 85 | 102 |
| Total ESC countries | 56 | 91 895 | ||||||||
aThese four countries did not submit data for the EHRA White Book 2015.

Atrial fibrillation ablations per million inhabitants in 2014. The mean number of AF ablations is weighted by population.
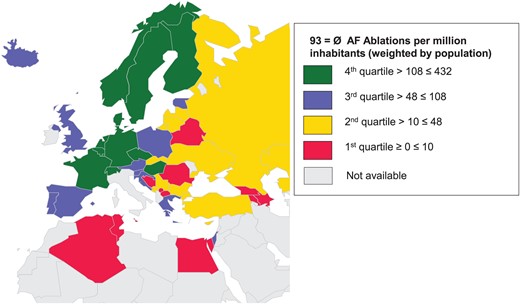
Atrial fibrillation ablations in the ESC countries in 2014.
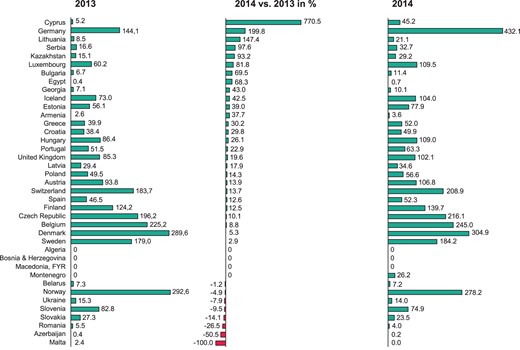
Change in the number of AF ablations per million inhabitants from 2013 to 2014.
Detailed data on AF ablation activities in the five ESC regions and a comparison to the corresponding numbers in the ESC and EU28 countries are presented in Figure 71. The rate of AF ablations was markedly lower in the non-European than in the European ESC countries (12 vs. 124 per million population). The most active countries in the Northern, Western, Southern, and Eastern European region, and among the non-European ESC countries were Denmark (305 AF ablation per million population), Germany (432), Slovenia (75), the Czech Republic (216) and Cyprus (45) (Figures 72–76). The proportion of AF ablation to the total number of ablation varied between 0.5% in Azerbaijan and 58.3% in Germany. The proportion of AF ablations compared with all ablations was more than 40% in six countries (Figure 77).
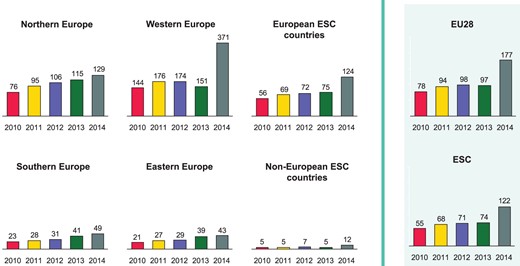
Atrial fibrillation ablations per million inhabitants 2010–14 in the five geographical regions of the ESC and comparison to the total ESC area and the 28 member countries of the European Union (EU28).
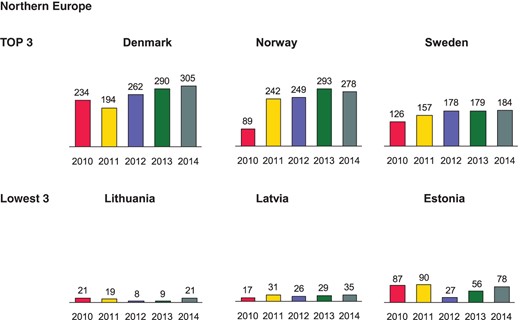
Atrial fibrillation ablations per million inhabitants 2010–14 in Northern Europe.
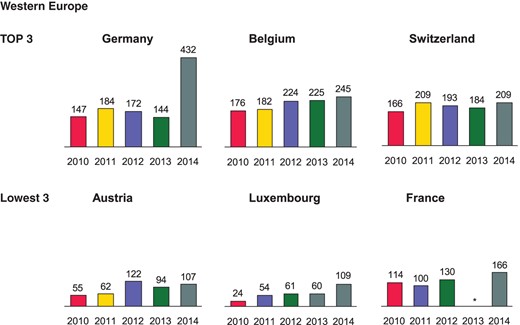
Atrial fibrillation ablations per million inhabitants 2010–14 in Western Europe. *No data available.
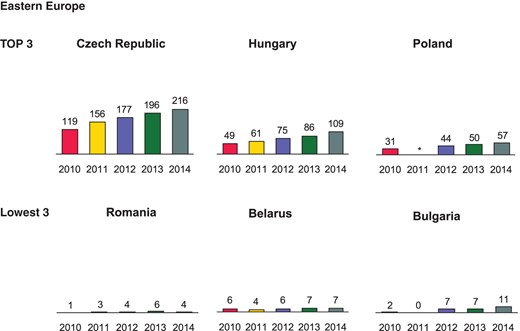
Atrial fibrillation ablations per million inhabitants 2010–14 in Eastern Europe. *No data available.
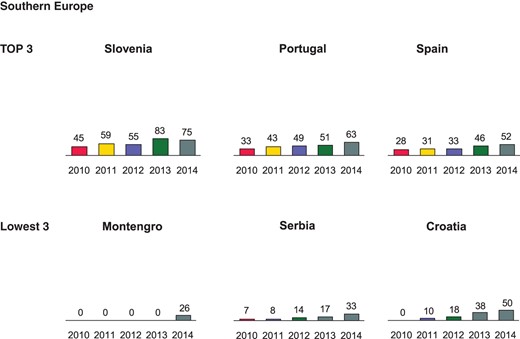
Atrial fibrillation ablations per million inhabitants 2010–14 in Southern Europe.
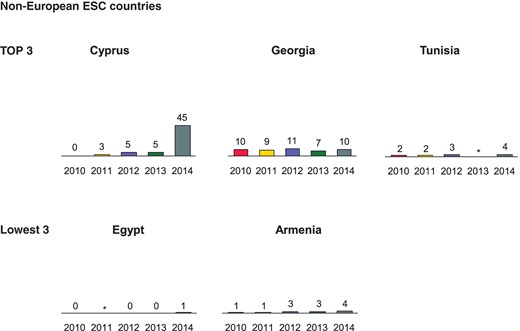
Atrial fibrillation ablations per million inhabitants 2010–14 in the non-European ESC countries. *No data available.
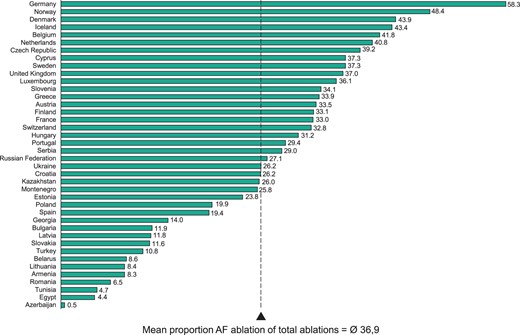
Proportion of AF ablations of total ablations in 2014.
Ventricular tachyarrhythmia ablation rates
Data on ventricular tachyarrhythmia ablations in patients with structural heart disease were collected for the first time in 2014. A total of 37 (66%) countries reported data on ventricular tachycardia (VT) or ventricular fibrillation (VF) ablations. In 2014, the number of centres performing more than 10 ventricular tachyarrhythmia ablations for patients with structural heart disease per million population was highest in Slovakia (1.01) and lowest in Ukraine (0.05) (Figure 78). The mean number of VT/VF ablations per million population in the ESC countries was 9.2. It was highest in the Netherlands (50 per million population), Czech Republic (27), and Denmark (26) (Figures 79 and 80). Many countries did not report any data on VT/VF ablation (n = 19) or did not perform any VT/VF ablations in 2014 (n = 8).
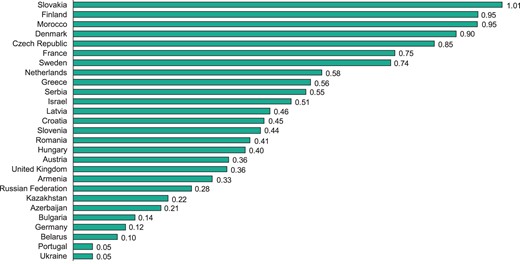
Number of centres which performed more than 10 VT or VF ablations per million inhabitants in patients with structural heart disease in 2014.
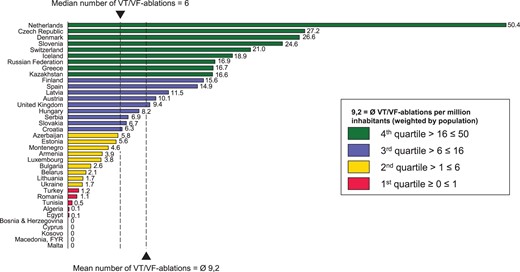
Ablations for VT or VF per million inhabitants in patients with structural heart disease in 2014. The mean number of VT/VF ablations is weighted by population.
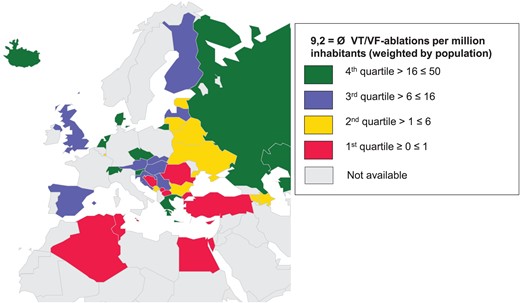
Ablations for VT or VF per million inhabitants in patients with structural heart disease in 2014.
Percutaneous left atrial appendage closures
During recent years, percutaneous left atrial appendage (LAA) closure has become a viable option to prevention AF-related thromboembolic complications among patients with high risk of bleeding and relative or absolute contraindication to oral anticoagulation therapy.10,11 In 2014, only 32 of the 56 ESC member countries (57%) submitted the requested data on LAA closures for the EHRA White Book. The mean number of centres performing LAA closures was 0.4 per million population. There were no centres performing LAA closure centres in 14 countries (Figure 81). The mean number of procedures in the ESC countries performing LAA closures was 8.9 per million inhabitants. Germany was by far the most active country (43 LAA closure per million inhabitant) followed by Finland (12.0) and Latvia (8.3) (Figure 82).
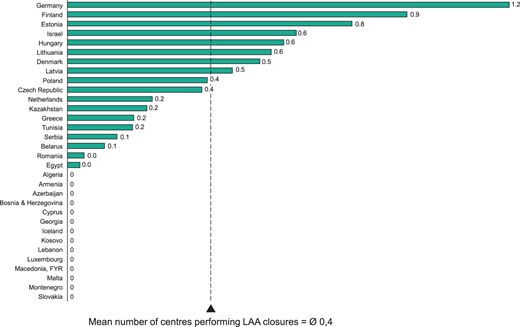
Number of centres performing percutaneous LAA closures per million inhabitants in 2014.
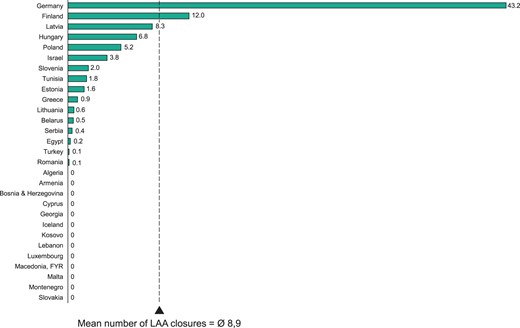
Percutaneous LAA closures per million inhabitants in 2014.
Discussion
The EHRA White Book has played a key role in the ICD for life programme12 and many other strategic initiatives and awareness activities of the EHRA. This comparative analysis of the EHRA White Book data indicates that considerable variations in the use of invasive electrophysiological procedures still exist between the ESC member countries. While improvements have been made over the 5-year period from 2010 to 2014, there is still a clear need to continue to advance. As in previous years, the mean CIED implantation rates were markedly lower in the Eastern European and non-European ESC countries than in the other regions. Also the catheter ablation activity was substantially higher in the Western and Northern European than in the non-European ESC countries. The Eastern European ESC countries were characterized by large variations in the procedure rates, with numbers spanning over all four quartiles of the activity distribution.
Potential for improvement
There was a large gap between the EU28 countries and selected Eastern European and non-European ESC countries in the CIED implantation facilities and rates. Likewise, catheter ablation facilities and rates were markedly lower in the non-European than in the European ESC member countries. National data on health expenditures and CIED implantation rate per capita indicate that a low proportion of healthcare expenditure is associated with a lower use of device therapy and the use of complex interventional EP procedures (Figure 83). However, in some Eastern European countries with relatively low GDP, device implantation and catheter ablation rates per million population exceed those of certain Western and Northern European countries. Furthermore, the number of hospitals and beds was not directly related to the financial profile or healthcare expenditure of a given country. This indicates that a high GDP may not be the only requirement for an active programme in expensive arrhythmia care. Other potential explanations for the observed disparity include the lack of manpower, training opportunities, facilities, and low referral rates.13 It should be noted, nevertheless, that despite the ongoing economic difficulties all across Europe, the use of device and catheter ablation therapies is growing in a number of countries with relative low GDP and in many cases the growth rate exceeds that of some the Western and Northern European countries. On the other hand, in many Western and Northern European countries, the use of device and ablation therapies has remained stable or even declined slightly. It is unclear whether this is a consequence of constraints on healthcare expenditure in the wake of the financial crisis or that supply is already meeting demand or both.
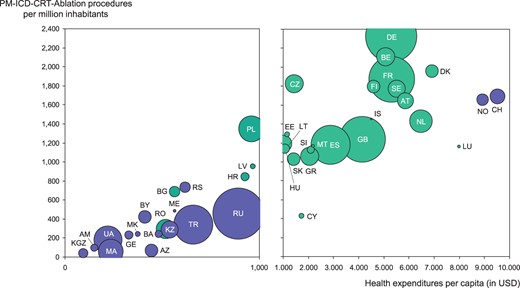
Healthcare spending per capita and interventional EP procedures (sum of PM–ICD–CRT–ablation procedures per million inhabitants). The ISO codes of the countries are explained in Table 1.
In recent years, a major limitation for further improvements in arrhythmia management across the ESC area has been the poor economic situation. Owing to the ongoing financial problems, many countries have made substantial budget cuts for healthcare.14–16 At the same time, the number of elderly requiring vast medical and social assistance has grown rapidly. In this context, socioeconomic disparities pose major threats to healthcare systems, and may limit the use of expensive innovative technologies such as ICD therapy for primary prevention of sudden cardiac death (SCD) and catheter ablation of AF.14–17
Evolving areas in cardiac rhythm management therapy
Given the growing number of ICD patients, the need for catheter ablations in patients with structural heart disease is expected to grow in the future. Several studies have shown that ICD prevents SCD not only in patients who have experienced aborted SCD or VT but also among those with high risk of cardiac arrest due to severe ischaemic or non-ischaemic heart disease or other causes.18–20 However, although ICD therapy effectively prevents SCD, it has no effect on the underlying mechanism(s), triggers, and occurrence of VT/VF. Traditionally, antiarrhythmic drugs have been the mainstay in this process, but unfortunately they do not provide sufficient protection from recurrent VT/VF and often cause serious adverse events. Radiofrequency catheter ablation has also been successful in treatment of patients receiving multiple ICD shocks,21 and it may be effective even as prophylactic therapy in selected post-myocardial infarction patients.22–24
Another evolving area in cardiac rhythm management is the use of percutaneous LAA occluders to prevent AF-related thrombo-embolic complications.11 According to a recent meta-analysis, LAA occlusion is non-inferior to warfarin in patients at high risk of thrombo-embolic and bleeding events.10 At the moment, the procedure numbers in the ESC area except for Germany are quite low, but they are expected to increase in near future.
The rate of LE is also expected to go up. On the basis of reported infections in patients with CIED, it has been estimated that in a country with 1000 CIED implantations per million inhabitants per year, the annual LE activity should be between 15 and 60 procedures per million inhabitants.7–9 In 2014, the LE activity was within this estimate in 10 countries (Germany, Sweden, Norway, Austria, France, the Netherlands, Slovakia, Malta, the Czech Republic, and Poland). Luxembourg was close to the proposed level (13.4 per million inhabitants), but in most of the others the reported LE rate (0.3–10.8) was considerably smaller than the expected values.
Finally, PM and ICD technology has been developing rapidly during the recent years. Next year we are planning to collect data also on subcutaneous ICD and leadless PM implantation rate.
The role of European Heart Rhythm Association
The disparity in the implementation of arrhythmia treatment and practice guidelines is unfortunately likely to continue, unless there is a continued investment in infrastructure. This includes laboratories, specialized equipment, and improved training opportunities. Likewise harmonization of training requirements and implementation of standard clinical practice guidelines are important steps. European Heart Rhythm Association has been very active in promoting unified standards for training of cardiac rhythm management specialists and to assure high quality in arrhythmia care in a broad sense. The ongoing White Book project has revealed disparities in this field also and provided base to improve and align management strategies for arrhythmias across ESC countries.
The EHRA certification programme provides an excellent platform to improve training and the level of arrhythmia care in the ESC area. The introduction of the EHRA accreditation programme for teaching centres will provide further support to standardization of training. European Heart Rhythm Association fellowship grants have already allowed many young physicians from countries with low procedural rates to get training in high-volume centres across the ESC area. The number applications for the EHRA Fellowship grants have been increasing steadily, and the certification programme is now also available for allied professionals. Last year, the EHRA Training Fellowship committee awarded 17 grants for young physicians mainly from emerging economies. In addition, a specific proctor programme was launched in order to provide further training in emerging technologies and complex procedures also to senior physicians.
Limitations
There are several limitations with the methodology of the EHRA White Book data collection. Data collection is exclusively based on voluntary activity of the National Cardiac Societies or Arrhythmia Working Groups. The number of countries sharing their data has been steadily increasing. This year 51 of the 56 ESC nations responded to the White Book questionnaire. Some countries, on the other hand, have never reported data for the White Book and many countries do not report complete data. In particular, many countries did not provide data on new therapies such as LE and VT/VF ablations. This may possibly reflect inaccuracies in the collection of data on these procedures, which are new and relatively rare in many centres. With regard to the analysis and interpretation of summary data, it was a major drawback that Italy, one of the most populated countries in ESC area, did not submit any data on catheter ablations. In addition, there were large variations in the methodology of national data collection. About 50% of the data came from national registries (20 countries) and half were based on surveys and other estimates conducted by the national working groups. This is relevant since the coverage of the registries in some of the ESC countries is relatively poor and many procedures are not included in the registry data. In contrast, surveys and other estimates conducted by the National Working Groups may overestimate the procedure numbers. For example, this year, the catheter ablation numbers for Germany were markedly higher than in the past. Whether this reflects a real increase or is related to changes in data collection methods is not known.
The ability to see its own numbers in an international context provides each country reliable means to demonstrate shortfalls in resource allocation, reimbursement, and training requirements to the national or local authorities. Therefore, for the second year running, the data were presented separately for the five geographical regions within the ESC area. In order to avoid any economic, political, or historical bias, the European regions were composed according to the United Nations (UN) Statistics Division and all other ESC countries were included in the non-European ESC region. This classification is not free of limitations. Nevertheless, we feel that as a well-defined and widely accepted geographical classification, the UN grouping provides a neutral platform for regional comparisons within the ESC area.
Future directions of the European Heart Rhythm Association White Book project
Next year, we will be celebrating the 10-year anniversary of the EHRA White Book. For the anniversary edition, we have a specific goal to increase country participation, to improve the reliability of the data and to ensure the quality of the collected data. In this regard, we rely on the endeavour of the national cardiac societies and working groups. We encourage adoption and continuous development of national registries and hope that their coverage will expand in the future. A long-term goal is to develop an electronic database, which would allow free comparisons between and within the ESC countries. Such a database would provide a unique platform for future online multicentre registry-based clinical trials in arrhythmia therapy.25 The ESC plans to publish an Atlas on Cardiology in the near future. The Atlas will provide information on a wide range of cardiology procedures in Europe, but it will not substitute the White Book data collection.
Conclusions
During the last 9 years, the White Book has developed into a substantial asset not only for the cardiac EP community but also for healthcare administrators and politicians in the ESC area. The availability of quality information is essential to those facing the challenge of balancing healthcare budgets and allocating limited resources. The statistics presented herein show that, despite significant improvements in many areas of arrhythmia care, there is still considerable heterogeneity in the availability of invasive arrhythmia therapies across the ESC area. Reducing this gap continues to be one of the main objectives of EHRA.
Acknowledgements
The EHRA White Book 2015 and this analysis were possible thanks to the continuing efforts of several key contributors including chairmen and co-chairs of National Cardiac Societies and Arrhythmia Working Groups of the 56 ESC countries, and Yasmine Carrasset and other members of the EHRA staff at the Heart House. We are grateful for their invaluable contribution and hope that even more countries will be reporting data for the White Book next year. In addition, we want to thank the project sponsor, BIOTRONIK SE & Co. KG, and in particular to Robert Wuestenberg and Anja Thuemen for their dedication and passion in the conduction of the project. Finally, Prof. Panos Vardas and Prof. Christian Wolpert deserve special mention as the ‘fathers’ of the White Book project.
Conflict of interest: none declared.
