


Abstract
Left bundle branch block (LBBB) induces mechanical dyssynchrony, thereby compromising the coronary circulation in non-ischaemic cardiomyopathy. We sought to examine the effects of cardiac resynchronization therapy (CRT) on coronary flow dynamics and left ventricular (LV) function.
Twenty-two patients with non-ischaemic cardiomyopathy (New York Heart Association class, III or IV; LV ejection fraction, ≤35%; QRS duration, ≥130 ms) were enrolled. One week after implantation of the CRT device, coronary flow velocity and pressure in the left anterior descending coronary artery (LAD) and left circumflex coronary artery (LCx) were measured invasively, before and after inducing hyperemia by adenosine triphosphate administration, with two programming modes: sequential atrial and biventricular pacing (BiV) and atrial pacing in patients with LBBB or sequential atrial and right ventricular pacing in patients with complete atrioventricular block (Control). We assessed hyperemic microvascular resistance (HMR, mean distal pressure divided by hyperemic average peak velocity) and the relationship between the change in HMR and mid-term LV reverse remodelling. Hyperemic microvascular resistance was lower during BiV than during Control (LAD: 1.76 ± 0.47 vs. 1.54 ± 0.45, P < 0.001; LCx: 1.92 ± 0.42 vs. 1.73 ± 0.31, P = 0.003). The CRT-induced change in HMR of the LCx correlated with the percentage change in LV ejection fraction (R = −0.598, P = 0.011) and LV end-systolic volume (R = 0.609, P = 0.010) before and 6 months after CRT.
Cardiac resynchronization therapy improves coronary flow circulation by reducing microvascular resistance, which might be associated with LV reverse remodelling.
This is the first study to report the effect of cardiac resynchronization therapy (CRT) on phasic coronary flow and hyperemic microvascular resistance (HMR) in patients with non-ischaemic cardiomyopathy.
Cardiac resynchronization therapy improved the diastolic coronary flow parameters and HMR.
The change in the HMR of the left circumflex coronary artery correlated with the percentage change in the left ventricular ejection fraction and left ventricular end-systolic volume before and 6 months after CRT.
Introduction
Cardiac resynchronization therapy (CRT) has emerged as an effective treatment strategy for patients with advanced drug-refractory heart failure, left ventricular (LV) systolic dysfunction, and ventricular dyssynchrony.1 However, the mechanism underlying the beneficial effects of CRT is not entirely clear.
Abnormalities in myocardial blood flow have been observed in patients with dilated cardiomyopathy and LV systolic dysfunction, even though they have angiographically normal epicardial coronary arteries.2–4 In addition, left bundle branch block (LBBB) and right ventricular (RV) pacing induces mechanical dyssynchrony, which leads to the deterioration of coronary flow dynamics.5–10 Cardiac resynchronization therapy is recommended for those with LV dysfunction and dyssynchrony, but limited data are available on the effects of CRT on coronary flow dynamics. The effect of CRT on myocardial blood flow has been evaluated using positron-emission tomography.11 Only a few studies have been conducted on the invasive evaluation of the effects of CRT on coronary flow circulation by Doppler guidewire,12,13 and no study has addressed the effect of CRT on microvascular resistance despite its potential role in the pathophysiology of the failing heart. Therefore, the aim of this study was to investigate the effect of CRT on the phasic coronary flow pattern and microvascular resistance of the left anterior descending coronary artery (LAD) and left circumflex coronary artery (LCx), and to evaluate the relationships between the acute changes in microvascular resistance and mid-term response of LV function in patients with non-ischaemic cardiomyopathy.
Methods
Patients
Between 2009 and October 2012, 22 consecutive patients with non-ischaemic cardiomyopathy who were eligible for CRT were enrolled in this study. All 22 patients underwent coronary flow measurement 1 week after CRT device implantation. The indications for CRT were severe heart failure (New York Heart Association functional class III or IV) despite optimal medical therapy, LV ejection fraction (LVEF) of ≤35%, and QRS duration of ≥130 ms. Patients included in this study met the following criteria: (i) non-ischaemic cardiomyopathy, defined as angiographically normal coronary arteries assessed by coronary angiography; (ii) sinus rhythm; (iii) complete LBBB or complete atrioventricular block; and (iv) implantation of their first CRT device, including upgrade.
Transthoracic echocardiography was performed before device implantation and at the 6-month follow-up. All echocardiographic parameters were analysed by a board-certified cardiologist blinded to the coronary haemodynamic assessment, and were averaged in three consecutive cardiac cycles without ectopic beats. Left ventricular end-systolic volume (LVESV) and LVEF were measured by the modified biplane Simpson's method.14 Per cent changes in LVEF and LVESV at 6 months were calculated.
The study was performed in accordance with the Declaration of Helsinki and was approved by the institutional review board at Kobe University. All patients gave written informed consent before participation.
Device implantation and programming
All patients underwent implantation of 3 lead CRT systems. The right atrial leads were positioned in the right atrial appendage, and the RV leads, in the RV apex. The LV leads were implanted transvenously via the coronary sinus tributaries and placed such that they stimulated the lateral or posterolateral LV wall. All leads were connected to a CRT device (Consulta CRT-D, Protecta XT CRT-D, Medtronic Inc.; Atlas+HF, Promote RF, Promote+ RF, Unify, St. Jude medical). Cardiac resynchronization therapy device implantation was successful in all patients.
At 1 week after CRT, all patients were catheterized via a right or left radial approach, by using a 6 F sheath. Left ventricular pressure, LV dP/dt maximum, and LV dP/dt minimum were measured using a transducer-tipped pig-tail catheter. All patients underwent CRT optimization of atrioventricular delay and interventricular delay. The atrioventricular delay and interventricular delay were set such that the highest LV dP/dt maximum value was achieved.
Measurement of coronary flow and microvascular resistance
Coronary flow and microvascular resistance were measured after LV haemodynamic measurement and CRT optimization at 1 week after CRT. The 6 F guiding catheter was positioned with its tip in the ostium of the left main coronary artery after the administration of 5000 IU of heparin. A 0.014″ guidewire was advanced into the proximal segment of LAD and LCx by using a micro-catheter and was exchange for the 0.014″ Doppler wire (ComboWire™ model 9500, Volcano Corporation). Particular attention was paid to avoid damage to coronary arteries.
Coronary flow was measured during atrial pacing 5–10 beats per min above the intrinsic rate. The measurement was performed during two programming modes: atrial pacing in patients with LBBB or sequential atrial and RV pacing in patients with complete atrioventricular block (Control), and sequential atrial and biventricular pacing (BiV; Figure 1). Initially, CRT devices were set to Control or BiV, according to a randomization number (the sequence of pacing modalities tested was alternated to avoid systematic errors). Then, CRT devices were set to the alternate pacing mode.
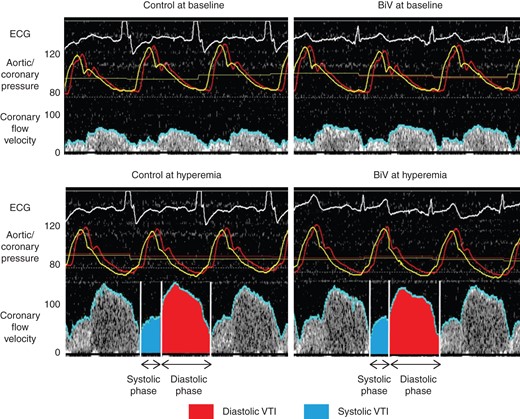
Representative case of coronary flow velocity and pressure measurements in the left anterior descending coronary artery at each condition. We have defined average peak velocity, diastolic velocity, systolic velocity, diastolic time, systolic time, diastolic velocity time integral (VTI), and systolic VTI. Control indicates atrial pacing in patients with left bundle-branch block or sequential atrial and right ventricular pacing in patients with complete atrioventricular block, and biventricular pacing (BiV) indicates sequential atrial and biventricular pacing. Red line indicates aortic pressure; yellow line, coronary pressure; blue line, coronary flow velocity. ECG, electrocardiogram.
Doppler signals were analysed by the ComboMap™ (Volcano Corporation) system. According to our protocol, when the tip of the wire was positioned such that the recorded signal was clearly defined, coronary flow velocity, distal pressure (coronary artery pressure), and proximal pressure (aortic pressure) were registered before and after induction of maximum hyperemia by intracoronary administration of 50 µg of adenosine triphosphate. The adenosine triphosphate bolus was administered twice every 10 min after adequate adenosine triphosphate wash-out, and the data were averaged for each patient. In alternate shifts of pacing modes, coronary flow was measured twice, every 10 min after stabilization of coronary flow and haemodynamic parameters.
The change in the coronary circulation parameters and haemodynamic parameters by CRT was defined as the difference between those variables during Control and BiV. We assessed the correlation between the change in these variables and percentage change in LVESV and LVEF from baseline to 6 months after CRT.
Statistical analysis
Continuous data were expressed as mean ± standard deviation. Categorical data were expressed as numbers or percentages. Continuous variables were compared between groups using the Mann–Whitney test and Wilcoxon signed ranks test, as appropriate. The correlations between two variables were evaluated using Pearson's test. A P-value of < 0.05 was considered significant for all tests. All analyses were made using the SPSS 16.0 software package (SPSS Inc.).
Results
The baseline clinical characteristics of the patients are described in Table 1. The LV leads were placed in the lateral (n = 18, 82%) or posterolateral (n = 4, 18%) veins. The optimal atrioventricular delay during atrial pacing was 182 ± 31 ms (LBBB: 188 ± 28 ms; complete atrioventricular block: 170 ± 35 ms) and the optimal interventricular delay was 22 ± 4 ms (LV pre-excitation). The coronary flow of the LAD was assessed in all patients. However, in four patients, clear recording the coronary flow of the LCx was difficult because of flexing properties. Therefore, measurements in the LCx were analysed only in the case of 18 patients.
Patients characteristics
| Parameter | n = 22 |
|---|---|
| Age, years | 65.3 ± 10.8 |
| Male gender, n (%) | 20 (91) |
| NYHA functional class | 3.1 ± 0.6 |
| PR interval (ms)a | 216 ± 42 |
| QRS duration (ms) | 170 ± 22 |
| LBBB, n (%) | 14 (64) |
| CAVB, n (%) | 8 (36) |
| LVEDD (mm) | 65.8 ± 9.0 |
| LVESD (mm) | 56.7 ± 12.0 |
| LVEF (%) | 28.2 ± 9.3 |
| LVEDV (mL) | 186 ± 69 |
| LVESV (mL) | 142 ± 66 |
| β blockers, n (%) | 21 (96) |
| ACE inhibitors or ARB, n (%) | 22 (100) |
| Calcium channel blockers, n (%) | 2 (9) |
| Diuretics, n (%) | 14 (64) |
| Spironolactone, n (%) | 11 (50) |
| Amiodarone, n (%) | 5 (23) |
NYHA, New York Heart Association class; LBBB, complete left bundle branch block; CAVB, complete atrioventricular block; LVEDD, left ventricular end-diastolic diameter; LVESD, left ventricular end-systolic diameter; LVEF, left ventricular ejection fraction; LVEDV, left ventricular end-diastolic volume; LVESV, left ventricular end-systolic volume; ACE, angiotensin converting enzyme; ARB, angiotensin receptor blocker.
aPR interval only in patients with LBBB.
Effect of cardiac resynchronization therapy on haemodynamics
The acute changes in the haemodynamic parameters in response to CRT are summarized in Table 2. Heart rate, aortic systolic and mean pressure, LV systolic pressure, and LV end-diastolic pressure showed no difference between Control and BiV. This finding reflected the equivalent haemodynamic condition on coronary flow circulation during Control and BiV. Left ventricular dP/dt maximum and LV dP/dt minimum during BiV were significantly greater than those during Control (P < 0.001, respectively).
Acute haemodynamic change
| Parameter | Control | BiV | P-value |
|---|---|---|---|
| Heart rate, per minute | 68.6 ± 7.5 | 68.7 ± 7.4 | 0.69 |
| Aortic systolic pressure, mmHg | 117 ± 31 | 119 ± 30 | 0.11 |
| Aortic mean pressure, mmHg | 85.7 ± 16.9 | 86.4 ± 17.4 | 0.12 |
| LV systolic pressure, mmHg | 110 ± 24 | 112 ± 22 | 0.07 |
| LV end-diastolic pressure, mmHg | 10.4 ± 4.5 | 9.3 ± 4.9 | 0.19 |
| LV dP/dt maximum, mmHg/s | 798 ± 228 | 873 ± 232 | <0.001* |
| LV dP/dt minimum, mmHg/s | −771 ± 222 | −854 ± 233 | <0.001* |
LV, left ventricular.
*P< 0.05, Control vs. biventricular pacing (BiV).
Effect of cardiac resynchronization therapy on coronary flow
The improvement in phasic coronary flow parameters at baseline and hyperemia are summarized in Tables 3 and 4. Mean distal pressure at baseline and hyperemia showed no differences between Control and BiV, indicating the absence of any significant effect of the two programming modes on intra-coronary pressure. Average peak velocity of the LAD at baseline and hyperemia were significantly higher during BiV than during Control (24.7 ± 8.8 vs. 21.9 ± 6.4 cm/s, P < 0.001, 55.8 ± 18.2 vs. 47.8 ± 14.8 cm/s, P < 0.001, respectively). Average peak velocity of the LCx at baseline and hyperemia were also significantly higher during BiV than during Control (20.6 ± 7.2 vs. 19.4 ± 7.7 cm/s, P = 0.02, 46.0 ± 8.2 vs. 42.5 ± 9.6 cm/s, P = 0.001, respectively). There was no significant difference in the APV between Control and BiV for both the LAD and LCx.
Phasic coronary flow parameters of the left anterior descending coronary artery
| Parameter | Baseline | Hyperemia | ||||
|---|---|---|---|---|---|---|
| Control | BiV | P-value | Control | BiV | P-value | |
| APV, cm/s | 21.9 ± 6.4 | 24.7 ± 8.8 | <0.001* | 47.8 ± 14.8 | 55.8 ± 18.2 | <0.001* |
| Systolic velocity, cm/s | 12.6 ± 5.6 | 14.0 ± 6.6 | 0.04* | 27.9 ± 14.2 | 33.5 ± 16.1 | 0.005* |
| Diastolic velocity, cm/s | 26.6 ± 7.4 | 30.6 ± 11.0 | <0.001* | 56.2 ± 17.2 | 66.2 ± 21.7 | <0.001* |
| Systolic time, ms | 295 ± 36 | 291 ± 31 | 0.33 | 307 ± 39 | 300 ± 32 | 0.37 |
| Diastolic time, ms | 595 ± 64 | 602 ± 63 | 0.49 | 592 ± 67 | 594 ± 82 | 0.68 |
| Systolic VTI, cm | 3.8 ± 1.9 | 4.2 ± 2.1 | 0.04* | 8.3 ± 3.9 | 10.1 ± 5.0 | 0.02* |
| Diastolic VTI, cm | 15.6 ± 3.6 | 18.1 ± 6.2 | 0.001* | 33.4 ± 10.4 | 38.4 ± 12.2 | <0.001* |
| Total VTI, cm | 19.4 ± 5.0 | 22.2 ± 7.7 | <0.001* | 41.7 ± 13.0 | 48.5 ± 15.2 | <0.001* |
| Mean distal pressure, mmHg | 85.9 ± 15.4 | 85.7 ± 17.4 | 0.11 | 78.5 ± 14.1 | 79.5 ± 15.9 | 0.41 |
APV, average peak velocity; VTI, velocity time integral.
*P< 0.05, Control vs. biventricular pacing (BiV).
Phasic coronary flow parameters of the left circumflex coronary artery
| Parameter | Baseline | Hyperemia | ||||
|---|---|---|---|---|---|---|
| Control | BiV | P-value | Control | BiV | P-value | |
| APV, cm/s | 19.4 ± 7.7 | 20.6 ± 7.2 | 0.02* | 42.5 ± 9.6 | 46.0 ± 8.2 | 0.001* |
| Systolic velocity, cm/s | 12.3 ± 5.9 | 12.4 ± 5.0 | 0.71 | 27.7 ± 9.2 | 27.3 ± 7.7 | 0.86 |
| Diastolic velocity, cm/s | 23.6 ± 9.2 | 24.9 ± 8.6 | 0.09 | 51.1 ± 11.7 | 55.0 ± 10.7 | <0.001* |
| Systolic time, ms | 292 ± 28 | 291 ± 24 | 0.53 | 305 ± 36 | 300 ± 33 | 0.31 |
| Diastolic time, ms | 598 ± 67 | 595 ± 75 | 0.91 | 580 ± 68 | 588 ± 74 | 0.41 |
| Systolic VTI, cm | 3.6 ± 1.9 | 3.6 ± 1.6 | 0.82 | 8.6 ± 3.6 | 8.3 ± 2.9 | 0.63 |
| Diastolic VTI, cm | 14.2 ± 6.1 | 15.0 ± 6.1 | 0.14 | 29.8 ± 8.3 | 32.5 ± 8.4 | <0.001* |
| Total VTI, cm | 17.8 ± 7.6 | 18.6 ± 7.3 | 0.21 | 38.4 ± 10.5 | 40.8 ± 9.2 | 0.003* |
| Mean distal pressure, mmHg | 85.8 ± 11.5 | 86.5 ± 10.2 | 0.38 | 78.7 ± 10.7 | 78.1 ± 10.1 | 0.93 |
APV, average peak velocity; VTI, velocity time integral.
*P< 0.05, Control vs. biventricular pacing (BiV).
At baseline, several phasic coronary flow parameters of LAD were significantly higher during BiV than during Control (14.0 ± 6.6 vs. 12.6 ± 5.6 cm/s for systolic velocity, 30.6 ± 11.0 vs. 26.6 ± 7.4 cm/s for diastolic velocity, 4.2 ± 2.1 vs. 3.8 ± 1.9 cm for systolic velocity time integral, 18.1 ± 6.2 vs.15.6 ± 3.6 cm for diastolic velocity time integral, 22.2 ± 7.6 vs. 19.4 ± 5.0 cm for total velocity time integral; P < 0.05 for both). Similarly, at hyperemia, some of the parameters of the LAD were significantly higher during BiV than those during Control (33.5 ± 16.1 vs. 27.9 ± 14.2 cm/s for systolic velocity, 66.2 ± 21.7 vs. 56.2 ± 17.2 cm/s for diastolic velocity, 10.1 ± 5.0 vs. 8.3 ± 3.9 cm for systolic velocity time integral, 38.4 ± 12.2 vs. 33.4 ± 10.4 cm for diastolic velocity time integral, 48.5 ± 15.2 vs. 41.7 ± 13.0 cm for total velocity time integral; P < 0.05 for both). No significant changes were observed in systolic and diastolic time in the LAD.
In contrast, no significant differences were observed in any of the parameters at baseline in the LCx. Some of the phasic coronary flow parameters of the LCx at hyperemia were significantly higher during BiV than during Control (55.0 ± 10.7 vs. 51.1 ± 11.7 cm/s for diastolic velocity, 32.5 ± 8.4 vs. 29.8 ± 8.3 cm for diastolic velocity time integral, 40.8 ± 9.2 vs. 38.4 ± 10.5 cm for total velocity time integral; P < 0.005 for both). No significant changes were observed in systolic velocity, systolic time, diastolic time, and systolic velocity time integral.
There was no significant difference in the CFR between Control and BiV in the case of both the LAD and LCx (LAD: 2.26 ± 0.58 vs. 2.33 ± 0.52, P = 0.56; LCx: 2.39 ± 0.73 vs. 2.40 ± 0.68, P = 0.89). Hyperemic microvascular resistance was significantly lower during BiV than during Control (LAD: 1.54 ± 0.45 vs. 1.76 ± 0.47, P < 0.001; LCx: 1.73 ± 0.31 vs. 1.92 ± 0.42, P = 0.003; Figure 2). In this short-term study, no correlations were observed between the changes in LV dP/dt maximum and LV dP/dt minimum induced by CRT and the changes in the APV, CFR, and HMR both in LAD and LCx.
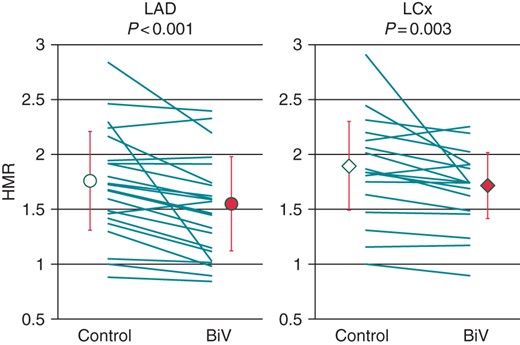
Effect of cardiac resynchronization therapy on hyperemic microvascular resistance in the left anterior descending coronary artery (LAD) and left circumflex coronary artery (LCx). Hyperemic microvascular resistance index (HMR) was significantly lower during biventricular pacing (BiV) than during Control (LAD, 1.76 ± 0.47 vs. 1.54 ± 0.45; P < 0.001; LCx, 1.92 ± 0.42 vs. 1.73 ± 0.31; P = 0.003).
Relationships between the changes in coronary circulation parameters and echocardiographic response to cardiac resynchronization therapy
One patient died of severe pneumonia 3 months after CRT. Thus, 21 patients underwent 6 months echocardiographic evaluation of LV function, and the correlations between the acute changes in coronary circulation parameters and percentage change in LVESV and LVEF were evaluated in these patients.
Overall, LVEF and LVESV showed a significant improvement at 6 months after CRT compared with the values before CRT (LVEF: 28.2 ± 9.3–41.5 ± 11.3%, P < 0.001; LVESV: 142 ± 66 to 96 ± 57 mL, P < 0.001). The acute changes in HMR of the LCx induced by CRT correlated with percentage change in LVEF (R = −0.598, P = 0.011; Figure 3) and LVESV (R = 0.609, P = 0.010; Figure 3) before and 6 months after CRT. However, these correlations were not observed in the case of the LAD. Additionally, the changes in the CFR, APV, phasic coronary flow parameters, LV end-diastolic pressure, LV dP/dt maximum, or LV dP/dt minimum in the acute study were not correlated with the chronic alteration of LVEF and LVESV.
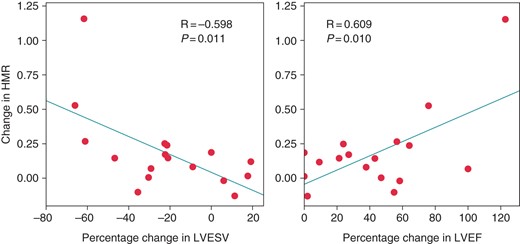
The correlation between change in hyperemic microvascular resistance (HMR) of the left circumflex coronary artery in the acute study and percentage change in left ventricular end-systolic volume (LVESV) and left ventricular ejection fraction (LVEF) after 6 months. The change in HMR was defined as HMR during Control minus HMR during biventricular pacing (BiV). The change in HMR of the left circumflex coronary artery correlated with the percentage change in the left ventricular end-systolic volume (LVESV, R = −0.598; P = 0.011) and left ventricular ejection fraction (LVEF, R = 0.609; P = 0.010) before and 6 months after cardiac resynchronization therapy.
Discussion
The major findings of this study are as follows: (i) both baseline and hyperemic APV of the LAD and LCx were significantly higher during BiV than during Control, without significant change in coronary haemodynamics; (ii) the diastolic coronary flow parameters of both the LAD and LCx improved during BiV; (iii) HMR of both the LAD and LCx was lower during BiV than during Control; and (iv) the change in the HMR of the LCx correlated with the percentage change in LVEF and LVESV before and 6 months after CRT.
Recent reports suggest that a marked decrease in myocardial capillary density was found in patients with idiopathic dilated cardiomyopathy,2,16 which correlated with a decrease in CFR.2 Patients with LBBB and RV pacing due to an increase in intramyocardial pressure exhibit reduced myocardial perfusion in the interventricular septum,5,7–9 which leads to LV remodelling over the long term.6 We found evidence of such an acute effect of CRT on coronary flow circulation and microvascular resistance. This may represent one of the beneficial physiological changes that lead to the CRT-induced improvement in LV function and clinical condition of these patients.
Effect of cardiac resynchronization therapy on coronary flow circulation in patients with non-ischaemic cardiomyopathy with left ventricular dyssynchrony
Left ventricular systolic dyssynchrony induced by LBBB or RV pacing has been reported to reduce LAD flow, and BiV results in an improvement in coronary flow in the LAD.17,18 Another study based on positron-emission tomography suggested that CRT induced an increase in septal perfusion rather than lateral perfusion.11 Consistently, coronary flow in the LAD showed greater improvement than that in the LCx in this study. Additionally, the diastolic coronary flow parameters of the LAD and LCx showed improvement. Myocardial perfusion is a predominantly diastolic process; however, dyssynchrony of the heart shortens diastole by prolonging the overall time for the development of tension during the cardiac cycle19 and shortening of LV filling time.20 Furthermore, CRT increases the diastolic LV filling time.21 However, the diastolic time of phasic coronary flow parameters was not prolonged in this study. Similarly, a previous study revealed that diastolic perfusion time in positron-emission tomography remained unaltered during BiV compared with that during Control,11 because mechanical ejection time is hardly affected by CRT.22 These data suggest that, in contrast to wall stress, the diastolic time of coronary flow does not play an important role in the changes observed in microvascular circulation during CRT. Another study reported that CRT improves heart–arterial coupling reducing arterial load and changing aortic flow within about 1 month after CRT.23 This might contribute to the improvement in coronary flow.
Recent studies have shown that hyperemic myocardial blood flow and myocardial blood flow reserve were greater during BiV than during Control in patients with dilated cardiomyopathy or ischaemic cardiomyopathy, at 3 months after CRT device implantation.11 Studies have also shown that in patients with ischaemic and non-ischaemic cardiomyopathy, BiV results in a higher CFR in the LAD than RV pacing in response to CRT, over the long term.12,13 In this study, however, CFR in the LAD and LCx showed no significant differences between BiV and Control. A possible explanation for this discrepancy between the findings of previous studies and ours can be attributed to the differences in patient population, timing of coronary flow investigation, and modality to assess CFR. It is possible that CFR might improve in the long term in our study population.
Impact of restoration of coronary flow with cardiac resynchronization therapy on left ventricular reverse remodelling
We hypothesized that the beneficial effects of CRT on myocardial perfusion may contribute to the reverse remodelling process. A significant improvement of CFR in LAD after CRT correlates with reduction of QRS duration. This study demonstrated that CRT caused the reduction in HMR, which correlated with echocardiographic improvement by CRT. Hyperemic microvascular resistance is obtained by the direct measurement of coronary microvascular resistance and may be a more sensitive parameter of microvascular dysfunction than CFR. LCx maintains perfusion of the LV lateral wall that is generally the site of latest mechanical activation in patients with LBBB or RV pacing. The CRT-induced improvement in mechanical dyssynchrony might decrease the microvascular resistance in the lateral wall, which in turn might result reduce in HMR of the LCx. Therefore, the reduction in HMR of the LCx might play a role in the recovery of global LV function after CRT implantation. The beneficial changes in coronary flow circulation and microvascular resistance induced by the resynchronization of ventricular activation might be a mechanism of the beneficial impact of CRT in patients with non-ischaemic cardiomyopathy and heart failure.
Limitations
Although coronary flow velocity assessed using intracoronary Doppler measurement does not reflect the actual volumetric flow, extensive animal studies have proved the accuracy of this technique in the assessment of changes in coronary flow. In this study, we could not investigate the coronary flow before the implantation of a CRT device. In addition, only a limited number of patients were investigated in this study. This was because this investigation used the invasive approach, and therefore, repeated measurements could not be performed over time and a larger number of patients could not be catheterized. The LV filling pressure was not recorded, because the right heart catheterization was not performed. However, LV end-diastolic pressure was not high. Thus, the impact of LV filling pressure on coronary flow measurements was thought to be minimum in this study setting. The reversed remodelling could contribute to the effects of CRT on coronary microcirculation but this was thought to be minimum in only one week after CRT implantation. Immediately after changing alternate pacing modes, coronary flow parameters returned to baseline or peak values within 10 min, which suggests that the effect of BiV during one week on coronary microcirculation is limited. Tracking the coronary flow velocity of the LCx was difficult because of the flexing properties of the artery. Therefore, the possibility of the underestimation of coronary flow could not be ruled out. Further studies are needed to investigate the underlying mechanisms responsible for changes in coronary circulation induced by CRT.
Conclusion
To our knowledge, this is the first study reporting the findings of the effect of CRT on phasic coronary flow and microvascular resistance in patients with non-ischaemic cardiomyopathy. Phasic coronary parameters showed greater improvement during BiV than during Control, especially in the diastolic phase. Thus, CRT exerts a beneficial effect on coronary flow circulation through the reduction of microvascular resistance. Furthermore, the acute improvement in the HMR of the LCx correlated with the echocardiographic response to CRT. These findings might suggest the existence of another possible underlying mechanism for the improvement in LV function in response to CRT over optimal medical therapy.
Acknowledgements
The authors are grateful for the support of the entire staff of the electrophysiological and catheterization laboratories of the Kobe University Hospital.
Conflict of interest: none declared.
